| Param | Original file | Final file |
|---|---|---|
| Filename | modeM0/AS1P01_118T02_9000000082_00583cztM0_level2.evt | modeM0/AS1P01_118T02_9000000082_00583cztM0_level2_quad_clean.evt |
| Size (bytes) | 781,672,320 | 66,288,960 |
| Size | 745.5 MB | 63.2 MB |
| Events in quadrant A | 5,926,323 | 416,750 |
| Events in quadrant B | 6,417,727 | 418,996 |
| Events in quadrant C | 5,283,460 | 421,019 |
| Events in quadrant D | 5,719,004 | 406,090 |
| Mode M0 | |||
|---|---|---|---|
| Quadrant | BADHDUFLAG | Total packets | Discarded packets |
| A | 0 | 21104 | 26 |
| B | 0 | 22561 | 22 |
| C | 0 | 19214 | 24 |
| D | 0 | 20507 | 36 |
| Mode SS | |||
|---|---|---|---|
| Quadrant | BADHDUFLAG | Total packets | Discarded packets |
| A | 0 | 100 | 0 |
| B | 0 | 100 | 0 |
| C | 0 | 100 | 0 |
| D | 0 | 100 | 0 |
| Mode M9 | |||
|---|---|---|---|
| Quadrant | BADHDUFLAG | Total packets | Discarded packets |
| A | 0 | 22 | 0 |
| B | 0 | 22 | 0 |
| C | 0 | 22 | 0 |
| D | 0 | 22 | 0 |
| Quadrant | Total seconds | Saturated seconds | Saturation percentage |
|---|---|---|---|
| A | 4908 | 15 | 0.305623% |
| B | 4908 | 63 | 1.283619% |
| C | 4907 | 1 | 0.020379% |
| D | 4905 | 58 | 1.182467% |
Noise dominated data is calculated using 1-second bins in cleaned event files. If a bin has >2000 counts, and if more than 50% of those come from <1% of pixels, then it is considered to be noise-dominated and hence unusable.
| Quadrant | # 1 sec bins | Bins with >0 counts | Bins with >2000 counts | High rate bins dominated by noise | Noise dominated (total time) | Noise dominated (detector-on time) | Marked lightcurve |
|---|---|---|---|---|---|---|---|
| A | 7069 | 4914 | 151 | 151 | 2.14% | 3.07% | 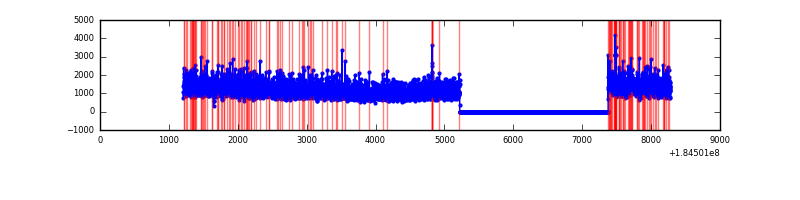 |
| B | 7069 | 4913 | 253 | 253 | 3.58% | 5.15% | 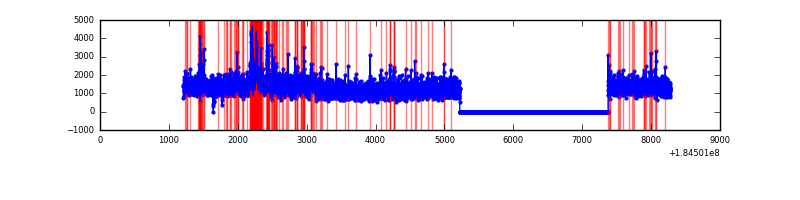 |
| C | 7069 | 4913 | 32 | 32 | 0.45% | 0.65% | 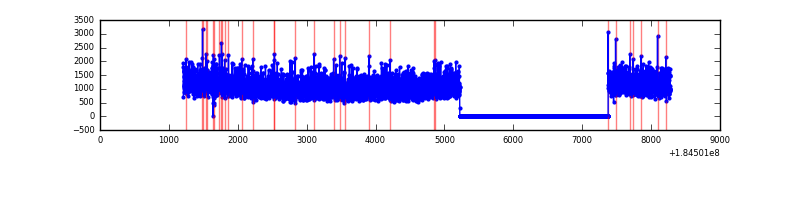 |
| D | 7069 | 4913 | 176 | 176 | 2.49% | 3.58% | 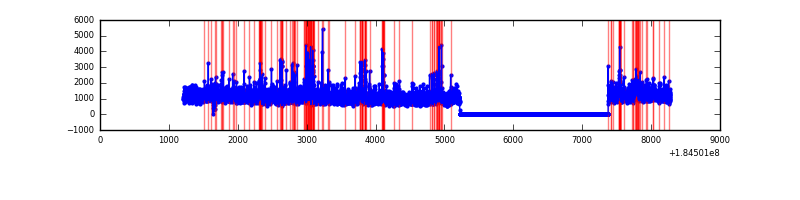 |
Top three noisy pixels from each quadrant. If the there are fewer than three noisy pixels in the level2.evt file, extra rows are filled as -1
| Pixel properties | Quadrant properties | ||||||
|---|---|---|---|---|---|---|---|
| Quadrant | DetID | PixID | Counts | Sigma | Mean | Median | Sigma |
| A | 0 | 69 | 72611 | 212.89 | 1495 | 1482 | 334.1 |
| A | 13 | 160 | 41631 | 120.17 | 1495 | 1482 | 334.1 |
| A | 0 | 238 | 17650 | 48.39 | 1495 | 1482 | 334.1 |
| B | 7 | 221 | 329340 | 935.92 | 1461 | 1472 | 350.3 |
| B | 4 | 206 | 319067 | 906.6 | 1461 | 1472 | 350.3 |
| B | 4 | 250 | 144089 | 407.11 | 1461 | 1472 | 350.3 |
| C | 15 | 241 | 44355 | 115.33 | 1325 | 1373 | 372.7 |
| C | 3 | 159 | 21307 | 53.49 | 1325 | 1373 | 372.7 |
| C | 5 | 249 | 7094 | 15.35 | 1325 | 1373 | 372.7 |
| D | 1 | 4 | 159807 | 410.83 | 1332 | 1366 | 385.7 |
| D | 13 | 221 | 138366 | 355.23 | 1332 | 1366 | 385.7 |
| D | 13 | 216 | 72227 | 183.74 | 1332 | 1366 | 385.7 |
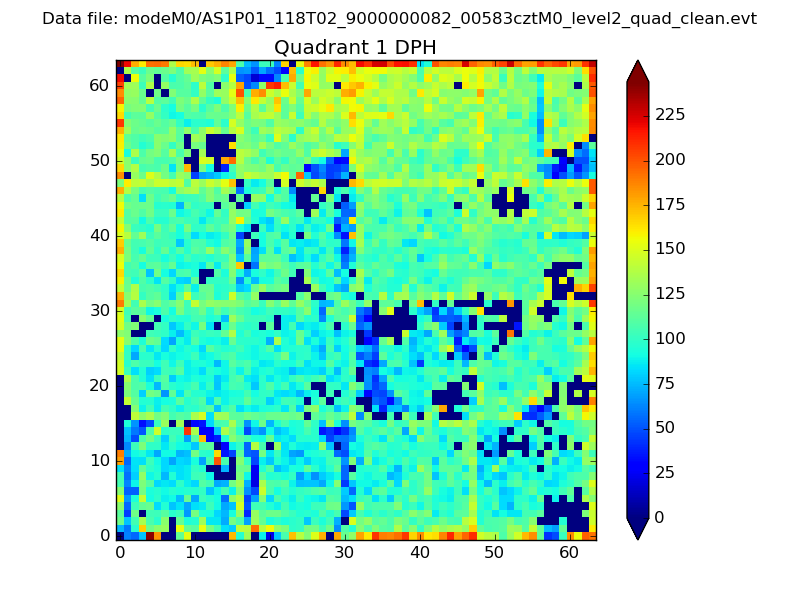
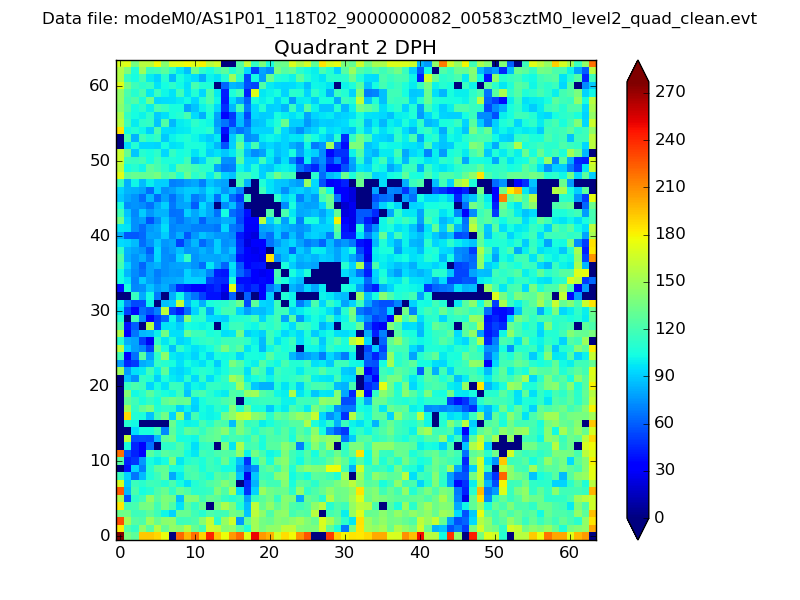
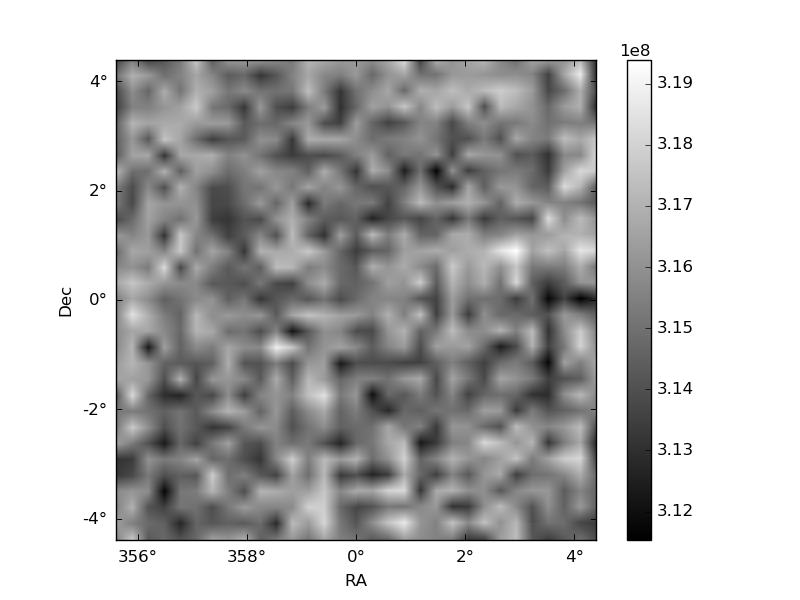
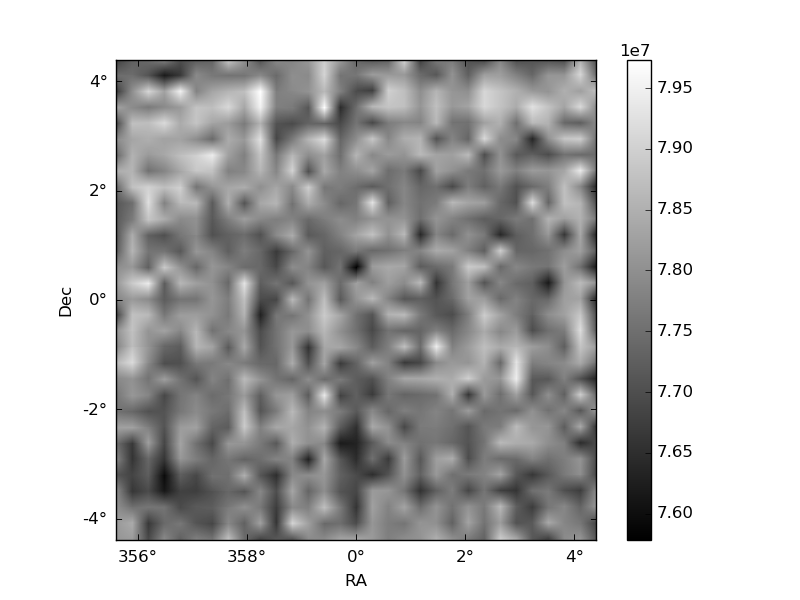
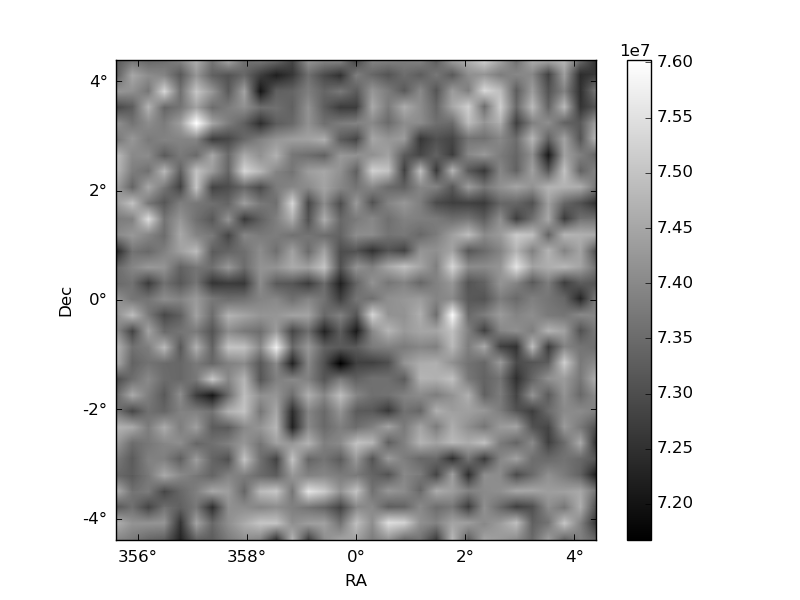
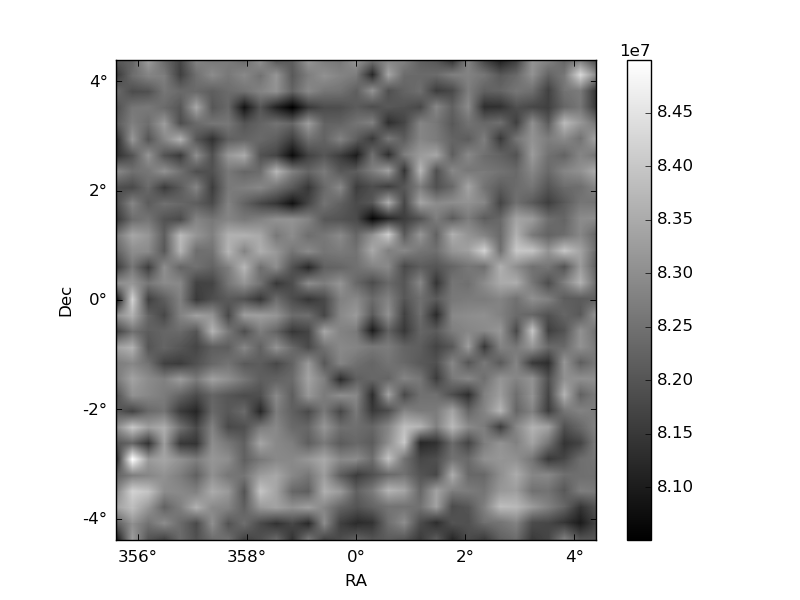
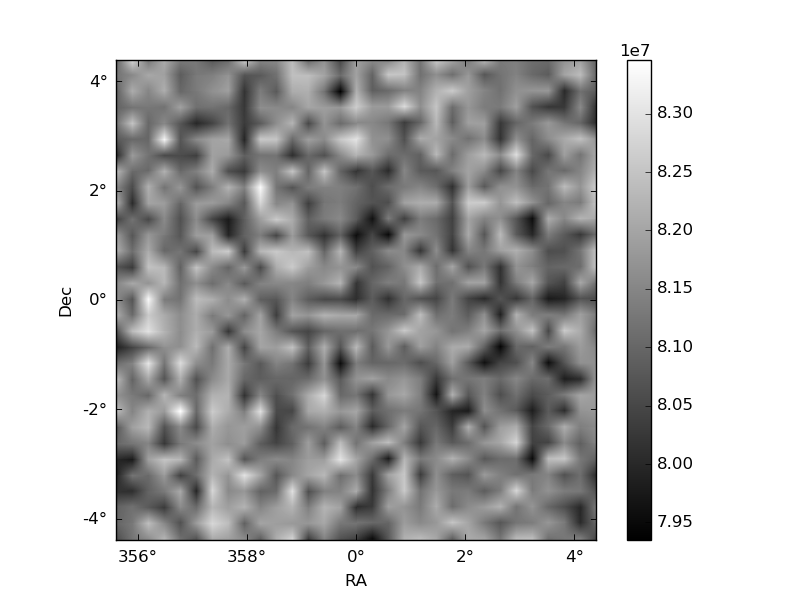
Histogram calculated using DETX and DETY for each event in the final _common_clean file
| Quadrant A |  |
 |
Quadrant B |
|---|---|---|---|
| Quadrant D | 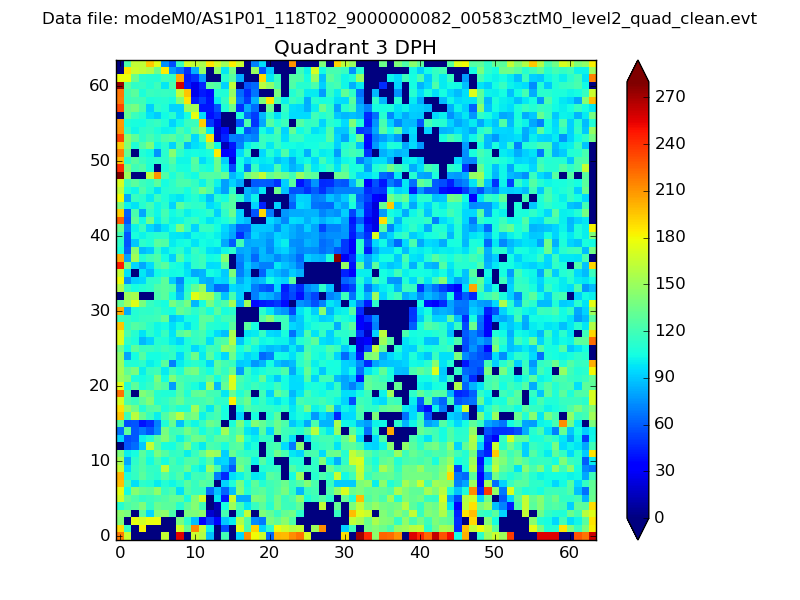 |
 |
Quadrant C |
| Plot type | Count rate plots | Images |
|---|---|---|
| Comparison with Poisson distribution Blue bars denote a histogram of data divided into 1 sec bins. Red curve is a Poisson curve with rate = median count rate of data. |
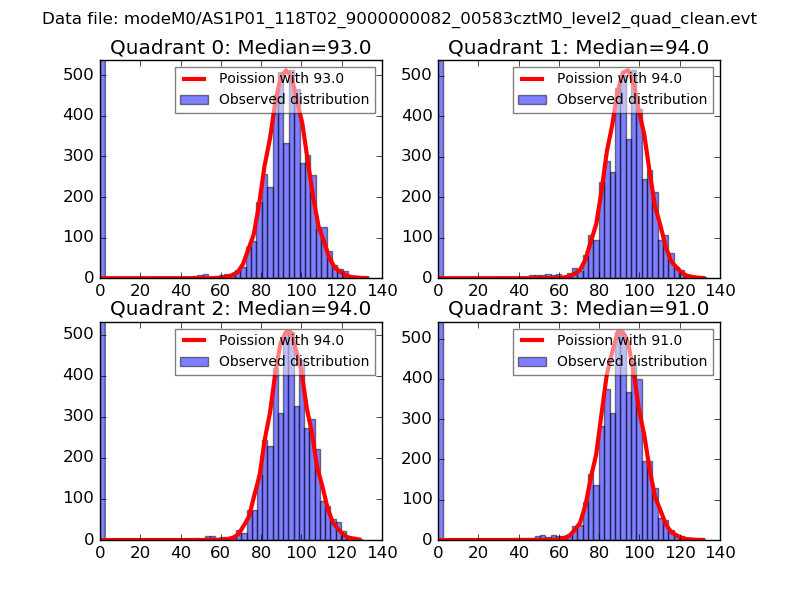 |
 |
| Quadrant-wise count rates Data is divided into 100 sec bins |
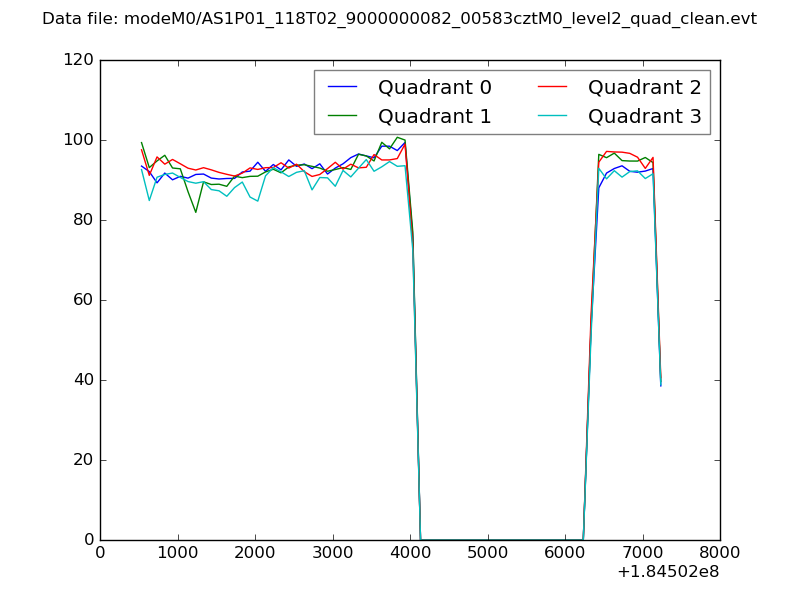 |
|
| Module-wise count rates for Quadrant A Data is divided into 100 sec bins |
 |
 |
| Module-wise count rates for Quadrant B Data is divided into 100 sec bins |
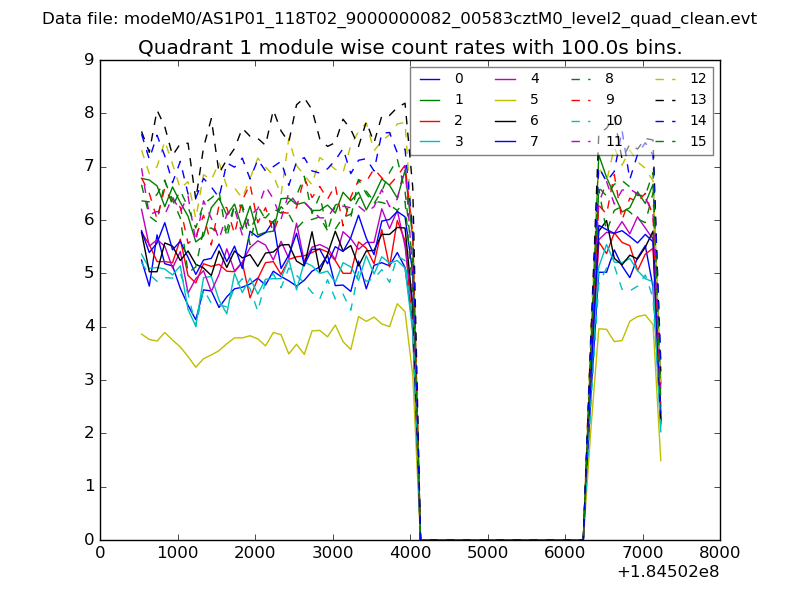 |
 |
| Module-wise count rates for Quadrant C Data is divided into 100 sec bins |
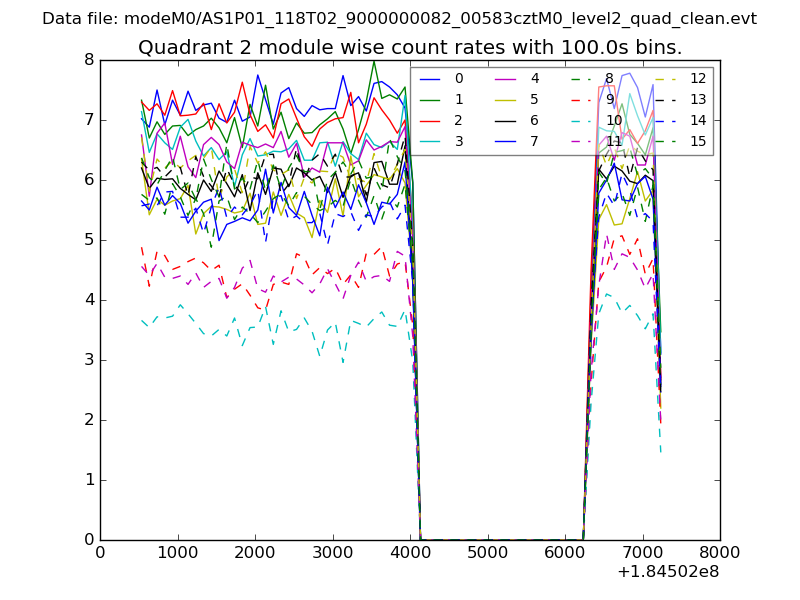 |
 |
| Module-wise count rates for Quadrant D Data is divided into 100 sec bins |
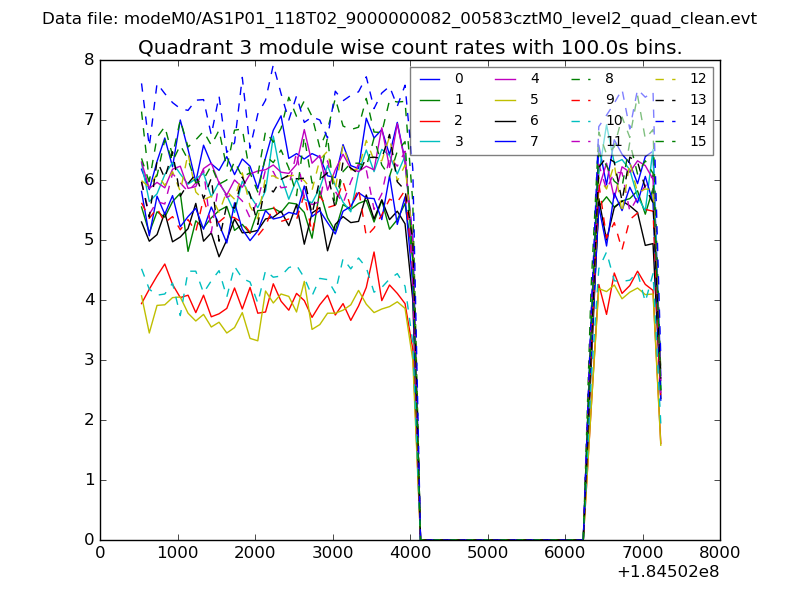 |
 |
| Parameter | Plot |
|---|---|
| CZT HV Monitor | 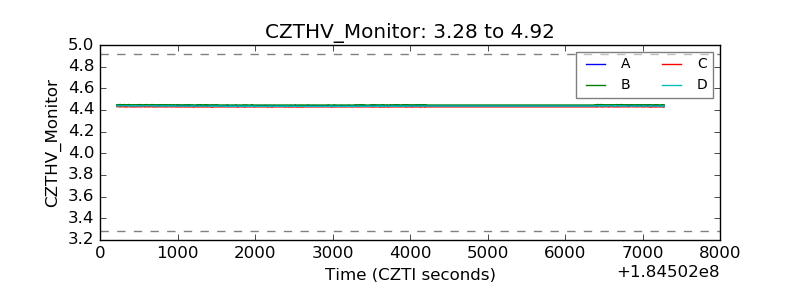 |
| D_VDD | 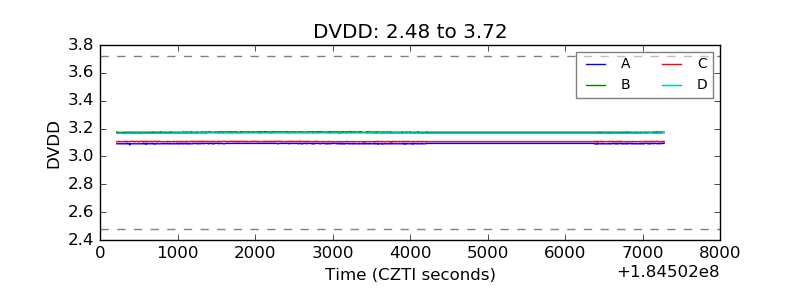 |
| Temperature 1 | 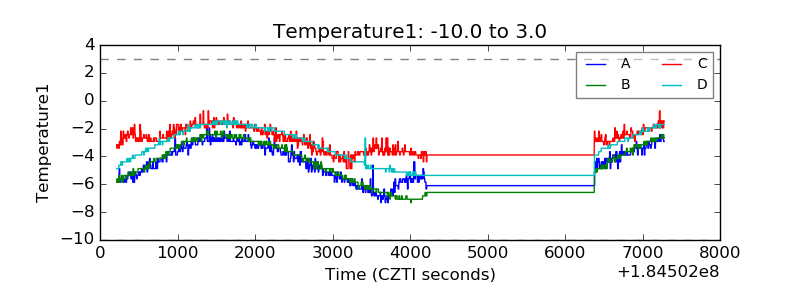 |
| Veto HV Monitor | 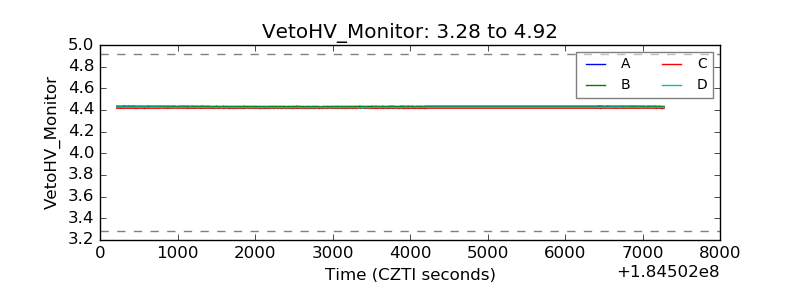 |
| Veto LLD | 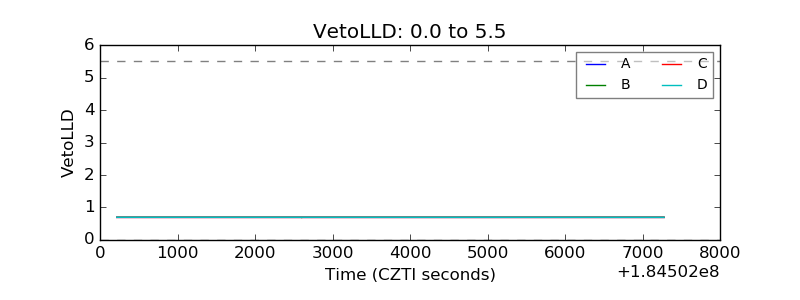 |
| Alpha Counter | 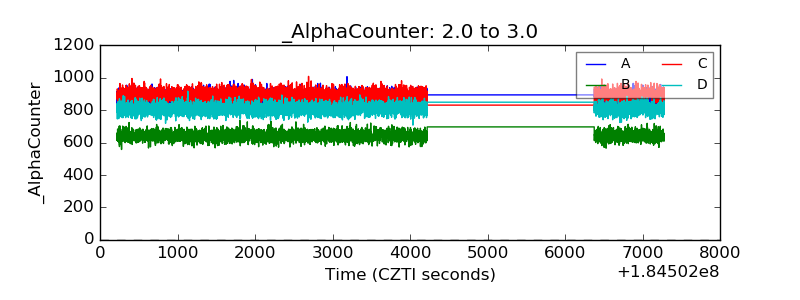 |
| _CPM_Rate | 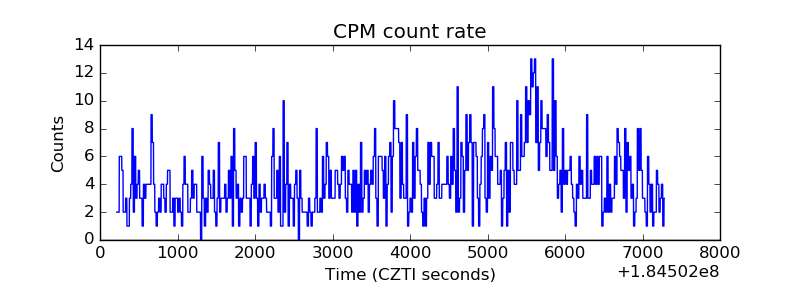 |
| CZT Counter | 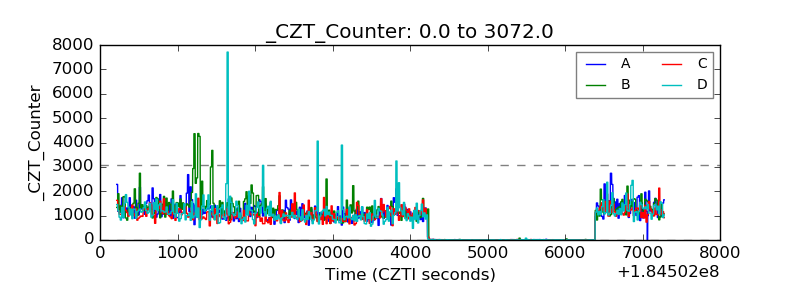 |
| +2.5 Volts monitor |  |
| +5 Volts monitor |  |
| _ROLL_ROT | 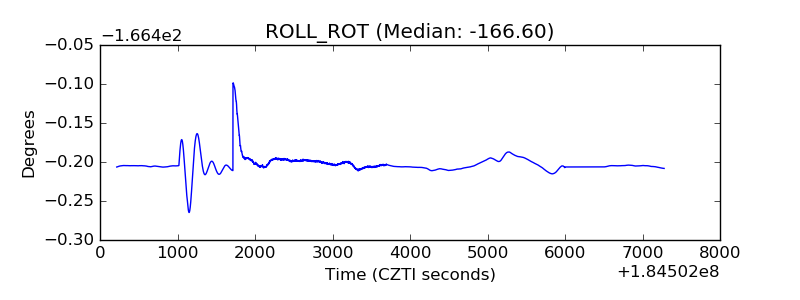 |
| _Roll_DEC | 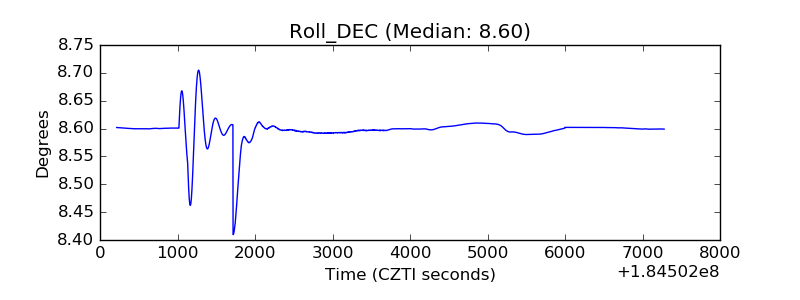 |
| _Roll_RA | 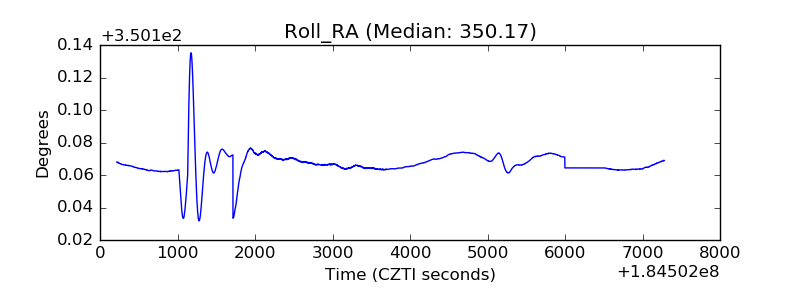 |
| Veto Counter | 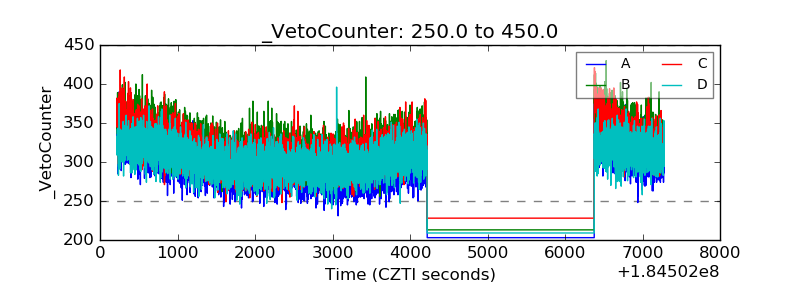 |