| Param | Original file | Final file |
|---|---|---|
| Filename | modeM0/AS1P01_118T02_9000000082_00584cztM0_level2.evt | modeM0/AS1P01_118T02_9000000082_00584cztM0_level2_quad_clean.evt |
| Size (bytes) | 785,165,760 | 65,263,680 |
| Size | 748.8 MB | 62.2 MB |
| Events in quadrant A | 5,894,213 | 409,447 |
| Events in quadrant B | 5,967,392 | 412,168 |
| Events in quadrant C | 5,286,538 | 409,481 |
| Events in quadrant D | 6,299,636 | 396,083 |
| Mode M0 | |||
|---|---|---|---|
| Quadrant | BADHDUFLAG | Total packets | Discarded packets |
| A | 0 | 21024 | 2 |
| B | 0 | 21278 | 1 |
| C | 0 | 19250 | 1 |
| D | 0 | 22264 | 1 |
| Mode SS | |||
|---|---|---|---|
| Quadrant | BADHDUFLAG | Total packets | Discarded packets |
| A | 0 | 102 | 0 |
| B | 0 | 102 | 0 |
| C | 0 | 102 | 0 |
| D | 0 | 102 | 0 |
| Mode M9 | |||
|---|---|---|---|
| Quadrant | BADHDUFLAG | Total packets | Discarded packets |
| A | 0 | 21 | 0 |
| B | 0 | 21 | 0 |
| C | 0 | 21 | 0 |
| D | 0 | 21 | 0 |
| Quadrant | Total seconds | Saturated seconds | Saturation percentage |
|---|---|---|---|
| A | 4974 | 7 | 0.140732% |
| B | 4974 | 9 | 0.180941% |
| C | 4974 | 1 | 0.020105% |
| D | 4974 | 58 | 1.166064% |
Noise dominated data is calculated using 1-second bins in cleaned event files. If a bin has >2000 counts, and if more than 50% of those come from <1% of pixels, then it is considered to be noise-dominated and hence unusable.
| Quadrant | # 1 sec bins | Bins with >0 counts | Bins with >2000 counts | High rate bins dominated by noise | Noise dominated (total time) | Noise dominated (detector-on time) | Marked lightcurve |
|---|---|---|---|---|---|---|---|
| A | 7100 | 4975 | 117 | 117 | 1.65% | 2.35% | 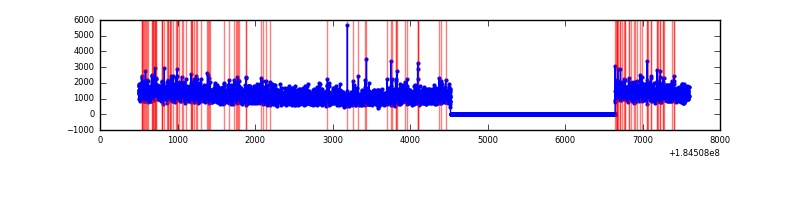 |
| B | 7100 | 4975 | 97 | 97 | 1.37% | 1.95% | 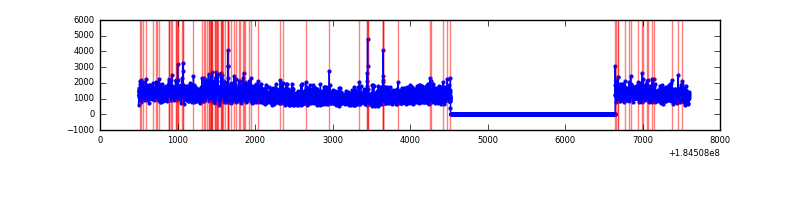 |
| C | 7100 | 4975 | 30 | 30 | 0.42% | 0.60% | 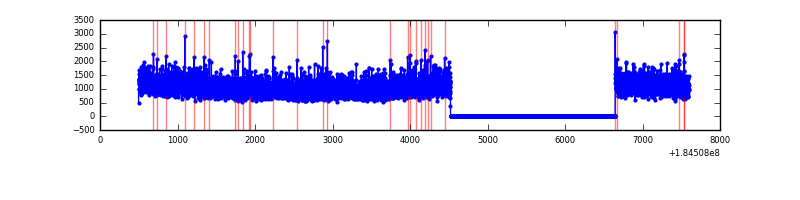 |
| D | 7100 | 4975 | 273 | 273 | 3.85% | 5.49% | 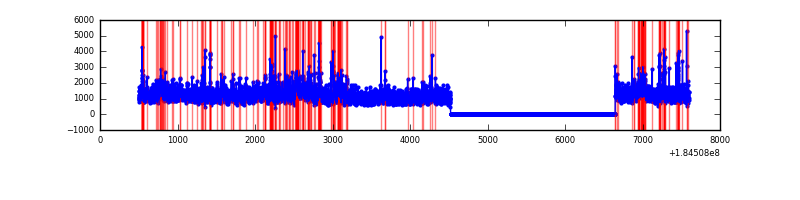 |
Top three noisy pixels from each quadrant. If the there are fewer than three noisy pixels in the level2.evt file, extra rows are filled as -1
| Pixel properties | Quadrant properties | ||||||
|---|---|---|---|---|---|---|---|
| Quadrant | DetID | PixID | Counts | Sigma | Mean | Median | Sigma |
| A | 0 | 69 | 41059 | 119.83 | 1492 | 1481 | 330.3 |
| A | 13 | 160 | 29164 | 83.82 | 1492 | 1481 | 330.3 |
| A | 14 | 79 | 22005 | 62.14 | 1492 | 1481 | 330.3 |
| B | 7 | 221 | 260790 | 752.85 | 1455 | 1468 | 344.5 |
| B | 4 | 250 | 59569 | 168.68 | 1455 | 1468 | 344.5 |
| B | 4 | 206 | 26911 | 73.87 | 1455 | 1468 | 344.5 |
| C | 15 | 241 | 42408 | 110.95 | 1320 | 1367 | 369.9 |
| C | 12 | 127 | 33436 | 86.7 | 1320 | 1367 | 369.9 |
| C | 1 | 1 | 10686 | 25.19 | 1320 | 1367 | 369.9 |
| D | 13 | 216 | 501700 | 1291.82 | 1323 | 1361 | 387.3 |
| D | 1 | 4 | 208540 | 534.91 | 1323 | 1361 | 387.3 |
| D | 12 | 237 | 101797 | 259.31 | 1323 | 1361 | 387.3 |
Histogram calculated using DETX and DETY for each event in the final _common_clean file
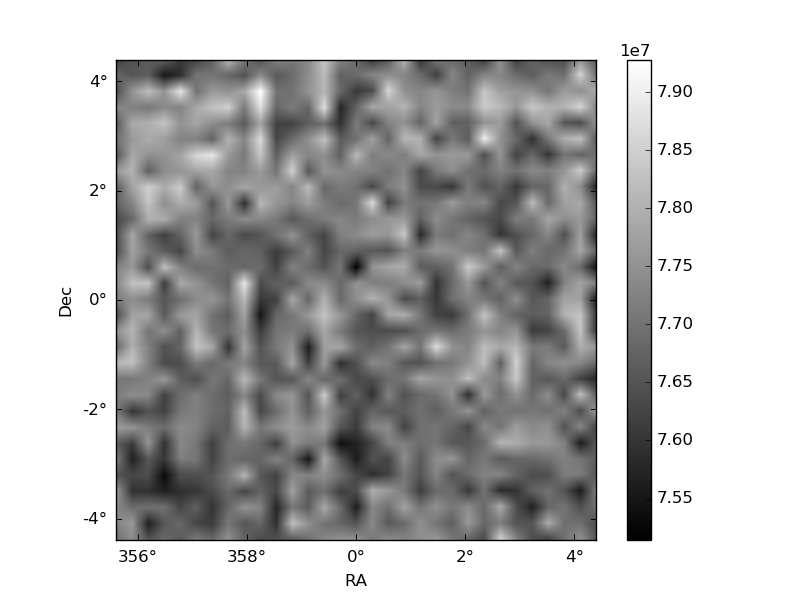
| Quadrant A |  |
 |
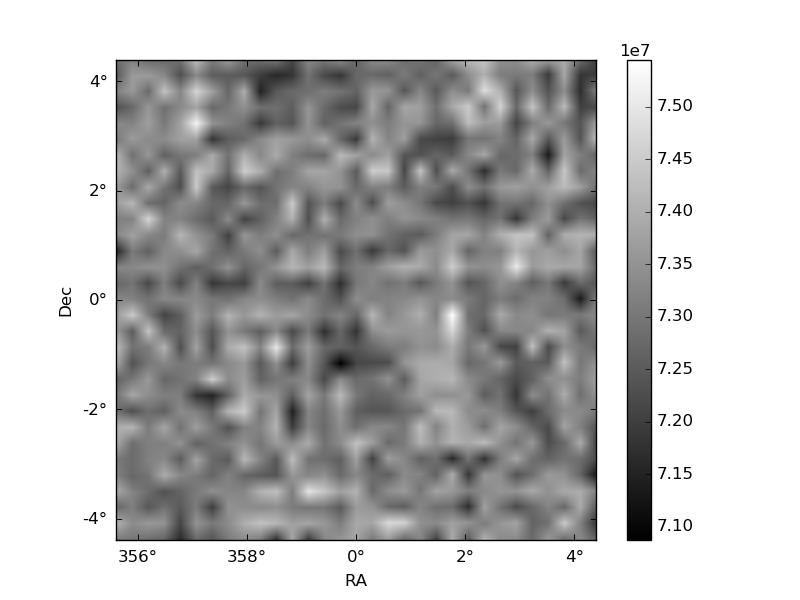
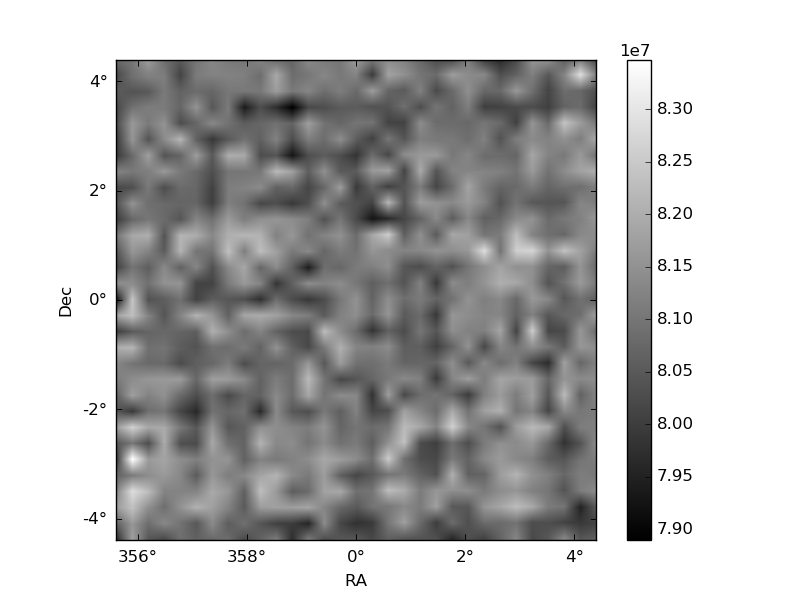
Quadrant B |
|---|---|---|---|
| Quadrant D |  |
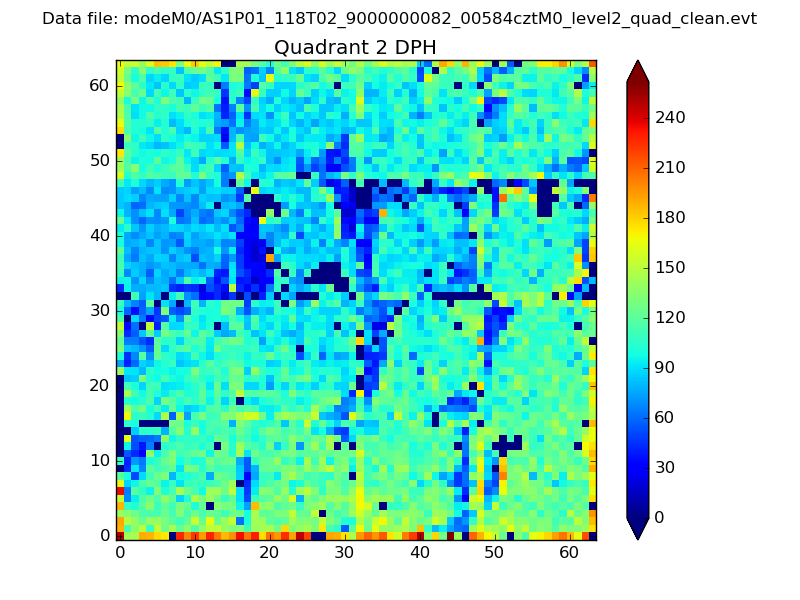 |
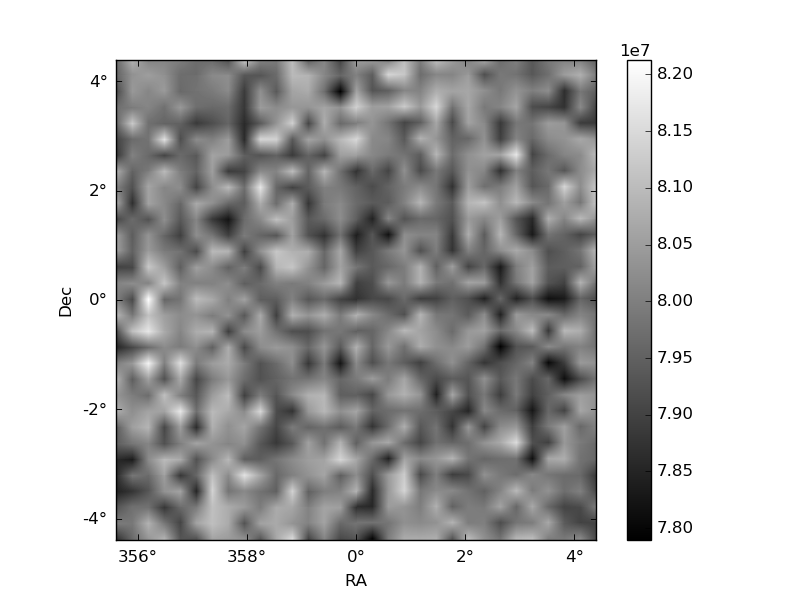
Quadrant C |
| Plot type | Count rate plots | Images |
|---|---|---|
| Comparison with Poisson distribution Blue bars denote a histogram of data divided into 1 sec bins. Red curve is a Poisson curve with rate = median count rate of data. |
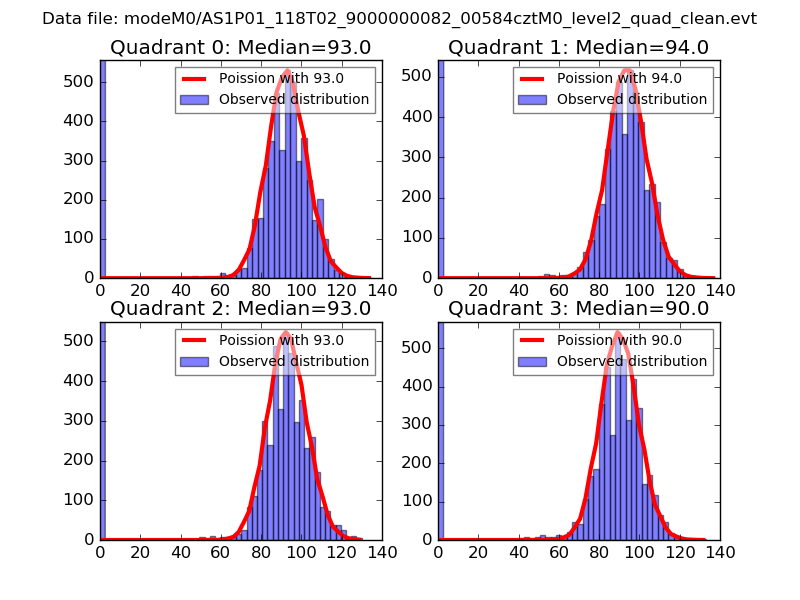 |
 |
| Quadrant-wise count rates Data is divided into 100 sec bins |
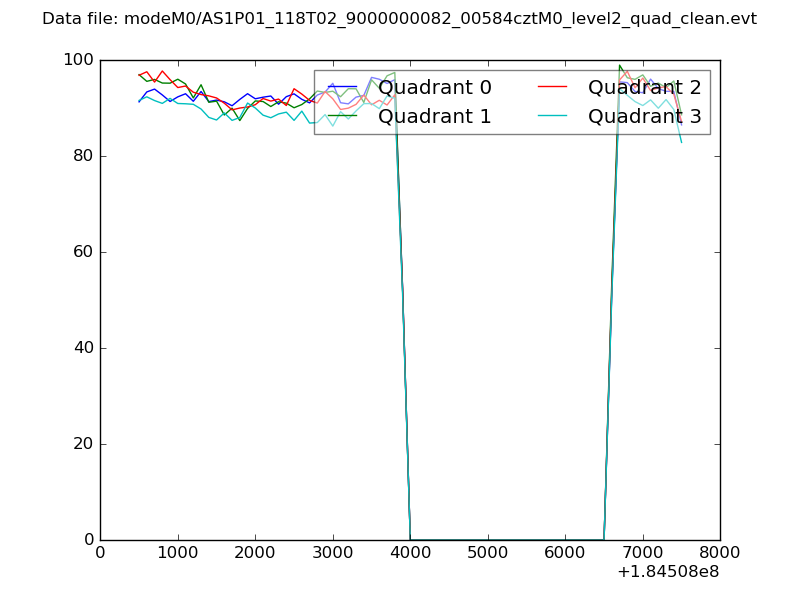 |
|
| Module-wise count rates for Quadrant A Data is divided into 100 sec bins |
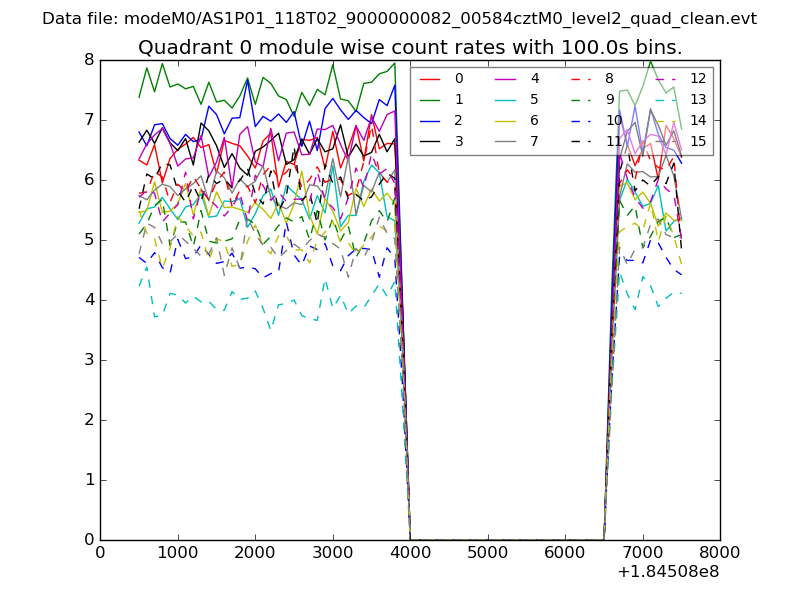 |
 |
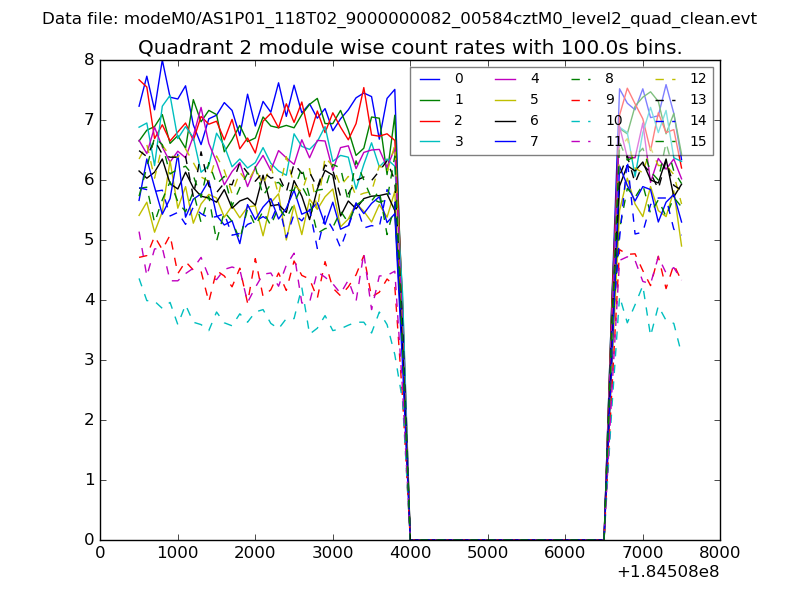
| Module-wise count rates for Quadrant B Data is divided into 100 sec bins |
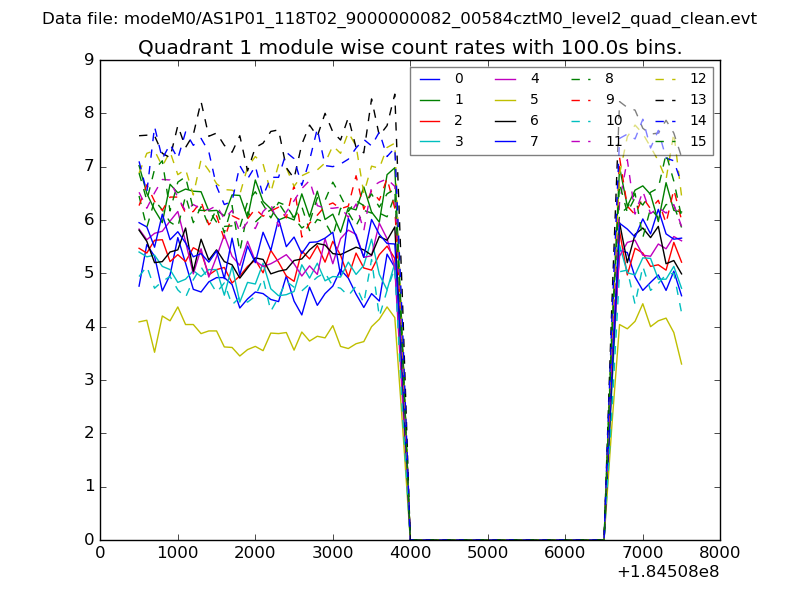 |
 |
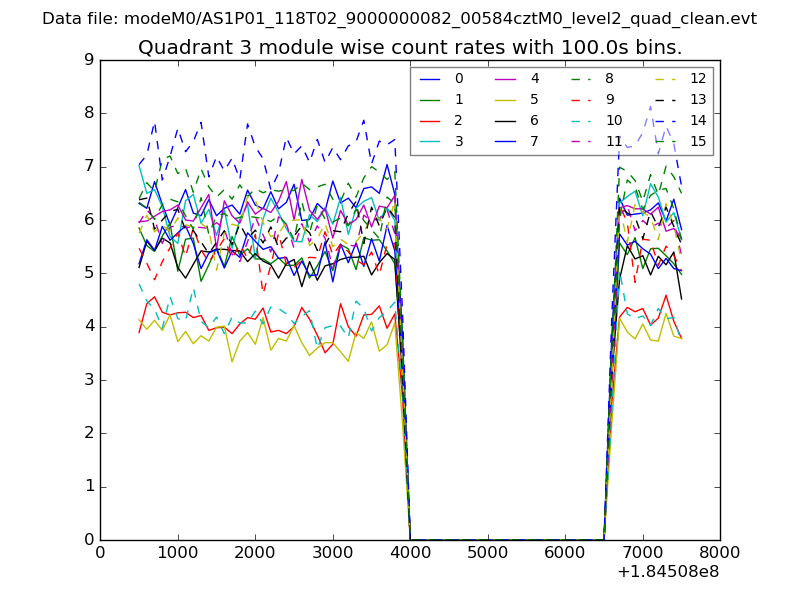
| Module-wise count rates for Quadrant C Data is divided into 100 sec bins |
 |
 |
| Module-wise count rates for Quadrant D Data is divided into 100 sec bins |
 |
 |
| Parameter | Plot |
|---|---|
| CZT HV Monitor | 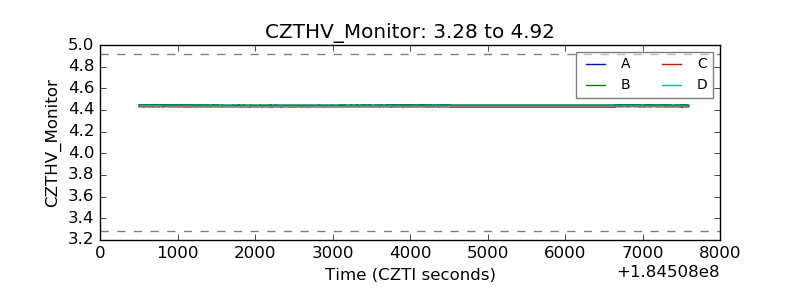 |
| D_VDD | 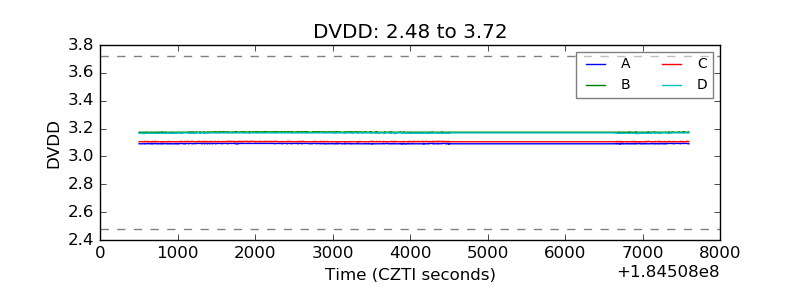 |
| Temperature 1 | 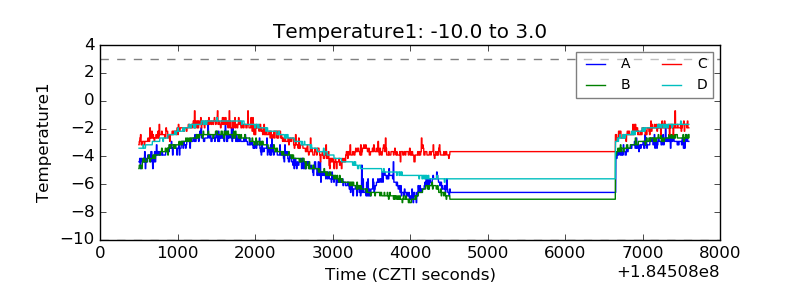 |
| Veto HV Monitor | 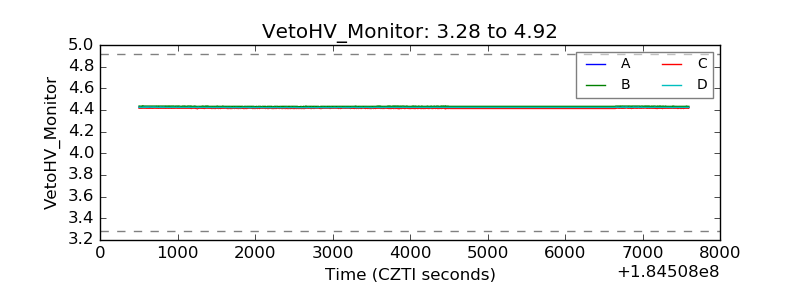 |
| Veto LLD | 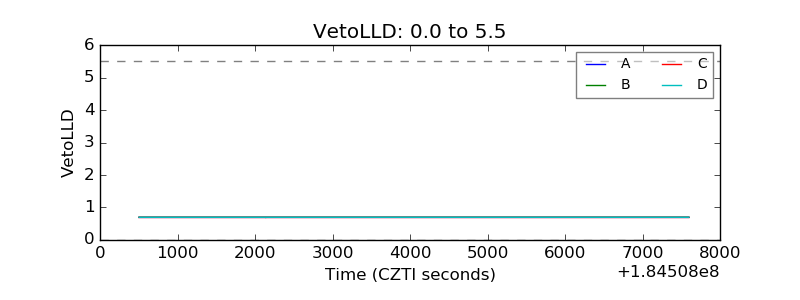 |
| Alpha Counter | 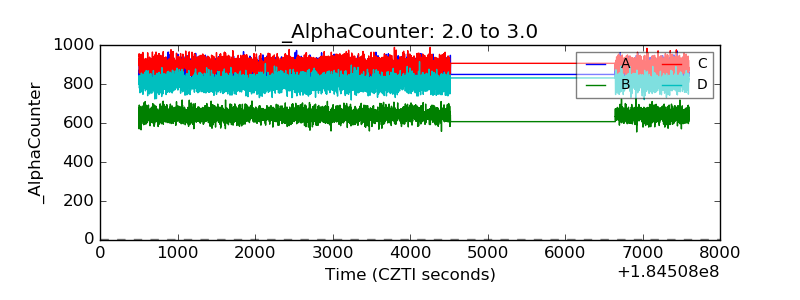 |
| _CPM_Rate | 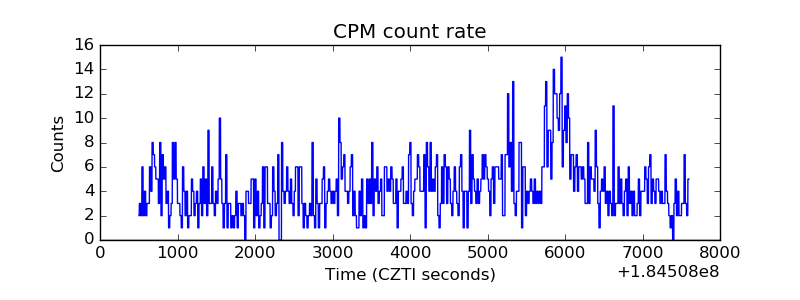 |
| CZT Counter | 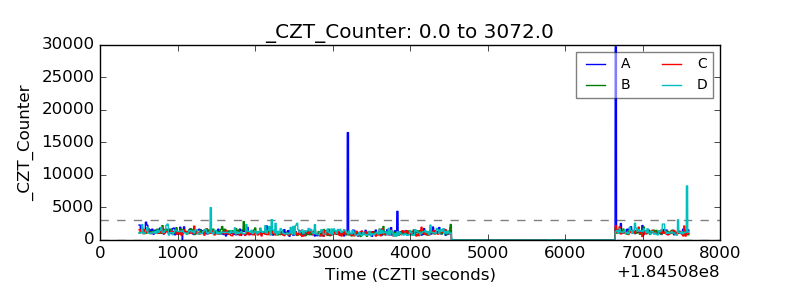 |
| +2.5 Volts monitor | 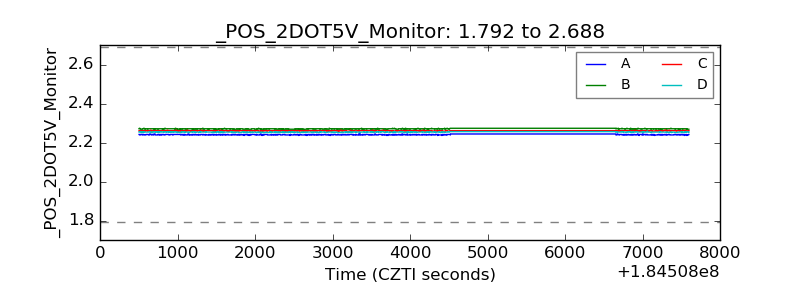 |
| +5 Volts monitor |  |
| _ROLL_ROT | 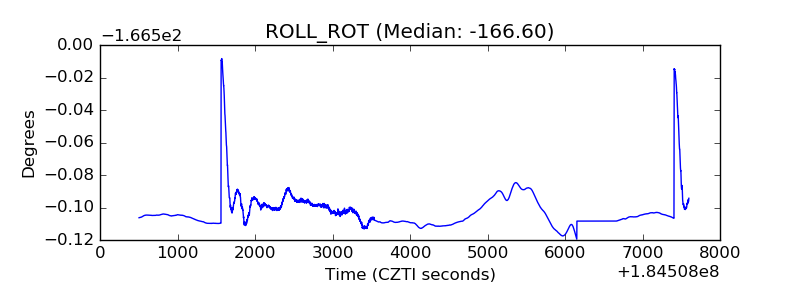 |
| _Roll_DEC | 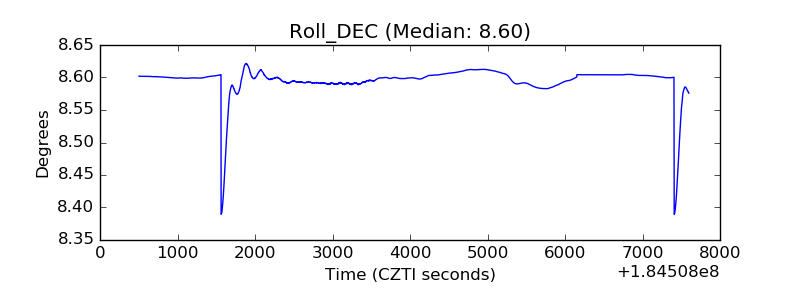 |
| _Roll_RA |  |
| Veto Counter | 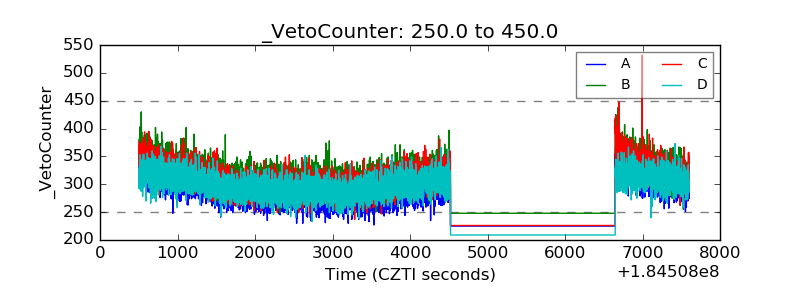 |