| Param | Original file | Final file |
|---|---|---|
| Filename | modeM0/AS1P01_118T02_9000000082_00585cztM0_level2.evt | modeM0/AS1P01_118T02_9000000082_00585cztM0_level2_quad_clean.evt |
| Size (bytes) | 803,462,400 | 61,508,160 |
| Size | 766.2 MB | 58.7 MB |
| Events in quadrant A | 6,032,184 | 380,240 |
| Events in quadrant B | 6,133,128 | 381,899 |
| Events in quadrant C | 5,415,485 | 379,954 |
| Events in quadrant D | 6,412,356 | 362,351 |
| Mode M0 | |||
|---|---|---|---|
| Quadrant | BADHDUFLAG | Total packets | Discarded packets |
| A | 0 | 21575 | 3 |
| B | 0 | 21869 | 2 |
| C | 0 | 19736 | 2 |
| D | 0 | 22740 | 2 |
| Mode SS | |||
|---|---|---|---|
| Quadrant | BADHDUFLAG | Total packets | Discarded packets |
| A | 0 | 106 | 0 |
| B | 0 | 106 | 0 |
| C | 0 | 106 | 0 |
| D | 0 | 106 | 0 |
| Mode M9 | |||
|---|---|---|---|
| Quadrant | BADHDUFLAG | Total packets | Discarded packets |
| A | 0 | 21 | 0 |
| B | 0 | 21 | 0 |
| C | 0 | 21 | 0 |
| D | 0 | 21 | 0 |
| Quadrant | Total seconds | Saturated seconds | Saturation percentage |
|---|---|---|---|
| A | 5099 | 7 | 0.137282% |
| B | 5099 | 15 | 0.294175% |
| C | 5099 | 2 | 0.039223% |
| D | 5099 | 211 | 4.138066% |
Noise dominated data is calculated using 1-second bins in cleaned event files. If a bin has >2000 counts, and if more than 50% of those come from <1% of pixels, then it is considered to be noise-dominated and hence unusable.
| Quadrant | # 1 sec bins | Bins with >0 counts | Bins with >2000 counts | High rate bins dominated by noise | Noise dominated (total time) | Noise dominated (detector-on time) | Marked lightcurve |
|---|---|---|---|---|---|---|---|
| A | 7225 | 5100 | 124 | 124 | 1.72% | 2.43% | 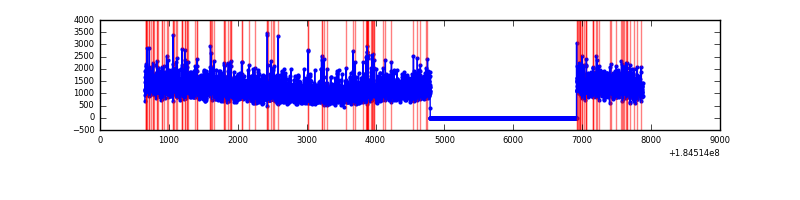 |
| B | 7225 | 5100 | 140 | 140 | 1.94% | 2.75% | 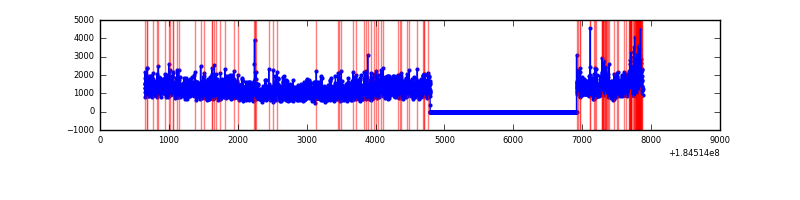 |
| C | 7225 | 5100 | 27 | 27 | 0.37% | 0.53% | 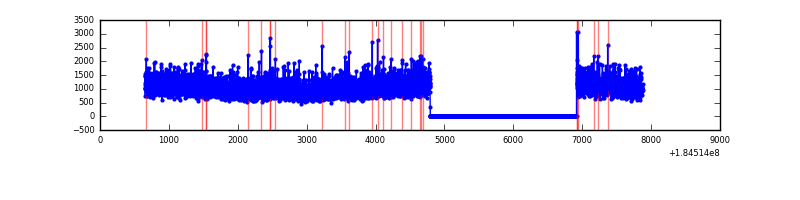 |
| D | 7225 | 5100 | 379 | 379 | 5.25% | 7.43% | 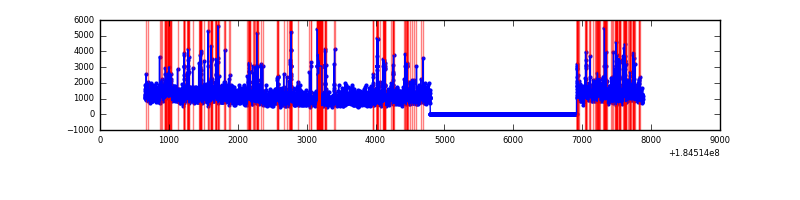 |
Top three noisy pixels from each quadrant. If the there are fewer than three noisy pixels in the level2.evt file, extra rows are filled as -1
| Pixel properties | Quadrant properties | ||||||
|---|---|---|---|---|---|---|---|
| Quadrant | DetID | PixID | Counts | Sigma | Mean | Median | Sigma |
| A | 0 | 149 | 73454 | 215.63 | 1513 | 1503 | 333.7 |
| A | 13 | 160 | 60990 | 178.27 | 1513 | 1503 | 333.7 |
| A | 0 | 238 | 35535 | 101.99 | 1513 | 1503 | 333.7 |
| B | 4 | 250 | 249262 | 700.14 | 1488 | 1500 | 353.9 |
| B | 4 | 206 | 68694 | 189.88 | 1488 | 1500 | 353.9 |
| B | 7 | 221 | 46344 | 126.72 | 1488 | 1500 | 353.9 |
| C | 15 | 241 | 36344 | 91.97 | 1357 | 1407 | 379.9 |
| C | 0 | 64 | 15910 | 38.18 | 1357 | 1407 | 379.9 |
| C | 10 | 17 | 15135 | 36.14 | 1357 | 1407 | 379.9 |
| D | 1 | 4 | 209219 | 452.34 | 1385 | 1392 | 459.4 |
| D | 13 | 221 | 172307 | 372.0 | 1385 | 1392 | 459.4 |
| D | 13 | 216 | 90160 | 193.21 | 1385 | 1392 | 459.4 |
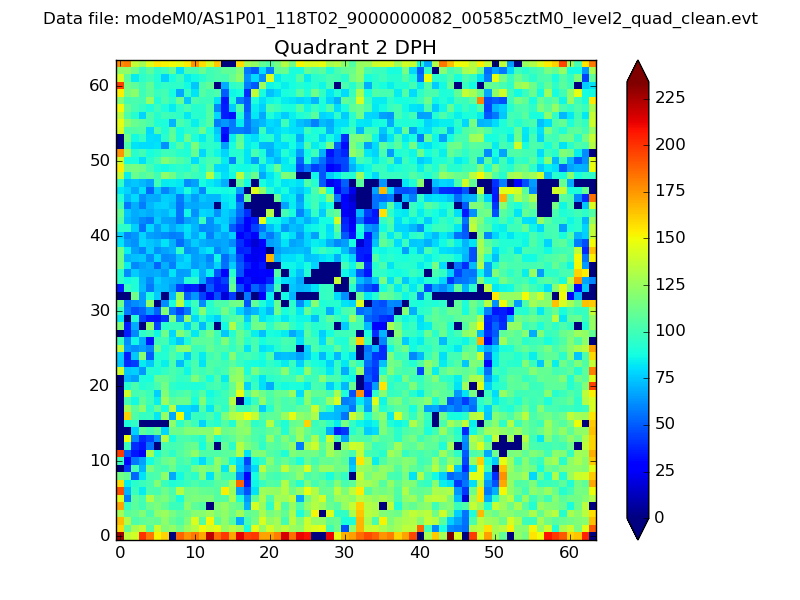
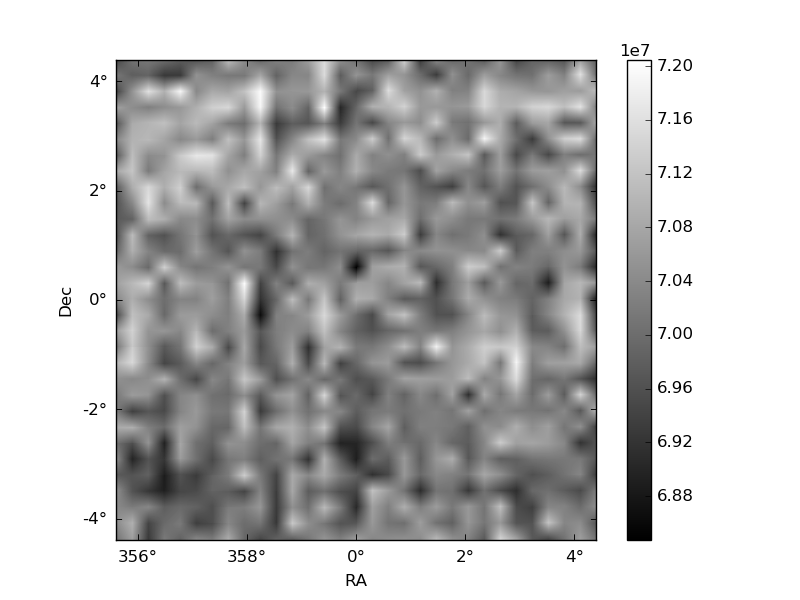
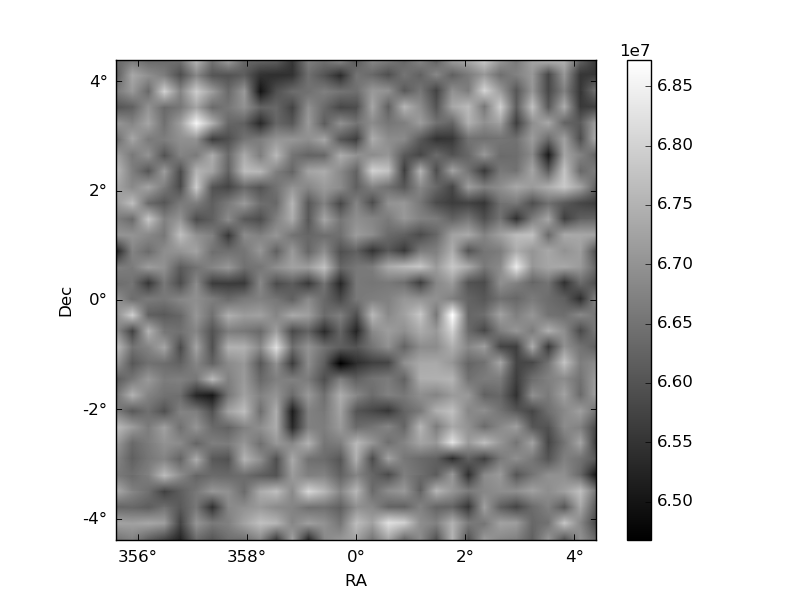
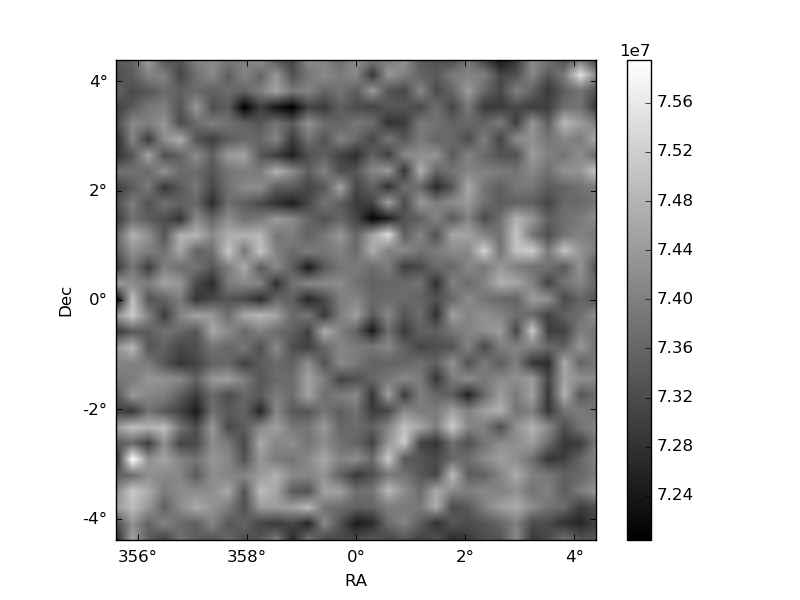
Histogram calculated using DETX and DETY for each event in the final _common_clean file
| Quadrant A | 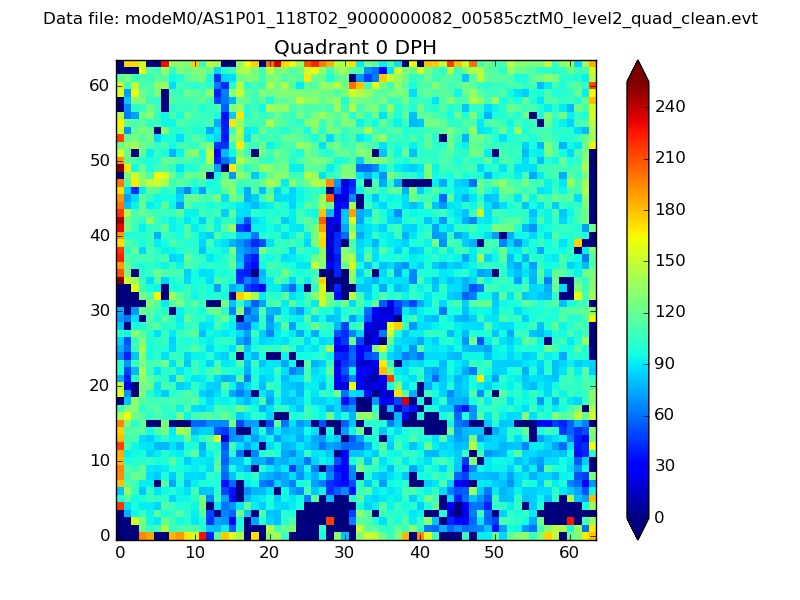 |
 |
Quadrant B |
|---|---|---|---|
| Quadrant D |  |
 |
Quadrant C |
| Plot type | Count rate plots | Images |
|---|---|---|
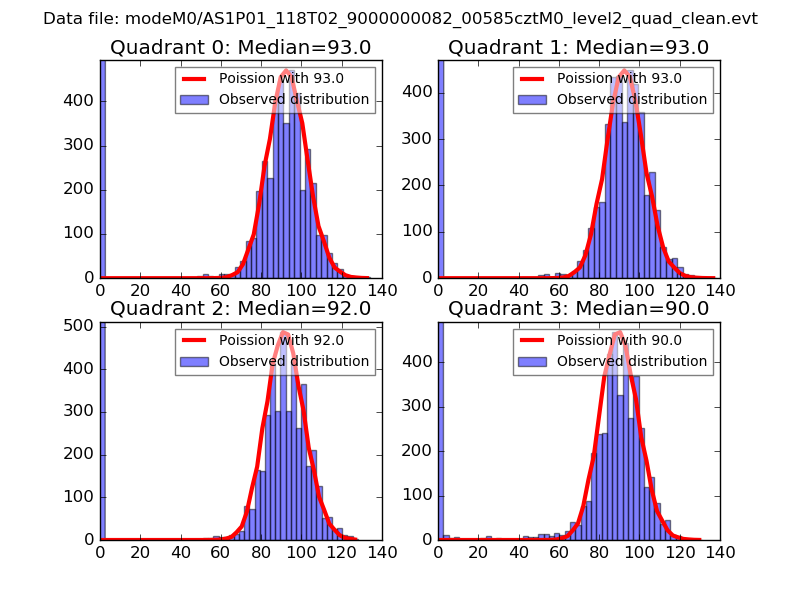
| Comparison with Poisson distribution Blue bars denote a histogram of data divided into 1 sec bins. Red curve is a Poisson curve with rate = median count rate of data. |
 |
 |
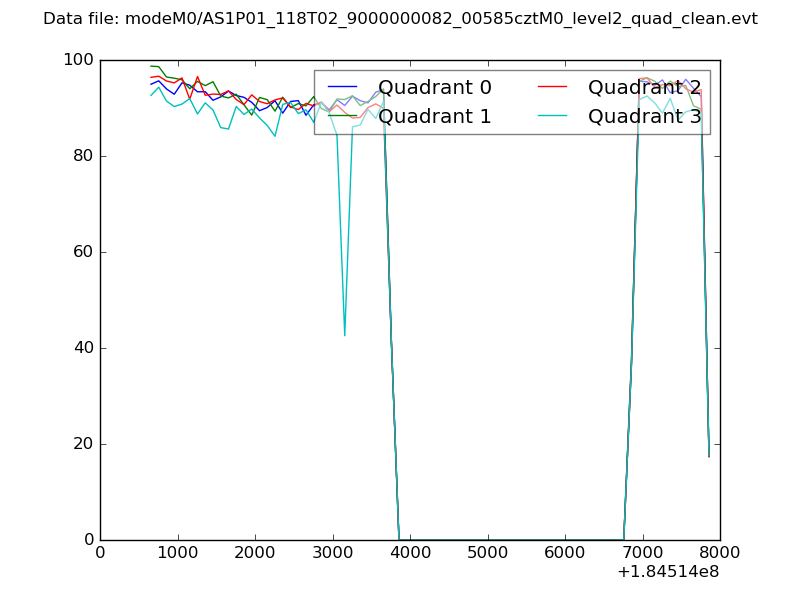
| Quadrant-wise count rates Data is divided into 100 sec bins |
 |
|
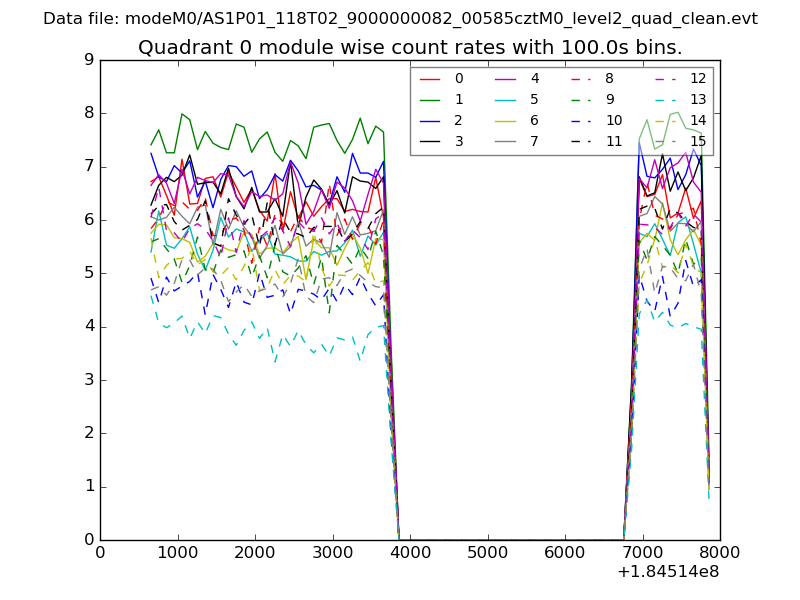
| Module-wise count rates for Quadrant A Data is divided into 100 sec bins |
 |
 |
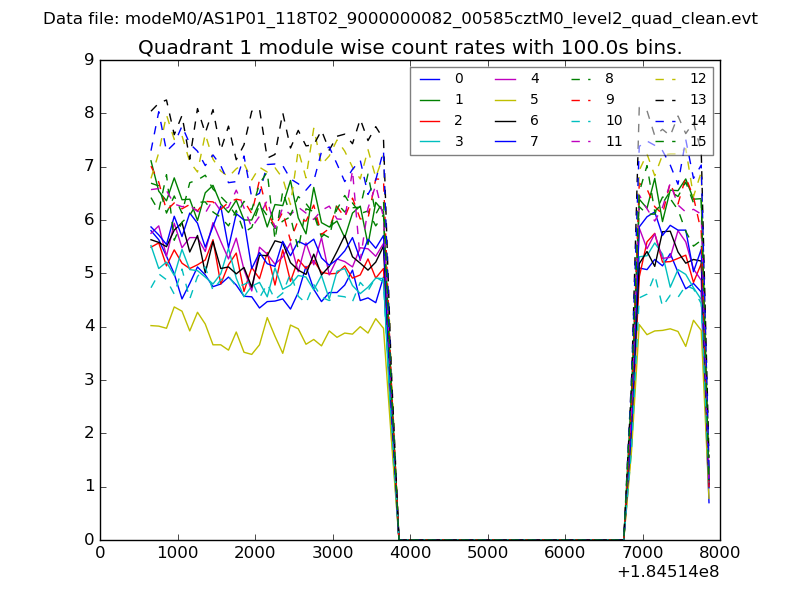
| Module-wise count rates for Quadrant B Data is divided into 100 sec bins |
 |
 |
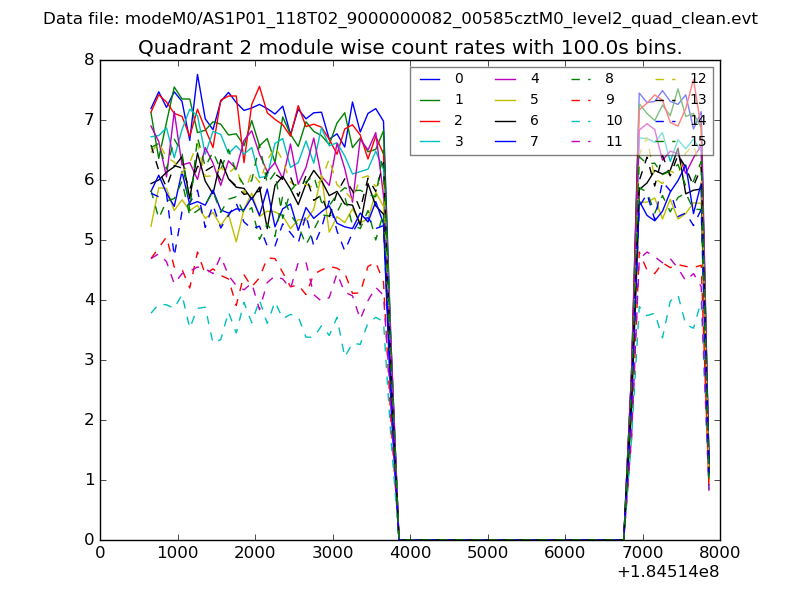
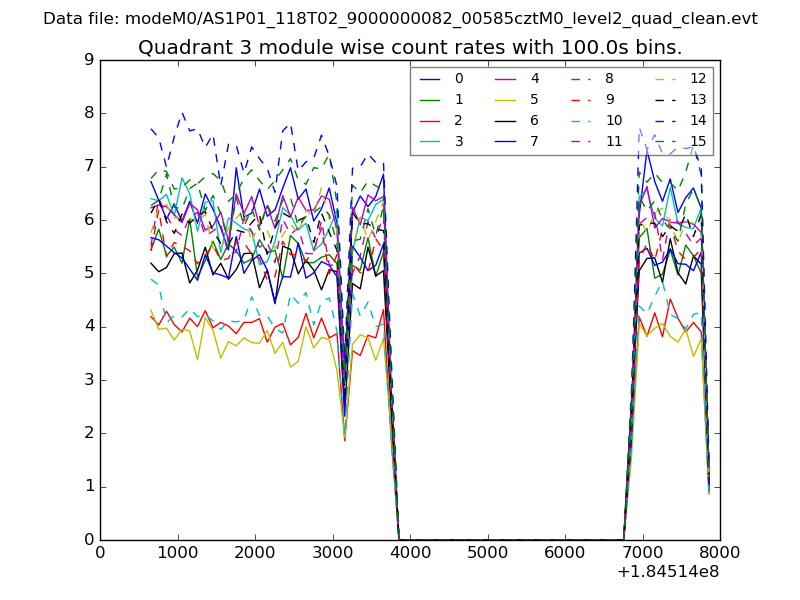
| Module-wise count rates for Quadrant C Data is divided into 100 sec bins |
 |
 |
| Module-wise count rates for Quadrant D Data is divided into 100 sec bins |
 |
 |
| Parameter | Plot |
|---|---|
| CZT HV Monitor | 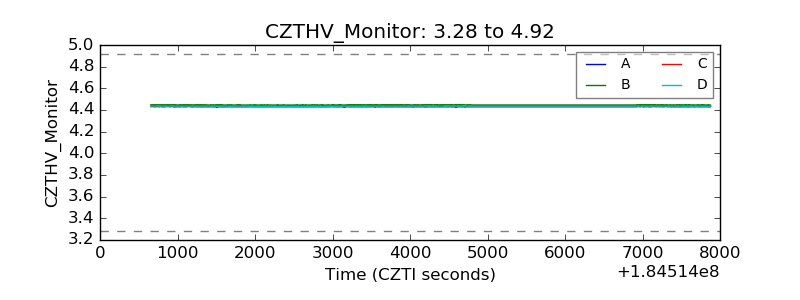 |
| D_VDD | 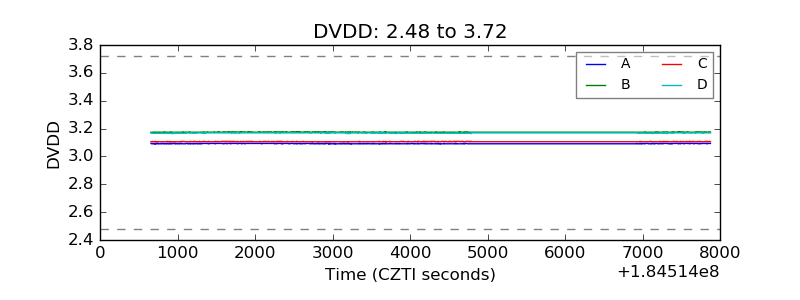 |
| Temperature 1 | 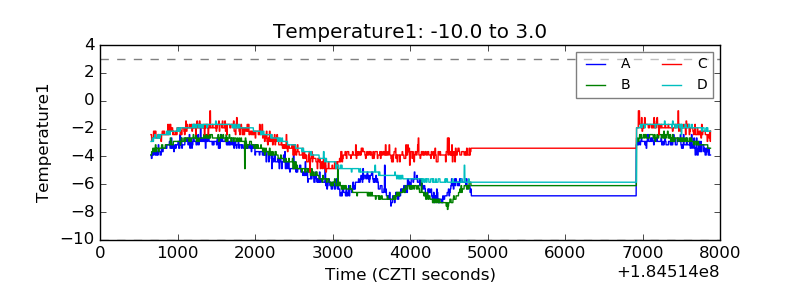 |
| Veto HV Monitor | 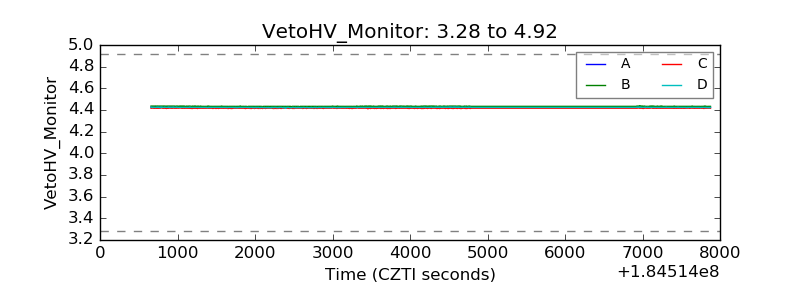 |
| Veto LLD | 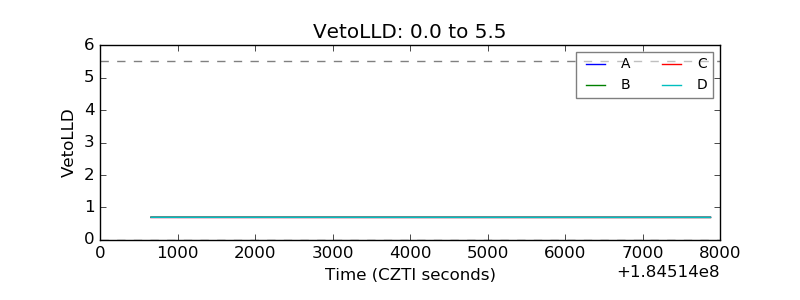 |
| Alpha Counter | 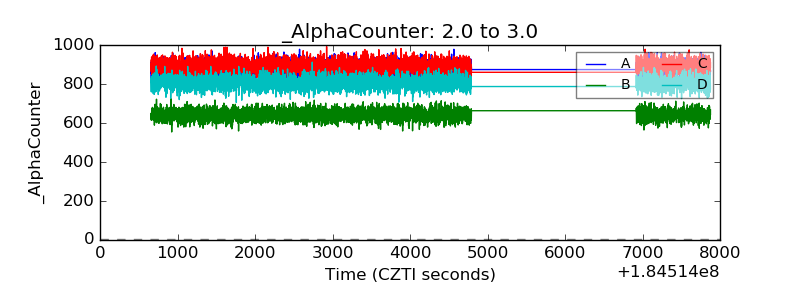 |
| _CPM_Rate |  |
| CZT Counter | 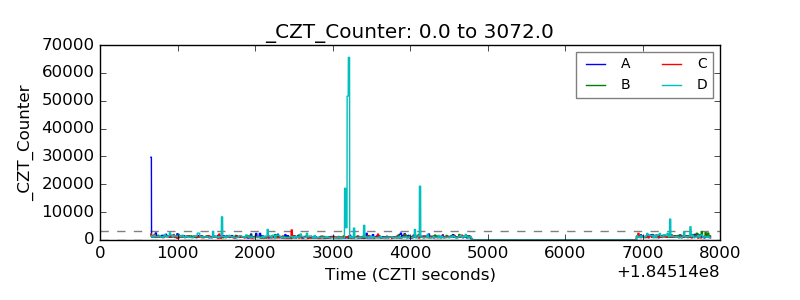 |
| +2.5 Volts monitor |  |
| +5 Volts monitor | 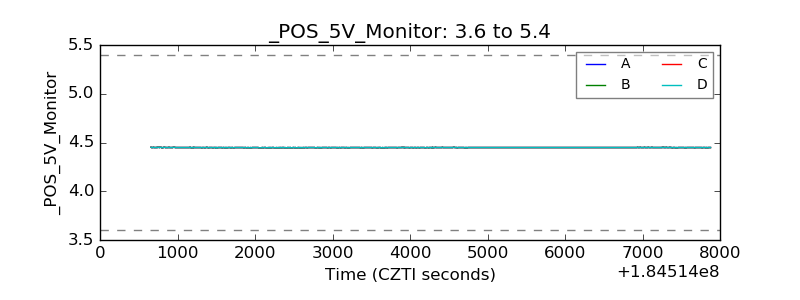 |
| _ROLL_ROT | 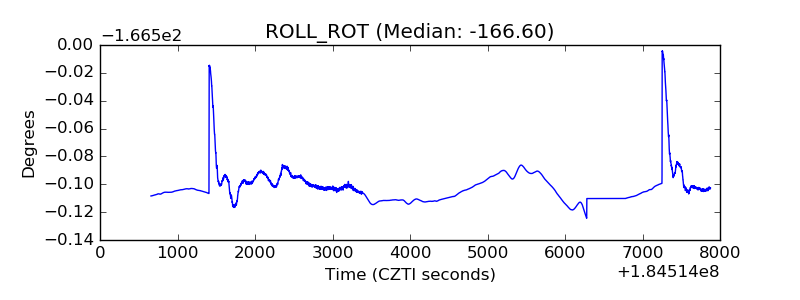 |
| _Roll_DEC | 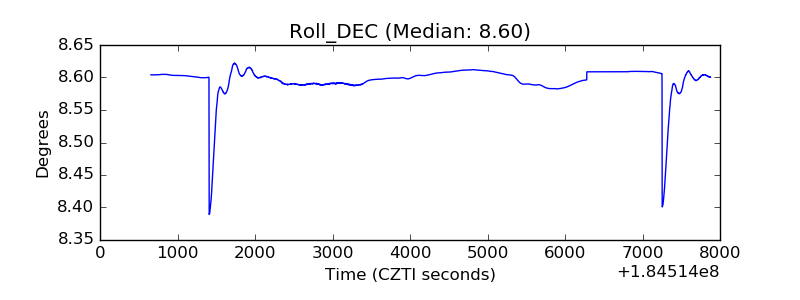 |
| _Roll_RA |  |
| Veto Counter | 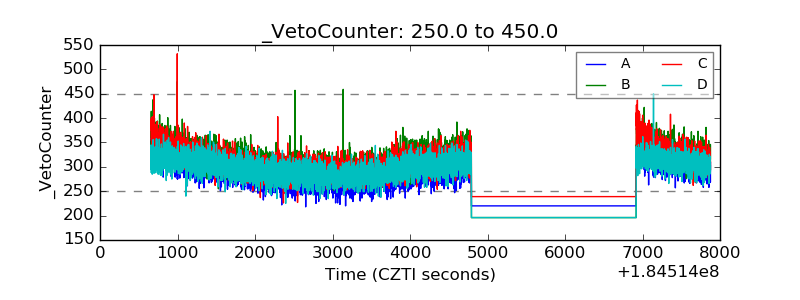 |