| Param | Original file | Final file |
|---|---|---|
| Filename | modeM0/AS1P01_118T02_9000000082_00587cztM0_level2.evt | modeM0/AS1P01_118T02_9000000082_00587cztM0_level2_quad_clean.evt |
| Size (bytes) | 819,665,280 | 53,841,600 |
| Size | 781.7 MB | 51.3 MB |
| Events in quadrant A | 5,935,353 | 321,137 |
| Events in quadrant B | 6,154,311 | 322,742 |
| Events in quadrant C | 5,562,154 | 320,966 |
| Events in quadrant D | 6,825,308 | 300,417 |
| Mode M0 | |||
|---|---|---|---|
| Quadrant | BADHDUFLAG | Total packets | Discarded packets |
| A | 0 | 21760 | 407 |
| B | 0 | 22335 | 375 |
| C | 0 | 20604 | 370 |
| D | 0 | 24402 | 361 |
| Mode SS | |||
|---|---|---|---|
| Quadrant | BADHDUFLAG | Total packets | Discarded packets |
| A | 0 | 106 | 2 |
| B | 0 | 106 | 2 |
| C | 0 | 106 | 2 |
| D | 0 | 106 | 2 |
| Mode M9 | |||
|---|---|---|---|
| Quadrant | BADHDUFLAG | Total packets | Discarded packets |
| A | 0 | 24 | 0 |
| B | 0 | 24 | 0 |
| C | 0 | 24 | 0 |
| D | 0 | 25 | 0 |
| Quadrant | Total seconds | Saturated seconds | Saturation percentage |
|---|---|---|---|
| A | 5209 | 4 | 0.076790% |
| B | 5216 | 6 | 0.115031% |
| C | 5207 | 4 | 0.076820% |
| D | 5211 | 316 | 6.064095% |
Noise dominated data is calculated using 1-second bins in cleaned event files. If a bin has >2000 counts, and if more than 50% of those come from <1% of pixels, then it is considered to be noise-dominated and hence unusable.
| Quadrant | # 1 sec bins | Bins with >0 counts | Bins with >2000 counts | High rate bins dominated by noise | Noise dominated (total time) | Noise dominated (detector-on time) | Marked lightcurve |
|---|---|---|---|---|---|---|---|
| A | 7420 | 5222 | 109 | 109 | 1.47% | 2.09% | 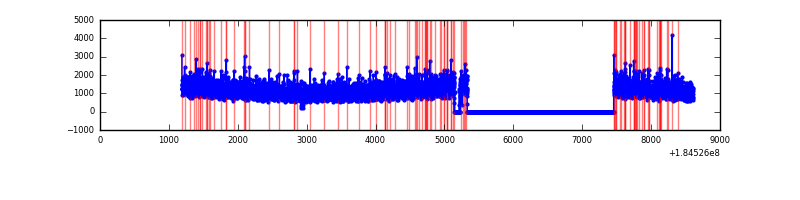 |
| B | 7420 | 5227 | 104 | 104 | 1.40% | 1.99% | 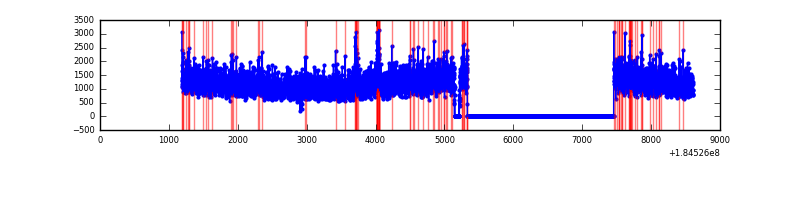 |
| C | 7420 | 5222 | 45 | 45 | 0.61% | 0.86% | 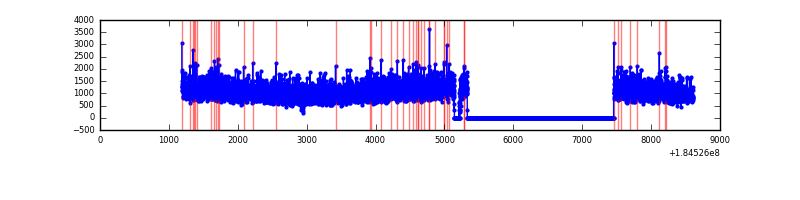 |
| D | 7420 | 5224 | 578 | 578 | 7.79% | 11.06% | 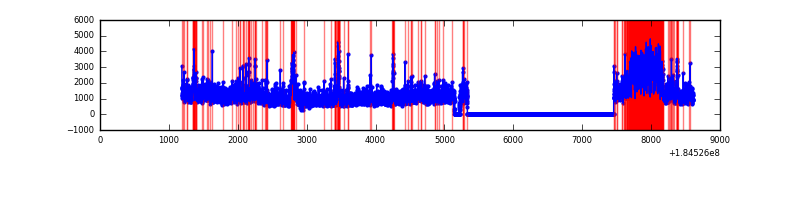 |
Top three noisy pixels from each quadrant. If the there are fewer than three noisy pixels in the level2.evt file, extra rows are filled as -1
| Pixel properties | Quadrant properties | ||||||
|---|---|---|---|---|---|---|---|
| Quadrant | DetID | PixID | Counts | Sigma | Mean | Median | Sigma |
| A | 13 | 160 | 28291 | 80.13 | 1504 | 1490 | 334.5 |
| A | 15 | 17 | 26540 | 74.89 | 1504 | 1490 | 334.5 |
| A | 12 | 133 | 22528 | 62.9 | 1504 | 1490 | 334.5 |
| B | 4 | 250 | 206543 | 579.81 | 1520 | 1531 | 353.6 |
| B | 4 | 206 | 72533 | 200.8 | 1520 | 1531 | 353.6 |
| B | 5 | 249 | 19967 | 52.14 | 1520 | 1531 | 353.6 |
| C | 3 | 159 | 37684 | 92.32 | 1399 | 1450 | 392.5 |
| C | 15 | 241 | 10638 | 23.41 | 1399 | 1450 | 392.5 |
| C | 5 | 249 | 7789 | 16.15 | 1399 | 1450 | 392.5 |
| D | 1 | 4 | 923375 | 2249.26 | 1312 | 1367 | 409.9 |
| D | 13 | 216 | 193815 | 469.48 | 1312 | 1367 | 409.9 |
| D | 13 | 221 | 190719 | 461.93 | 1312 | 1367 | 409.9 |
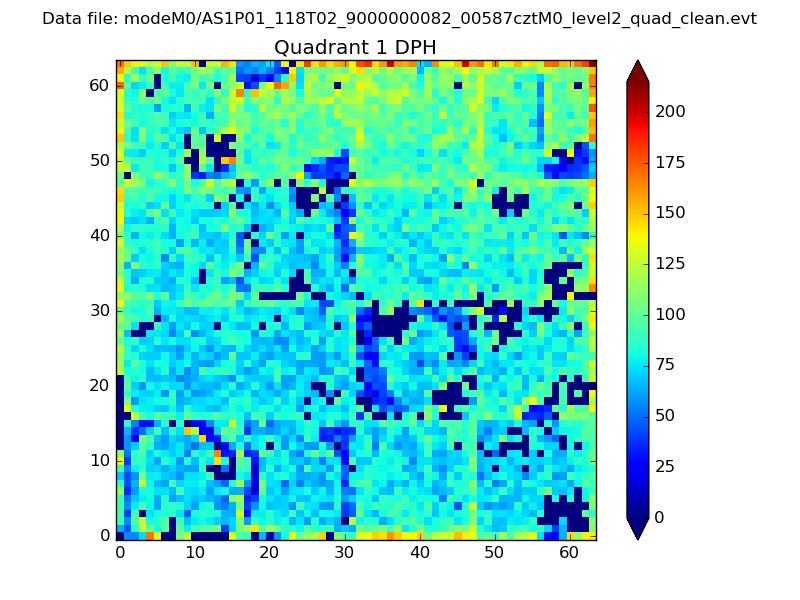
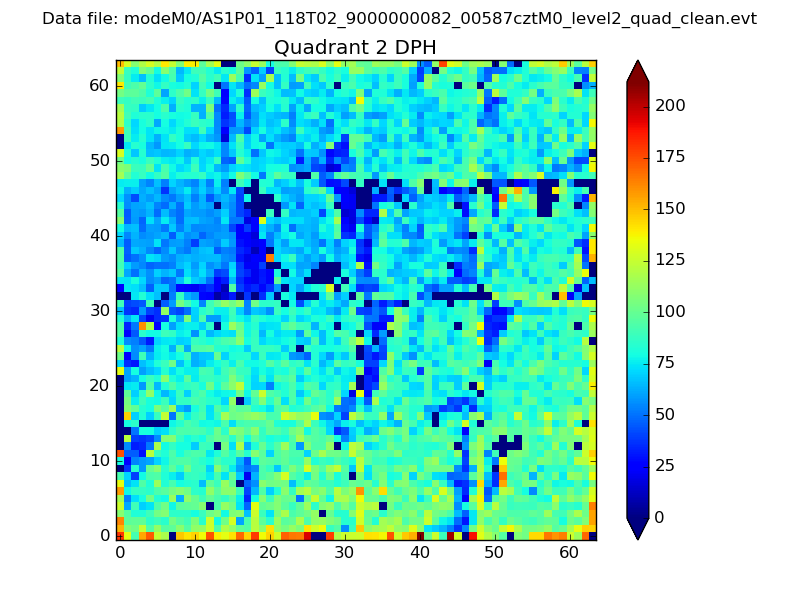
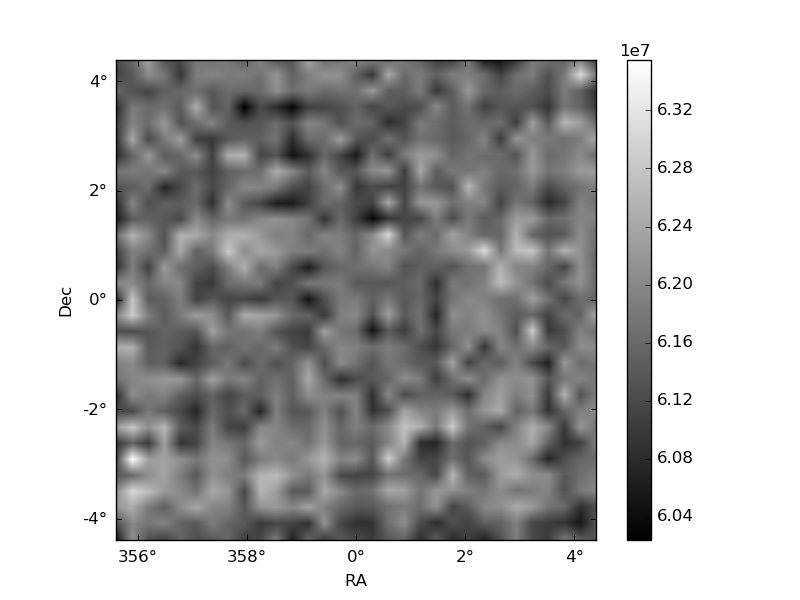
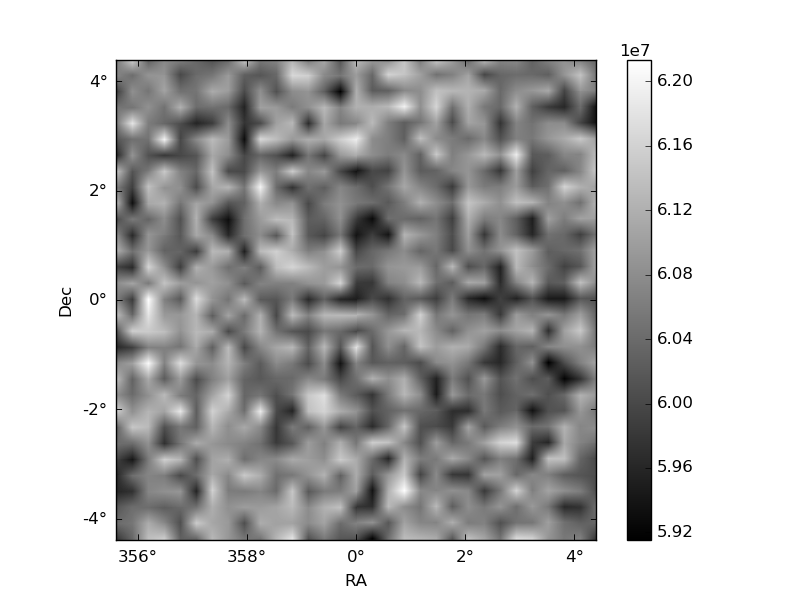
Histogram calculated using DETX and DETY for each event in the final _common_clean file
| Quadrant A |  |
 |
Quadrant B |
|---|---|---|---|
| Quadrant D | 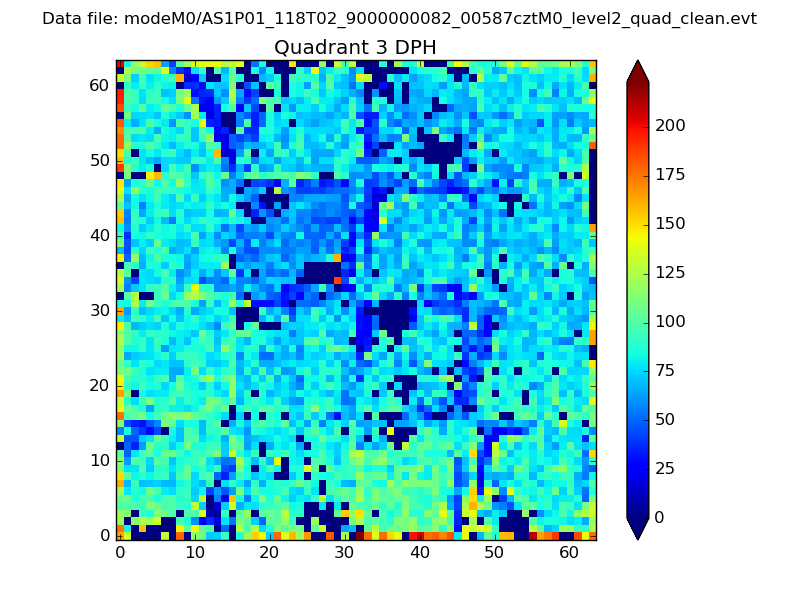 |
 |
Quadrant C |
| Plot type | Count rate plots | Images |
|---|---|---|
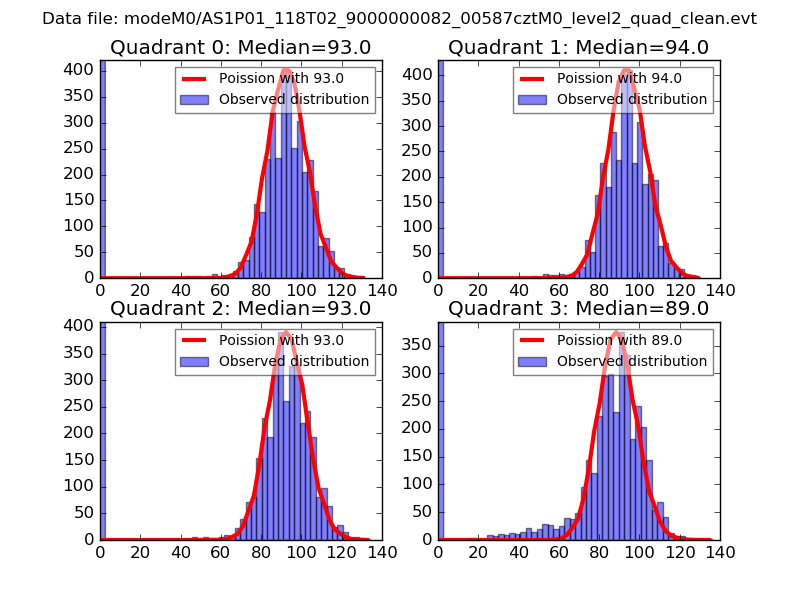
| Comparison with Poisson distribution Blue bars denote a histogram of data divided into 1 sec bins. Red curve is a Poisson curve with rate = median count rate of data. |
 |
 |
| Quadrant-wise count rates Data is divided into 100 sec bins |
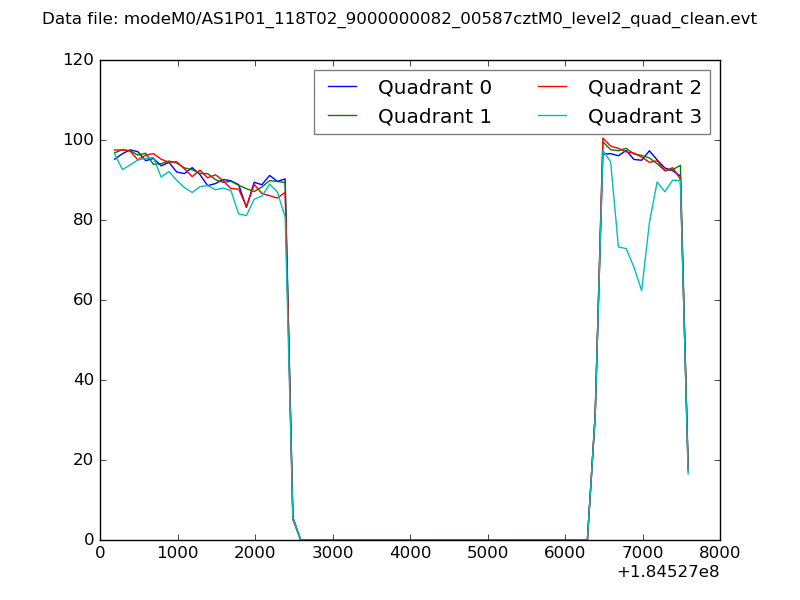 |
|
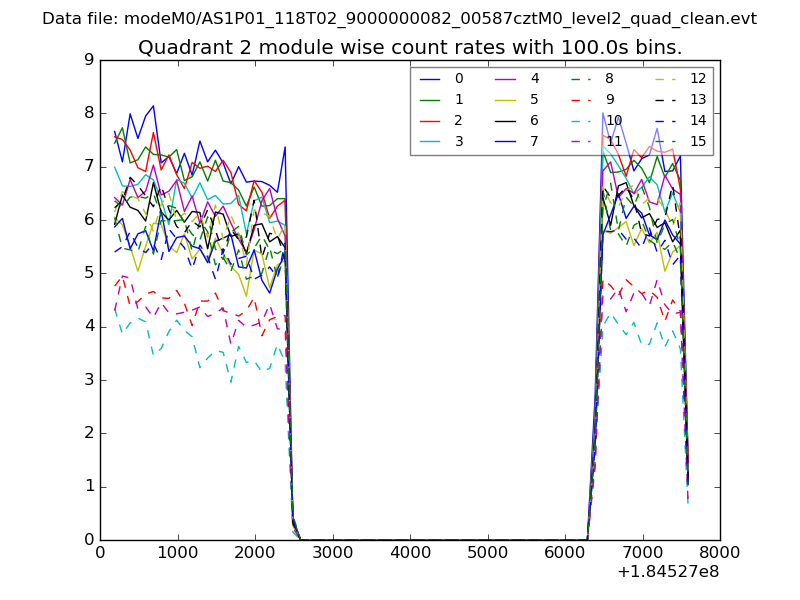
| Module-wise count rates for Quadrant A Data is divided into 100 sec bins |
 |
 |
| Module-wise count rates for Quadrant B Data is divided into 100 sec bins |
 |
 |
| Module-wise count rates for Quadrant C Data is divided into 100 sec bins |
 |
 |
| Module-wise count rates for Quadrant D Data is divided into 100 sec bins |
 |
 |
| Parameter | Plot |
|---|---|
| CZT HV Monitor | 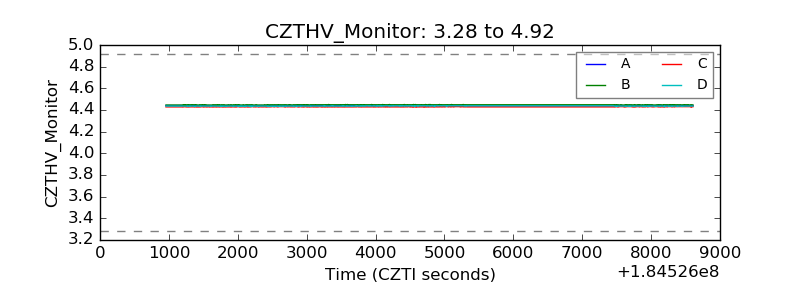 |
| D_VDD | 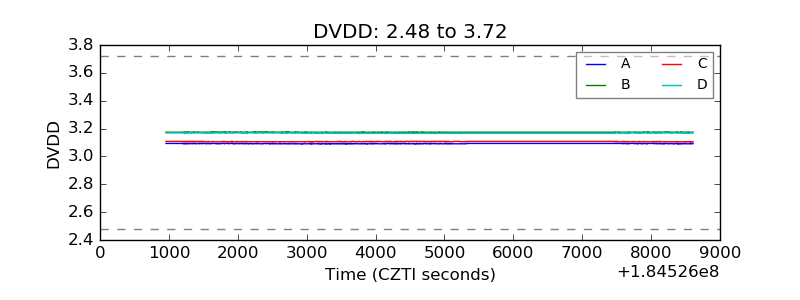 |
| Temperature 1 | 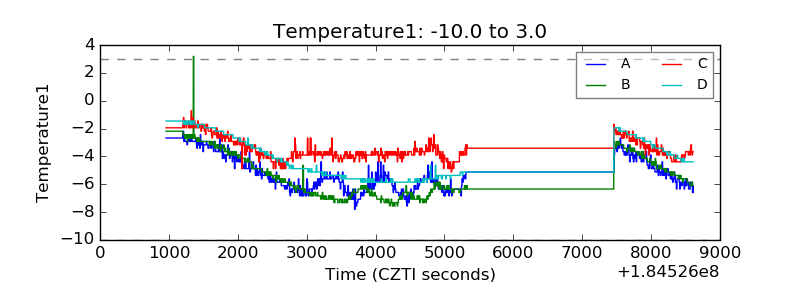 |
| Veto HV Monitor | 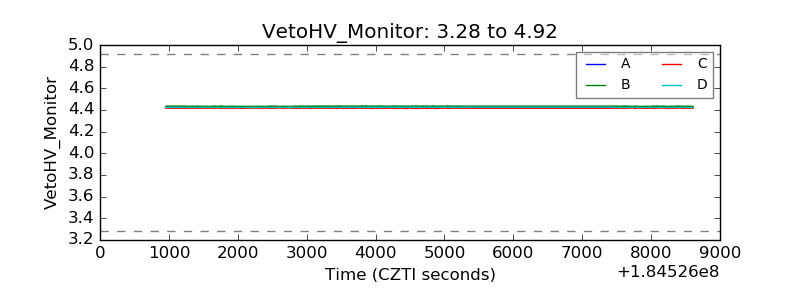 |
| Veto LLD | 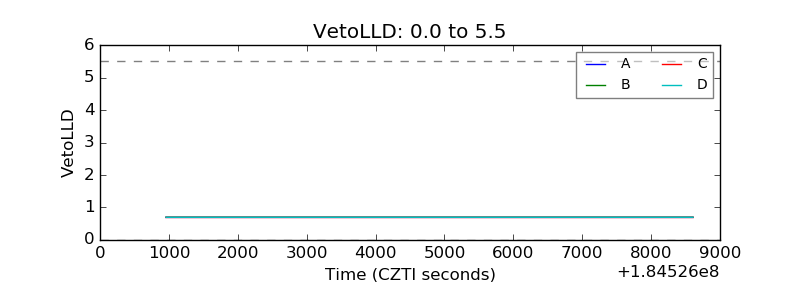 |
| Alpha Counter | 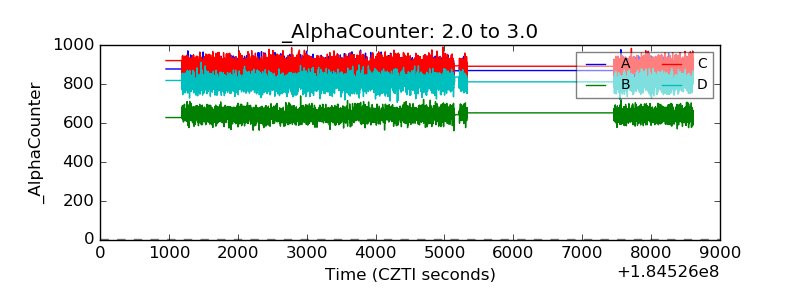 |
| _CPM_Rate | 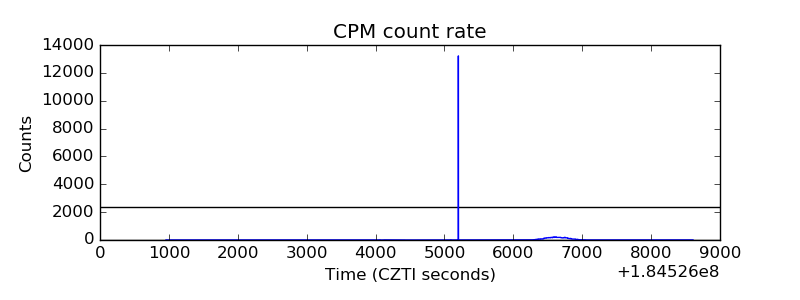 |
| CZT Counter | 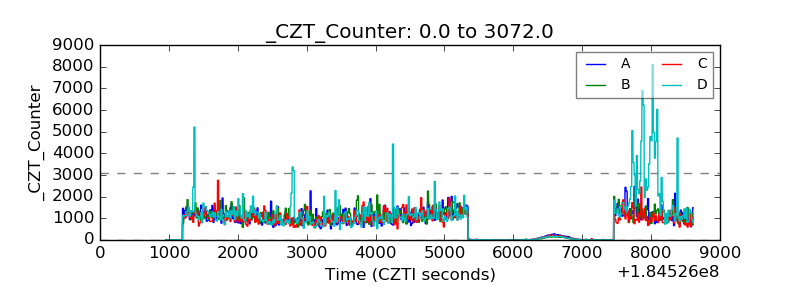 |
| +2.5 Volts monitor |  |
| +5 Volts monitor |  |
| _ROLL_ROT |  |
| _Roll_DEC | 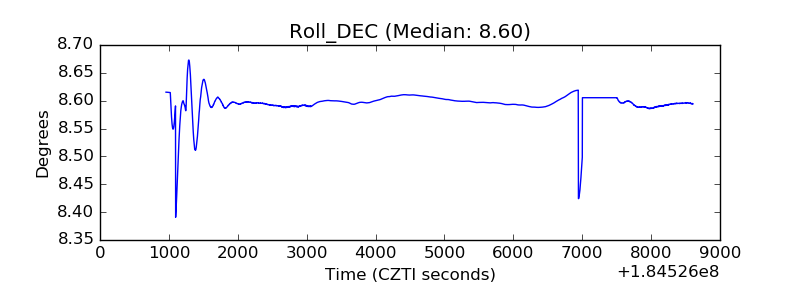 |
| _Roll_RA | 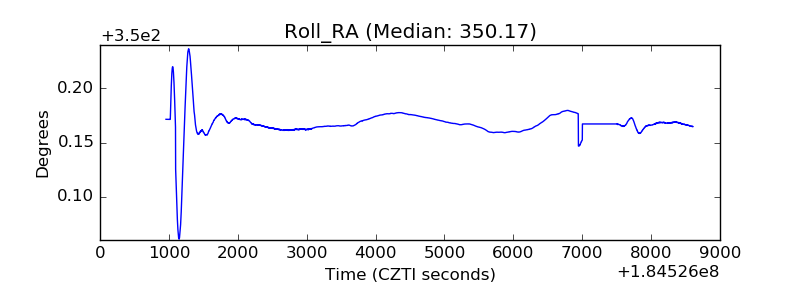 |
| Veto Counter | 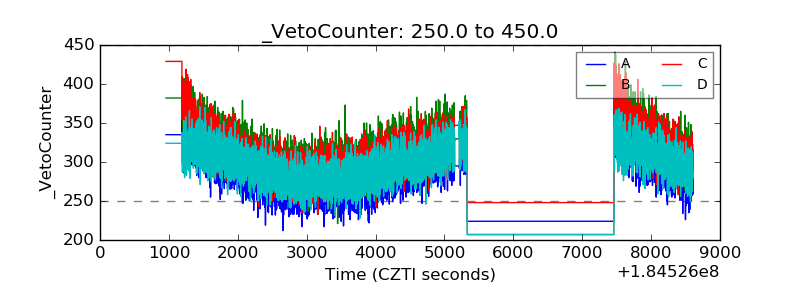 |