| Param | Original file | Final file |
|---|---|---|
| Filename | modeM0/AS1P01_118T02_9000000082_00588cztM0_level2.evt | modeM0/AS1P01_118T02_9000000082_00588cztM0_level2_quad_clean.evt |
| Size (bytes) | 796,262,400 | 44,821,440 |
| Size | 759.4 MB | 42.7 MB |
| Events in quadrant A | 5,765,744 | 256,463 |
| Events in quadrant B | 5,885,976 | 259,407 |
| Events in quadrant C | 5,334,513 | 255,383 |
| Events in quadrant D | 6,796,208 | 235,003 |
| Mode M0 | |||
|---|---|---|---|
| Quadrant | BADHDUFLAG | Total packets | Discarded packets |
| A | 0 | 20671 | 3 |
| B | 0 | 21035 | 2 |
| C | 0 | 19422 | 2 |
| D | 0 | 23779 | 2 |
| Mode SS | |||
|---|---|---|---|
| Quadrant | BADHDUFLAG | Total packets | Discarded packets |
| A | 0 | 102 | 0 |
| B | 0 | 102 | 0 |
| C | 0 | 102 | 0 |
| D | 0 | 102 | 0 |
| Mode M9 | |||
|---|---|---|---|
| Quadrant | BADHDUFLAG | Total packets | Discarded packets |
| A | 0 | 21 | 0 |
| B | 0 | 21 | 0 |
| C | 0 | 21 | 0 |
| D | 0 | 21 | 0 |
| Quadrant | Total seconds | Saturated seconds | Saturation percentage |
|---|---|---|---|
| A | 4995 | 8 | 0.160160% |
| B | 4995 | 7 | 0.140140% |
| C | 4995 | 5 | 0.100100% |
| D | 4995 | 312 | 6.246246% |
Noise dominated data is calculated using 1-second bins in cleaned event files. If a bin has >2000 counts, and if more than 50% of those come from <1% of pixels, then it is considered to be noise-dominated and hence unusable.
| Quadrant | # 1 sec bins | Bins with >0 counts | Bins with >2000 counts | High rate bins dominated by noise | Noise dominated (total time) | Noise dominated (detector-on time) | Marked lightcurve |
|---|---|---|---|---|---|---|---|
| A | 7121 | 4996 | 123 | 123 | 1.73% | 2.46% | 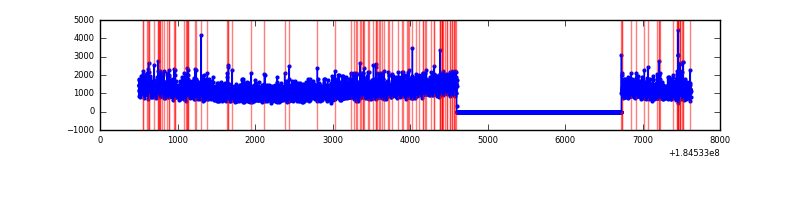 |
| B | 7121 | 4996 | 90 | 90 | 1.26% | 1.80% | 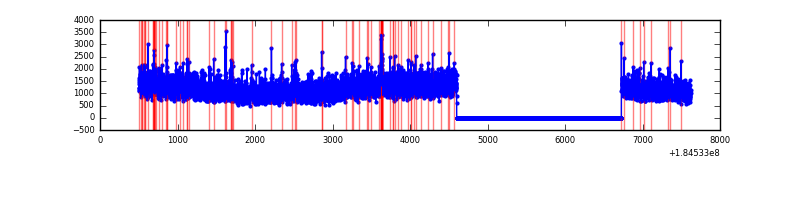 |
| C | 7121 | 4996 | 51 | 51 | 0.72% | 1.02% | 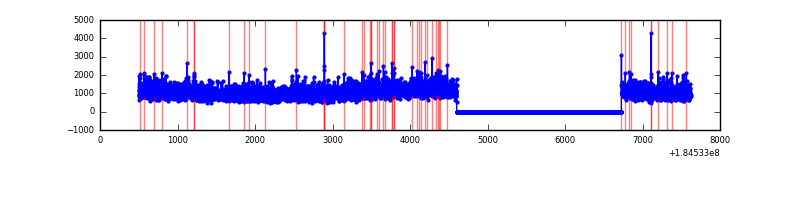 |
| D | 7121 | 4996 | 676 | 676 | 9.49% | 13.53% | 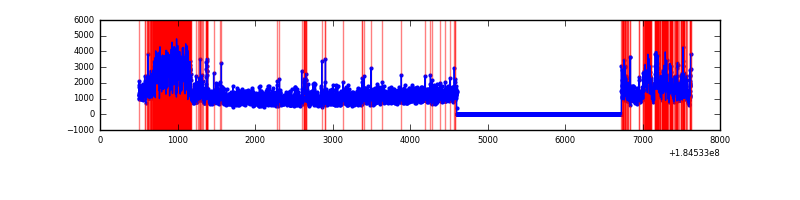 |
Top three noisy pixels from each quadrant. If the there are fewer than three noisy pixels in the level2.evt file, extra rows are filled as -1
| Pixel properties | Quadrant properties | ||||||
|---|---|---|---|---|---|---|---|
| Quadrant | DetID | PixID | Counts | Sigma | Mean | Median | Sigma |
| A | 13 | 160 | 44275 | 134.1 | 1449 | 1433 | 319.5 |
| A | 0 | 69 | 36219 | 108.88 | 1449 | 1433 | 319.5 |
| A | 12 | 133 | 27905 | 82.86 | 1449 | 1433 | 319.5 |
| B | 4 | 250 | 152520 | 439.88 | 1467 | 1477 | 343.4 |
| B | 4 | 206 | 49373 | 139.48 | 1467 | 1477 | 343.4 |
| B | 5 | 249 | 34526 | 96.25 | 1467 | 1477 | 343.4 |
| C | 3 | 159 | 29511 | 74.8 | 1342 | 1395 | 375.9 |
| C | 10 | 49 | 11493 | 26.87 | 1342 | 1395 | 375.9 |
| C | 15 | 241 | 10529 | 24.3 | 1342 | 1395 | 375.9 |
| D | 1 | 4 | 1189480 | 2991.76 | 1263 | 1320 | 397.1 |
| D | 13 | 216 | 329657 | 826.74 | 1263 | 1320 | 397.1 |
| D | 13 | 221 | 149956 | 374.26 | 1263 | 1320 | 397.1 |
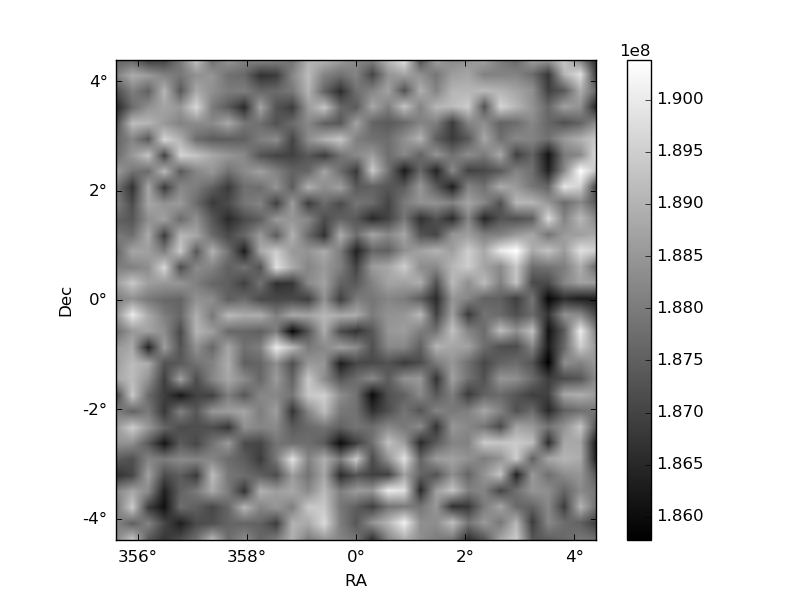
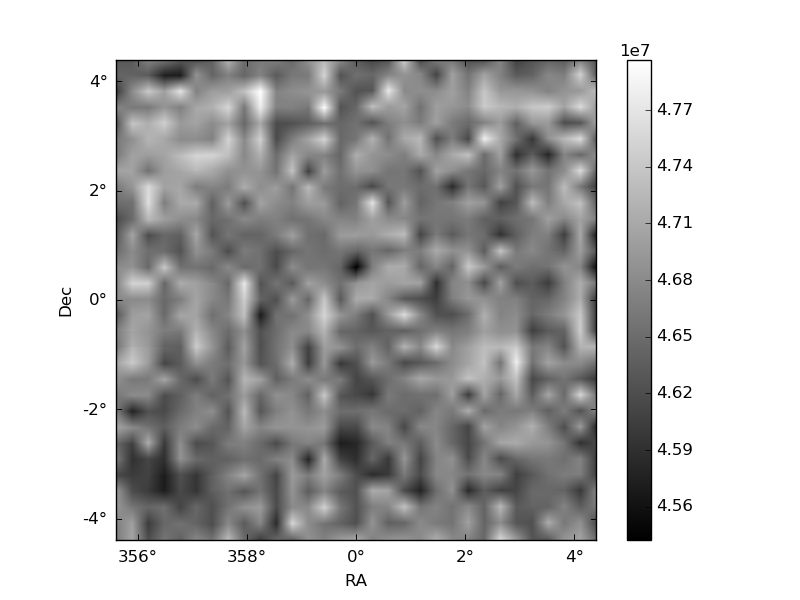
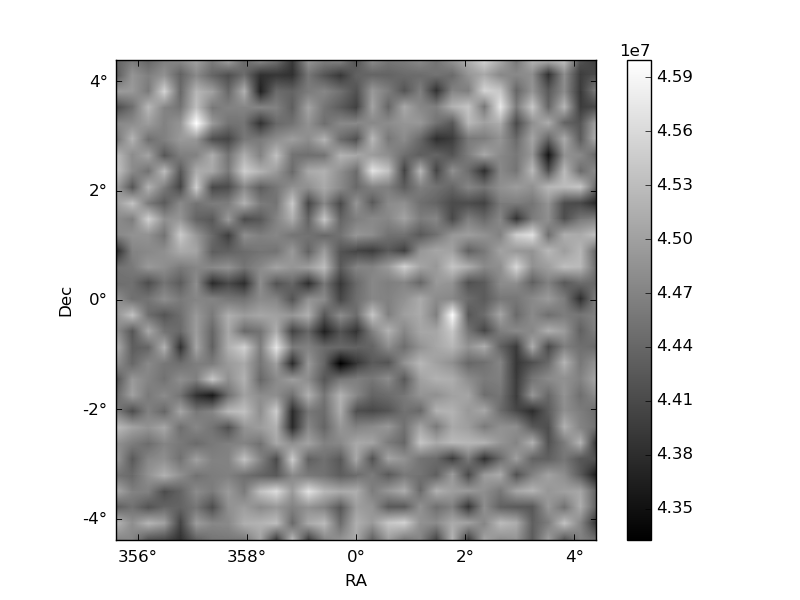
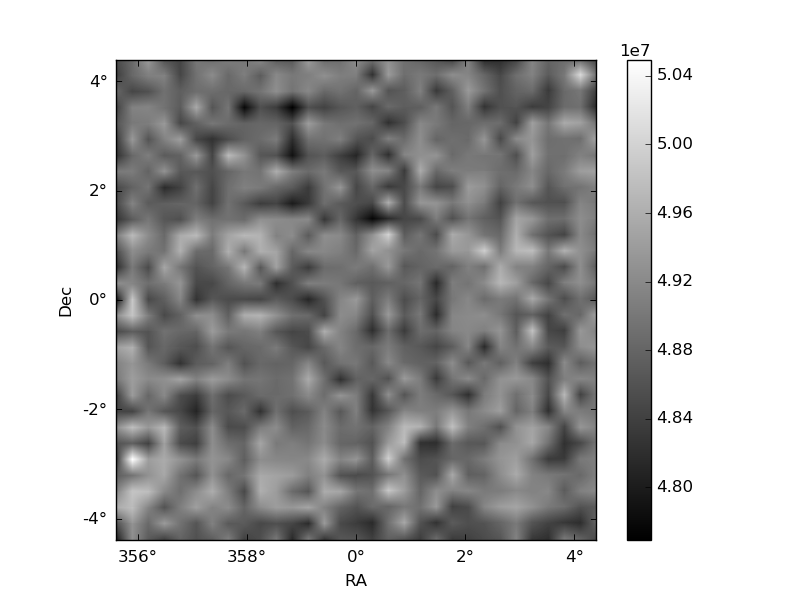
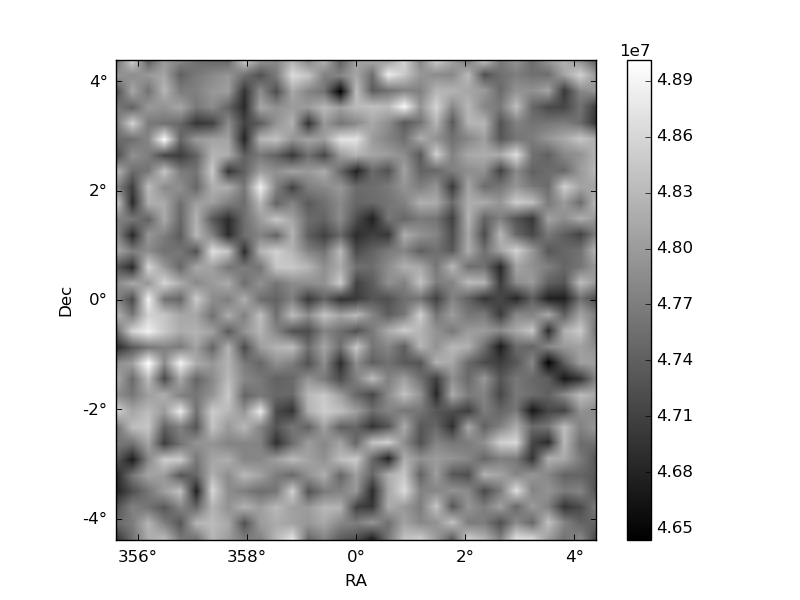
Histogram calculated using DETX and DETY for each event in the final _common_clean file
| Quadrant A | 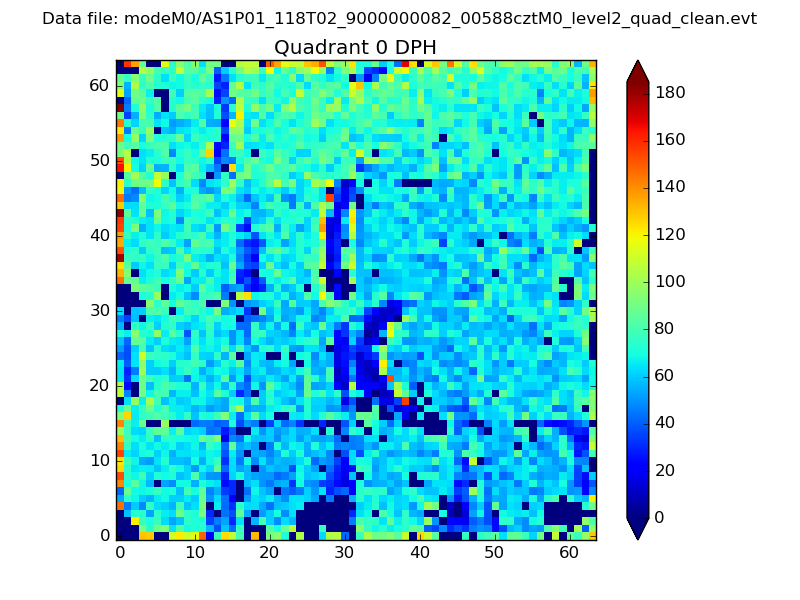 |
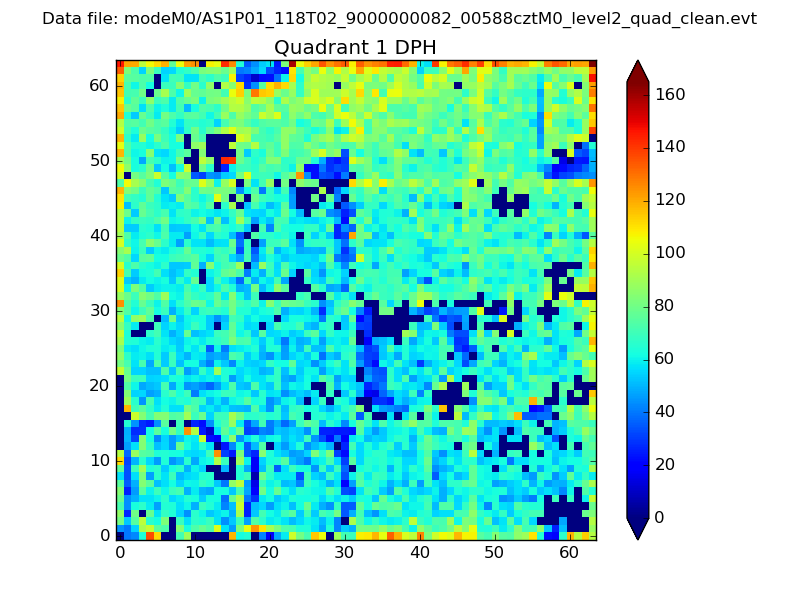 |
Quadrant B |
|---|---|---|---|
| Quadrant D | 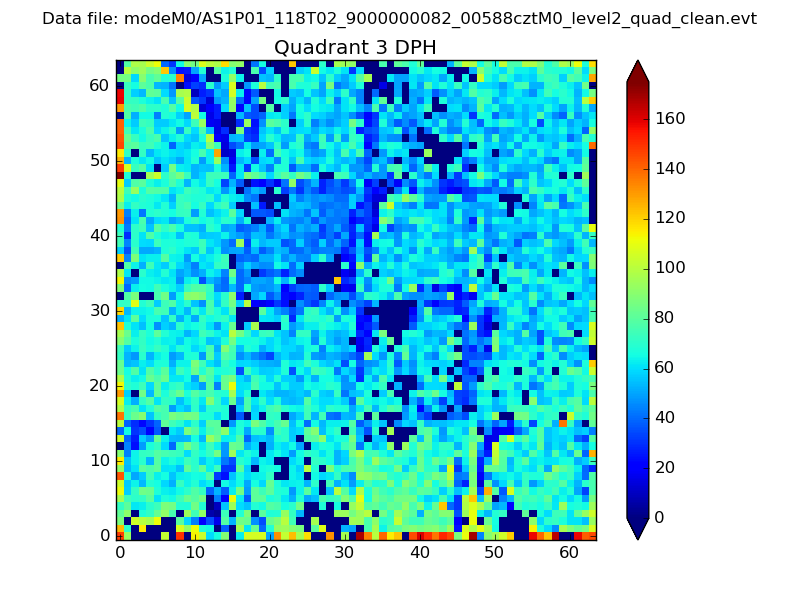 |
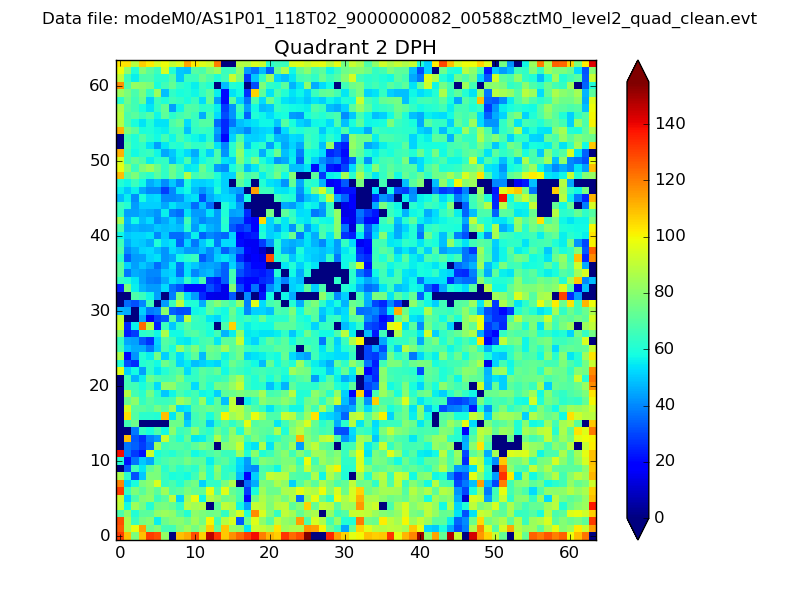 |
Quadrant C |
| Plot type | Count rate plots | Images |
|---|---|---|
| Comparison with Poisson distribution Blue bars denote a histogram of data divided into 1 sec bins. Red curve is a Poisson curve with rate = median count rate of data. |
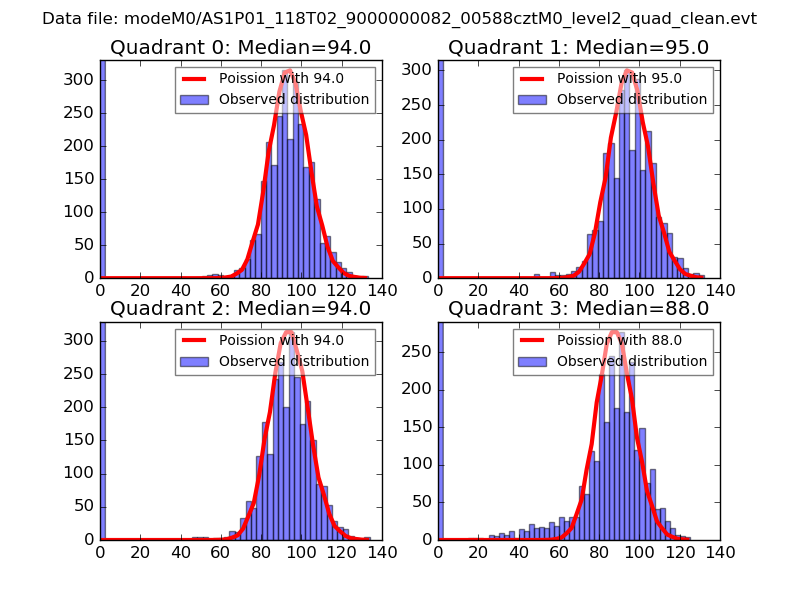 |
 |
| Quadrant-wise count rates Data is divided into 100 sec bins |
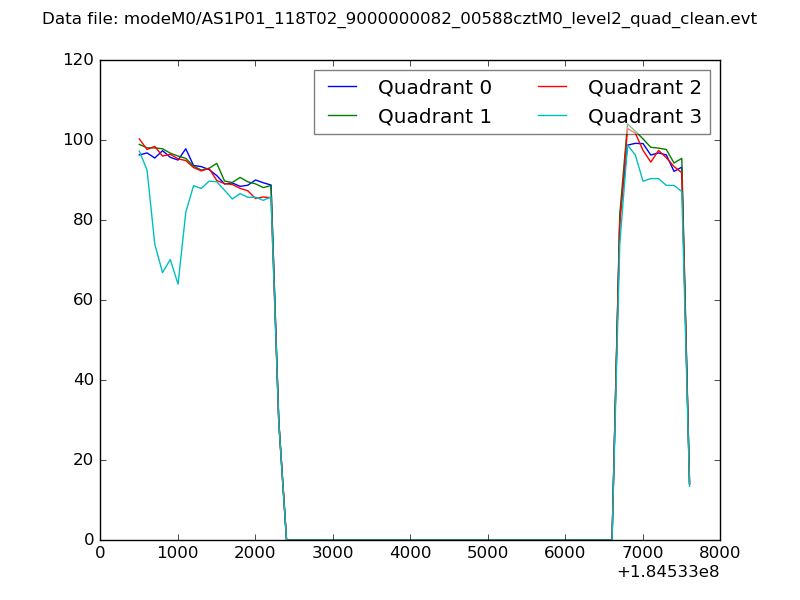 |
|
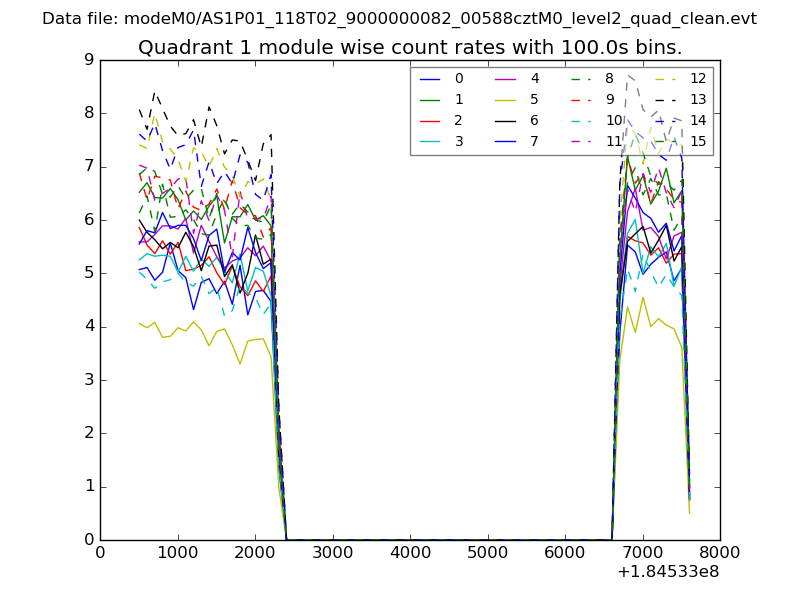
| Module-wise count rates for Quadrant A Data is divided into 100 sec bins |
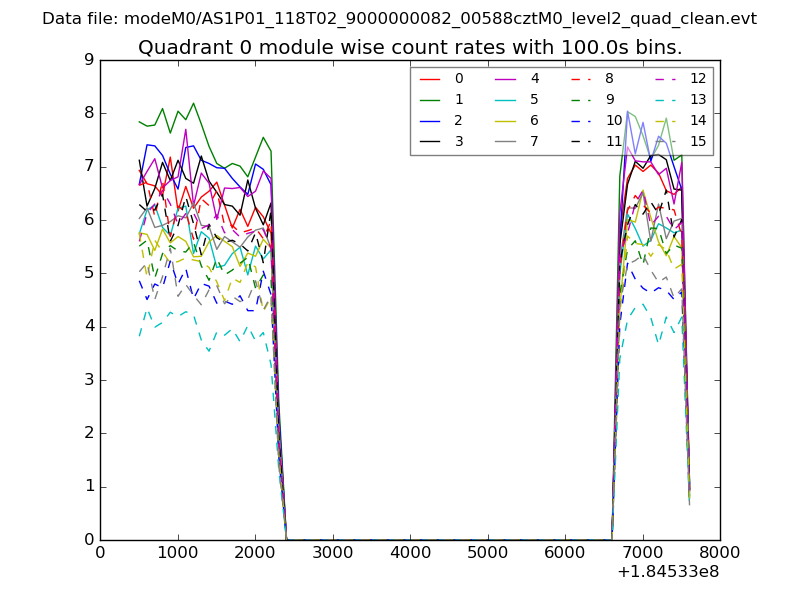 |
 |
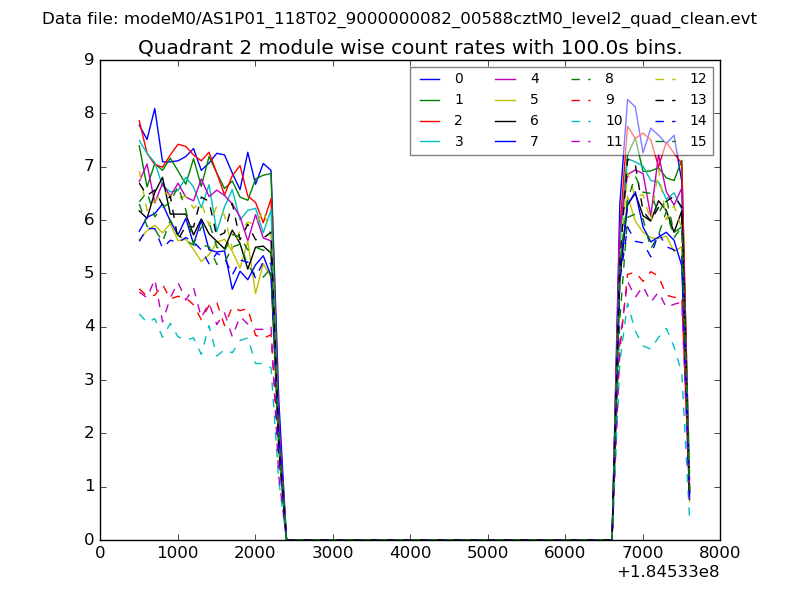
| Module-wise count rates for Quadrant B Data is divided into 100 sec bins |
 |
 |
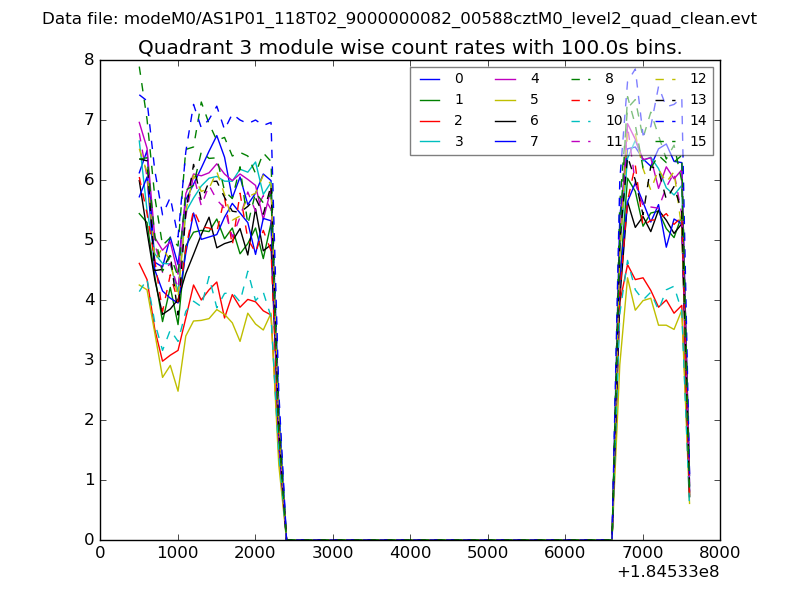
| Module-wise count rates for Quadrant C Data is divided into 100 sec bins |
 |
 |
| Module-wise count rates for Quadrant D Data is divided into 100 sec bins |
 |
 |
| Parameter | Plot |
|---|---|
| CZT HV Monitor | 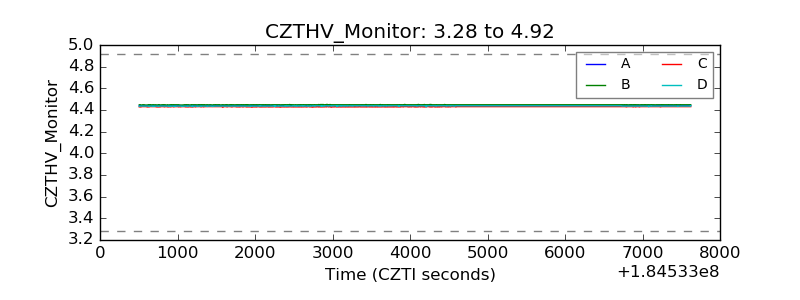 |
| D_VDD | 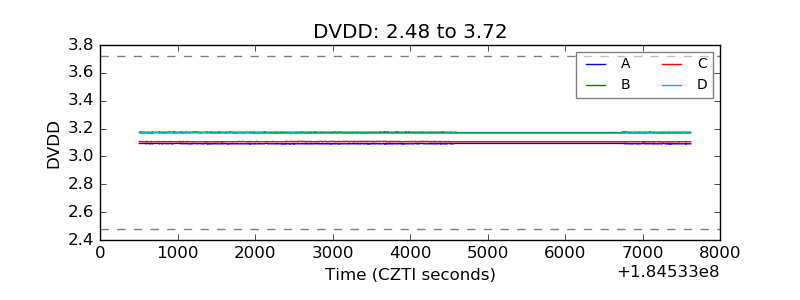 |
| Temperature 1 | 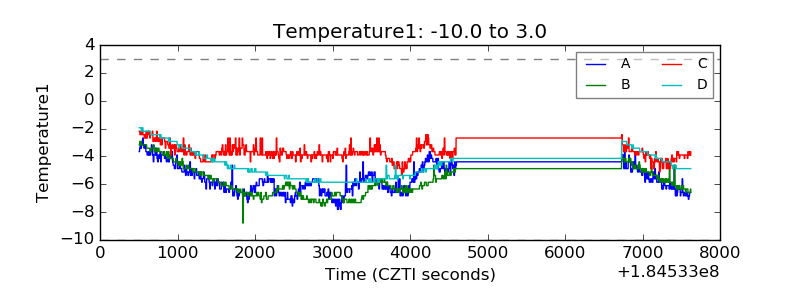 |
| Veto HV Monitor | 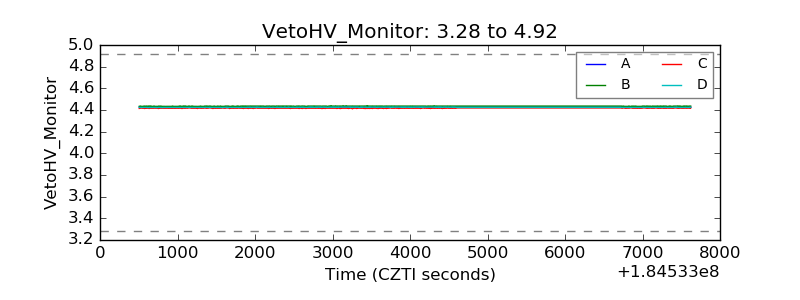 |
| Veto LLD | 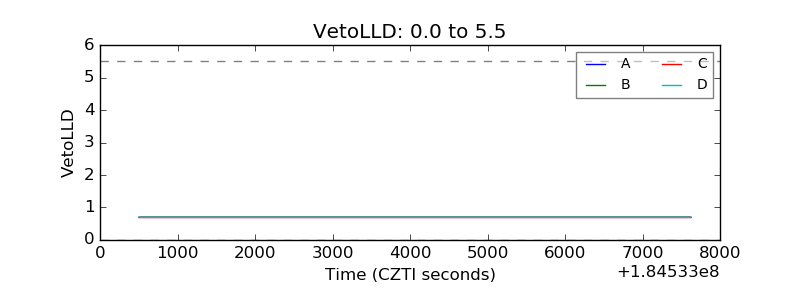 |
| Alpha Counter | 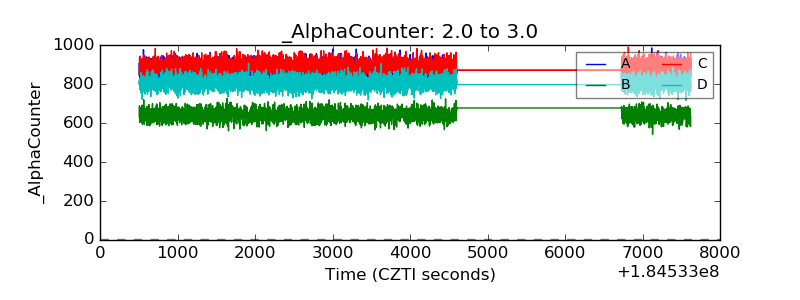 |
| _CPM_Rate | 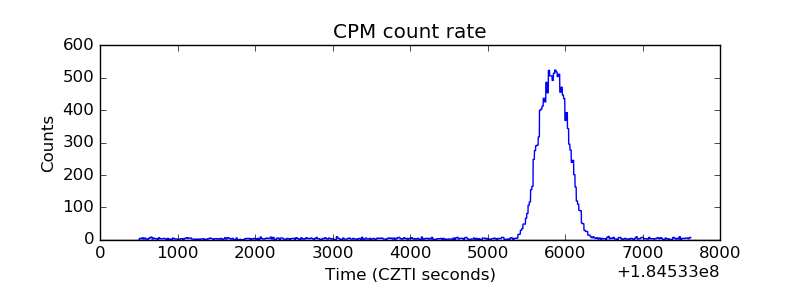 |
| CZT Counter | 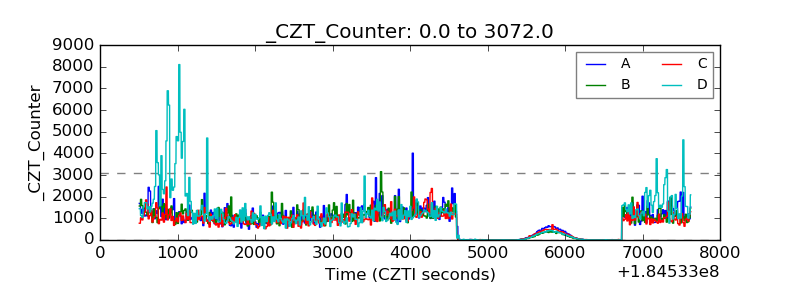 |
| +2.5 Volts monitor |  |
| +5 Volts monitor |  |
| _ROLL_ROT | 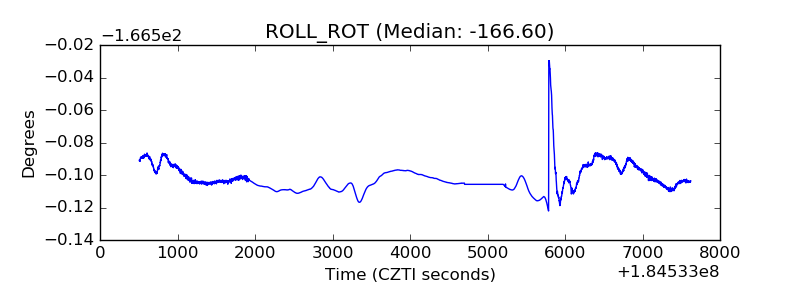 |
| _Roll_DEC | 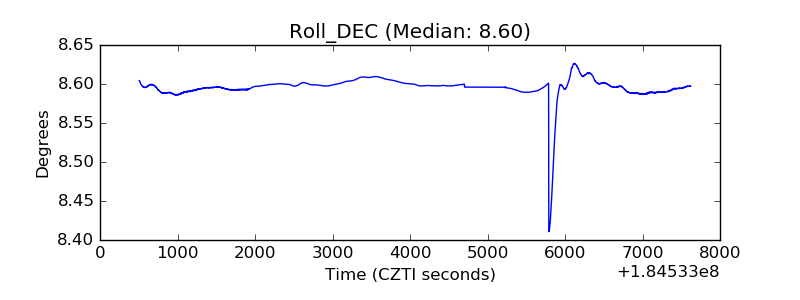 |
| _Roll_RA | 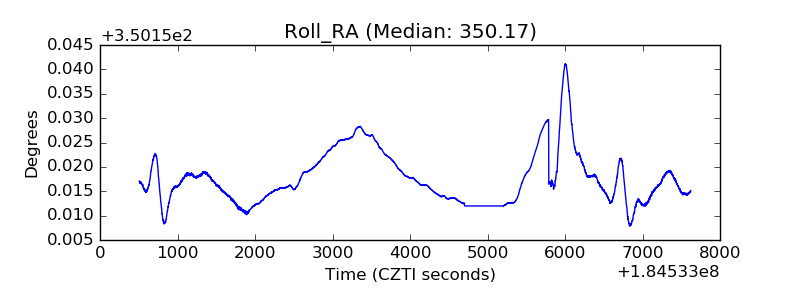 |
| Veto Counter | 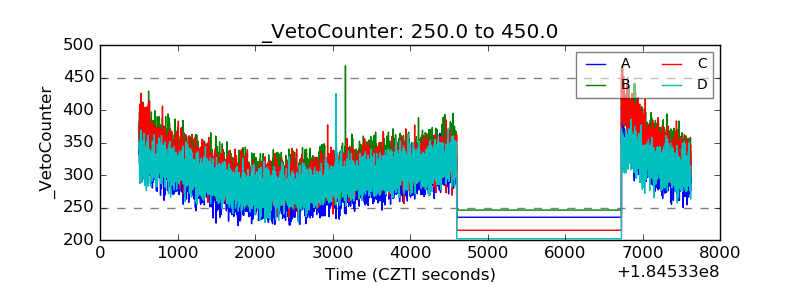 |