| Param | Original file | Final file |
|---|---|---|
| Filename | modeM0/AS1P01_118T02_9000000082_00590cztM0_level2.evt | modeM0/AS1P01_118T02_9000000082_00590cztM0_level2_quad_clean.evt |
| Size (bytes) | 777,913,920 | 47,839,680 |
| Size | 741.9 MB | 45.6 MB |
| Events in quadrant A | 5,930,441 | 274,000 |
| Events in quadrant B | 5,829,668 | 280,834 |
| Events in quadrant C | 5,502,230 | 273,408 |
| Events in quadrant D | 5,957,654 | 262,910 |
| Mode M0 | |||
|---|---|---|---|
| Quadrant | BADHDUFLAG | Total packets | Discarded packets |
| A | 0 | 21240 | 3 |
| B | 0 | 20963 | 2 |
| C | 0 | 19985 | 2 |
| D | 0 | 21348 | 2 |
| Mode SS | |||
|---|---|---|---|
| Quadrant | BADHDUFLAG | Total packets | Discarded packets |
| A | 0 | 104 | 0 |
| B | 0 | 104 | 0 |
| C | 0 | 104 | 0 |
| D | 0 | 104 | 0 |
| Mode M9 | |||
|---|---|---|---|
| Quadrant | BADHDUFLAG | Total packets | Discarded packets |
| A | 0 | 37 | 0 |
| B | 0 | 37 | 0 |
| C | 0 | 37 | 0 |
| D | 0 | 38 | 0 |
| Quadrant | Total seconds | Saturated seconds | Saturation percentage |
|---|---|---|---|
| A | 5093 | 11 | 0.215983% |
| B | 5093 | 3 | 0.058904% |
| C | 5093 | 8 | 0.157078% |
| D | 5093 | 85 | 1.668957% |
Noise dominated data is calculated using 1-second bins in cleaned event files. If a bin has >2000 counts, and if more than 50% of those come from <1% of pixels, then it is considered to be noise-dominated and hence unusable.
| Quadrant | # 1 sec bins | Bins with >0 counts | Bins with >2000 counts | High rate bins dominated by noise | Noise dominated (total time) | Noise dominated (detector-on time) | Marked lightcurve |
|---|---|---|---|---|---|---|---|
| A | 7219 | 5094 | 117 | 117 | 1.62% | 2.30% | 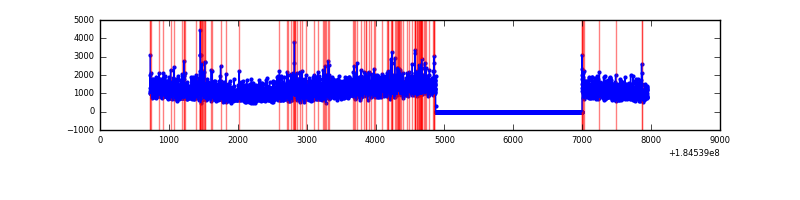 |
| B | 7219 | 5094 | 62 | 62 | 0.86% | 1.22% | 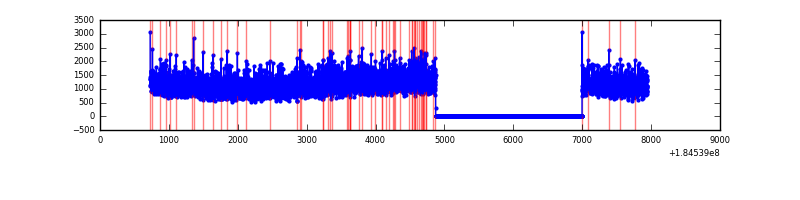 |
| C | 7219 | 5094 | 45 | 45 | 0.62% | 0.88% | 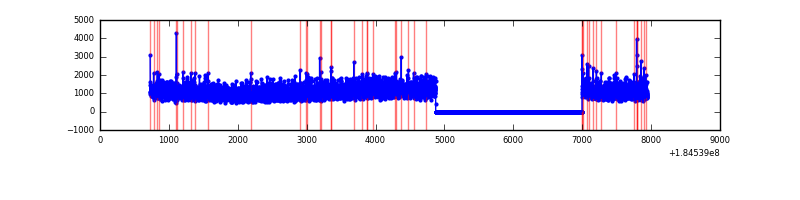 |
| D | 7219 | 5094 | 291 | 291 | 4.03% | 5.71% | 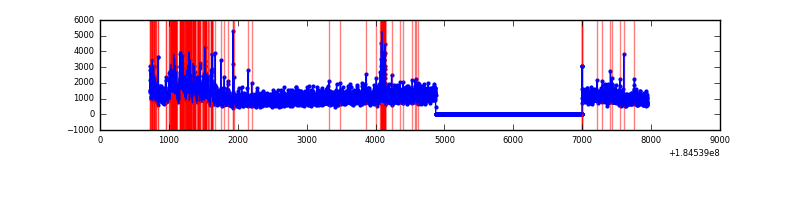 |
Top three noisy pixels from each quadrant. If the there are fewer than three noisy pixels in the level2.evt file, extra rows are filled as -1
| Pixel properties | Quadrant properties | ||||||
|---|---|---|---|---|---|---|---|
| Quadrant | DetID | PixID | Counts | Sigma | Mean | Median | Sigma |
| A | 0 | 69 | 56202 | 165.43 | 1487 | 1472 | 330.8 |
| A | 13 | 160 | 46607 | 136.43 | 1487 | 1472 | 330.8 |
| A | 13 | 17 | 36842 | 106.91 | 1487 | 1472 | 330.8 |
| B | 4 | 250 | 24851 | 66.24 | 1509 | 1515 | 352.3 |
| B | 5 | 249 | 11363 | 27.95 | 1509 | 1515 | 352.3 |
| B | 0 | 153 | 10259 | 24.82 | 1509 | 1515 | 352.3 |
| C | 3 | 159 | 36412 | 89.71 | 1387 | 1441 | 389.8 |
| C | 15 | 241 | 12530 | 28.44 | 1387 | 1441 | 389.8 |
| C | 5 | 174 | 5780 | 11.13 | 1387 | 1441 | 389.8 |
| D | 1 | 4 | 468016 | 1142.83 | 1298 | 1351 | 408.3 |
| D | 13 | 252 | 106871 | 258.41 | 1298 | 1351 | 408.3 |
| D | 13 | 216 | 99440 | 240.21 | 1298 | 1351 | 408.3 |
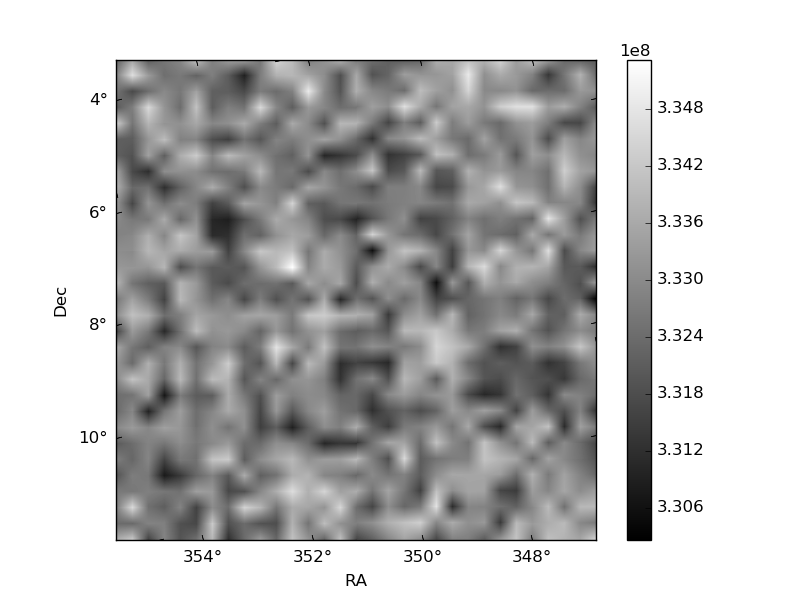
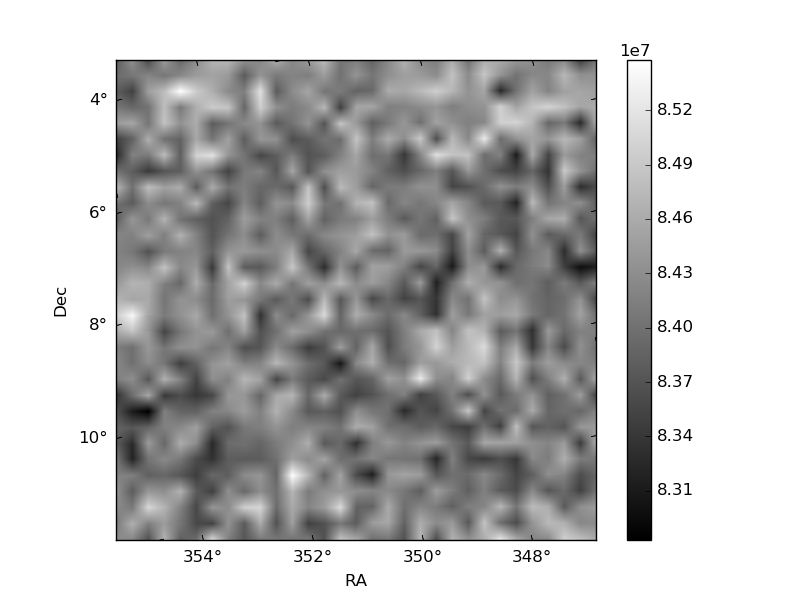
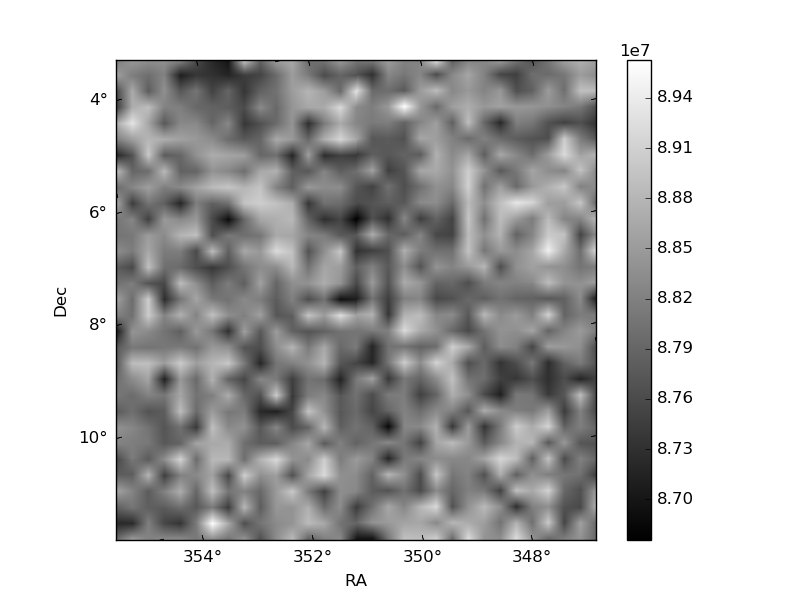
Histogram calculated using DETX and DETY for each event in the final _common_clean file
| Quadrant A | 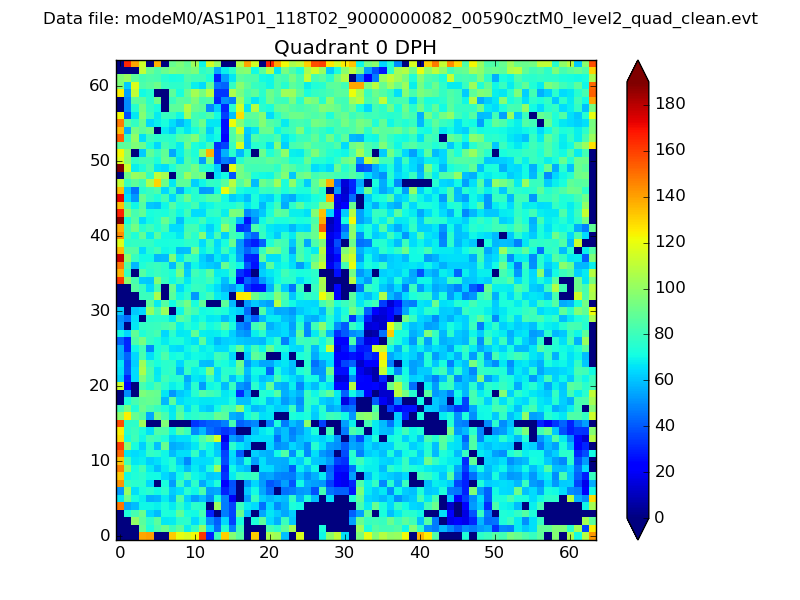 |
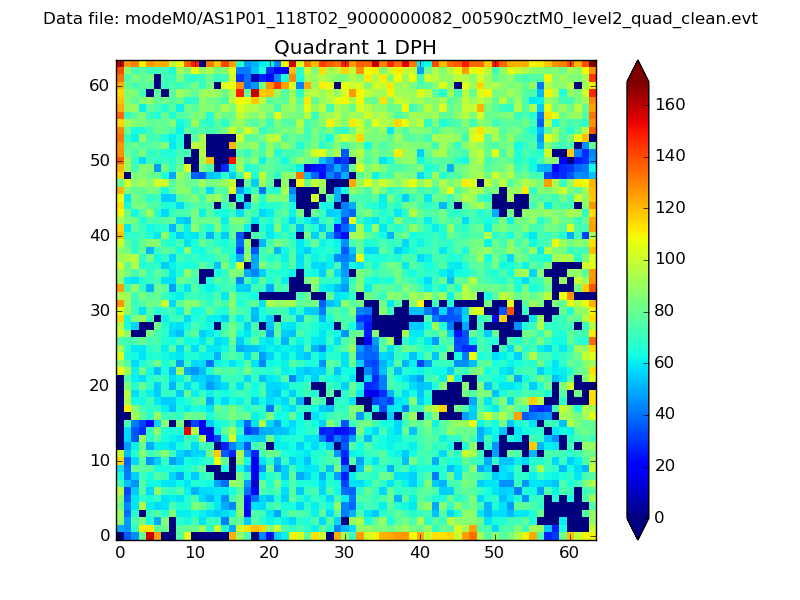 |
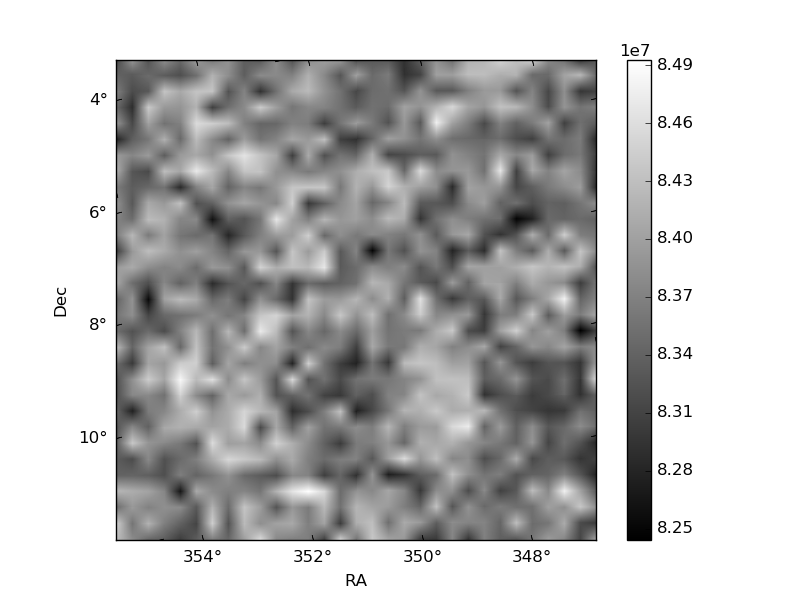
Quadrant B |
|---|---|---|---|
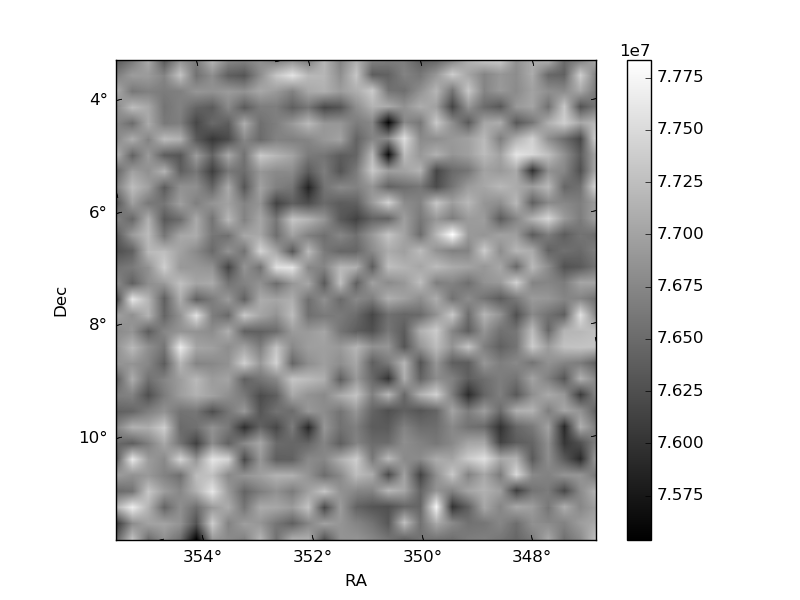
| Quadrant D | 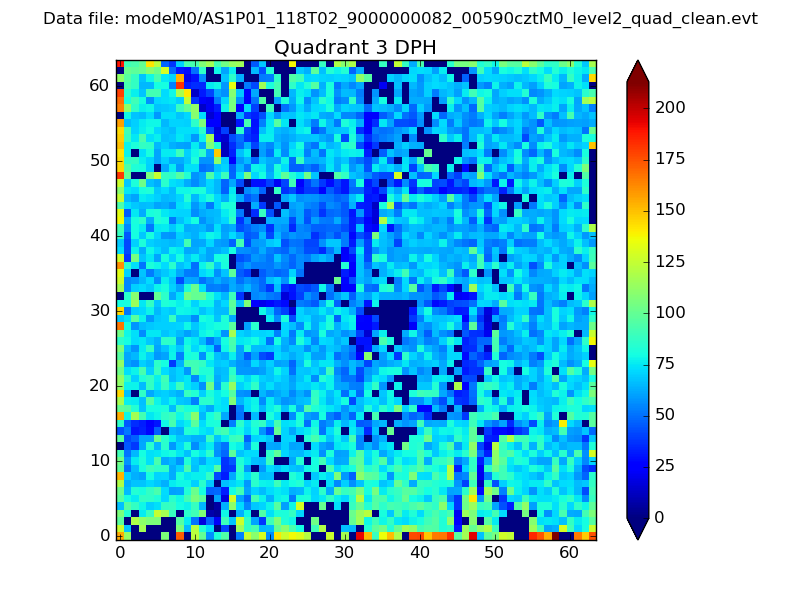 |
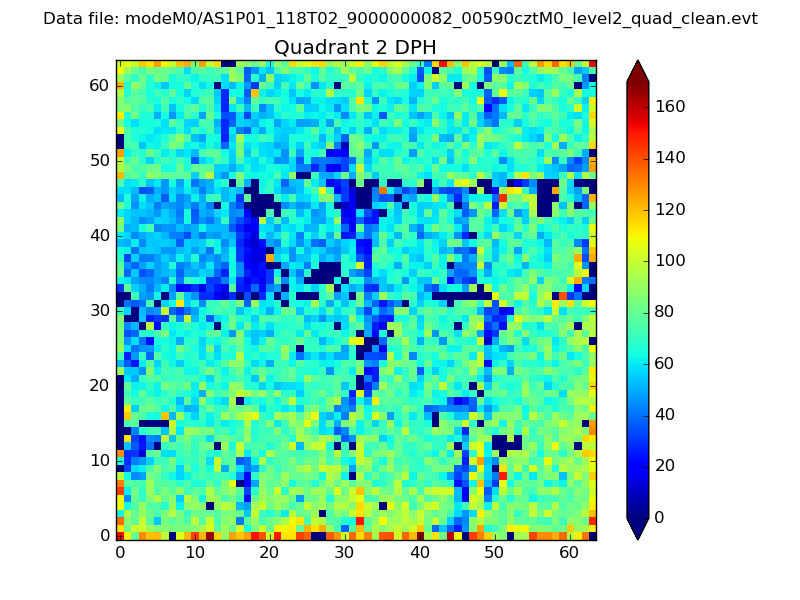 |
Quadrant C |
| Plot type | Count rate plots | Images |
|---|---|---|
| Comparison with Poisson distribution Blue bars denote a histogram of data divided into 1 sec bins. Red curve is a Poisson curve with rate = median count rate of data. |
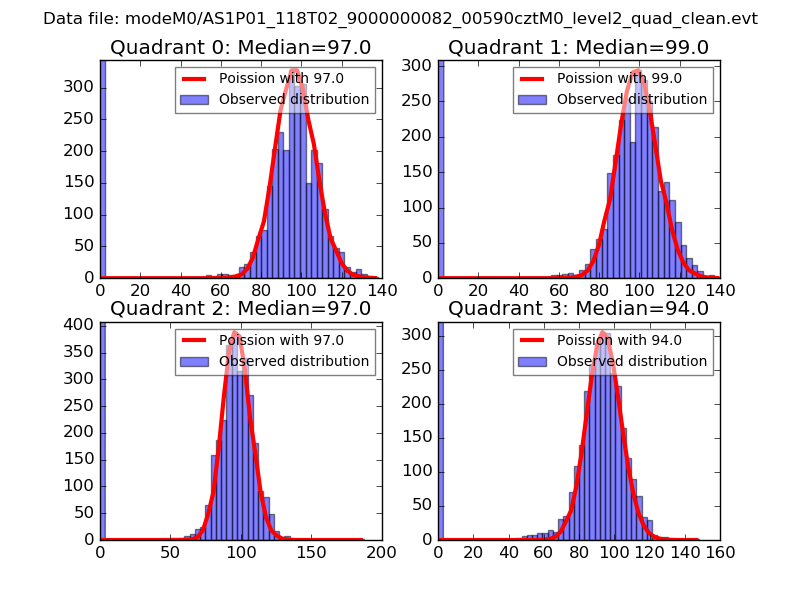 |
 |
| Quadrant-wise count rates Data is divided into 100 sec bins |
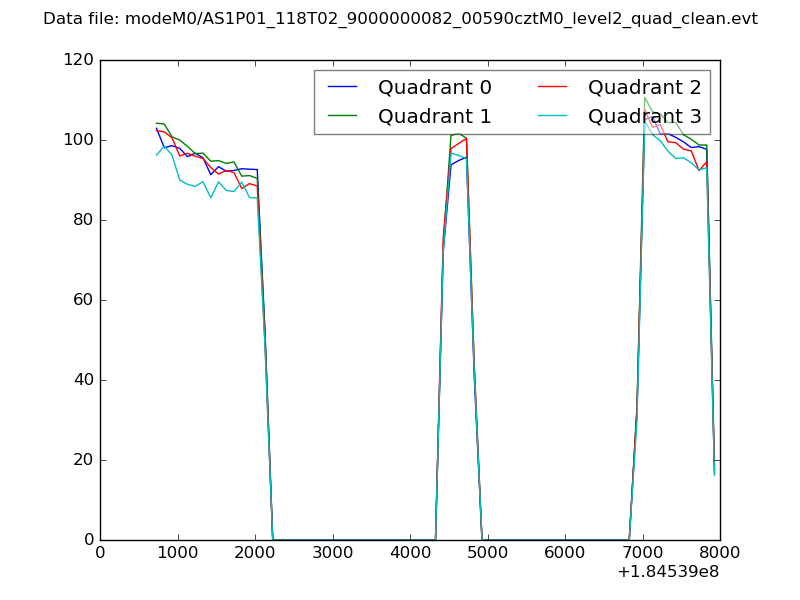 |
|
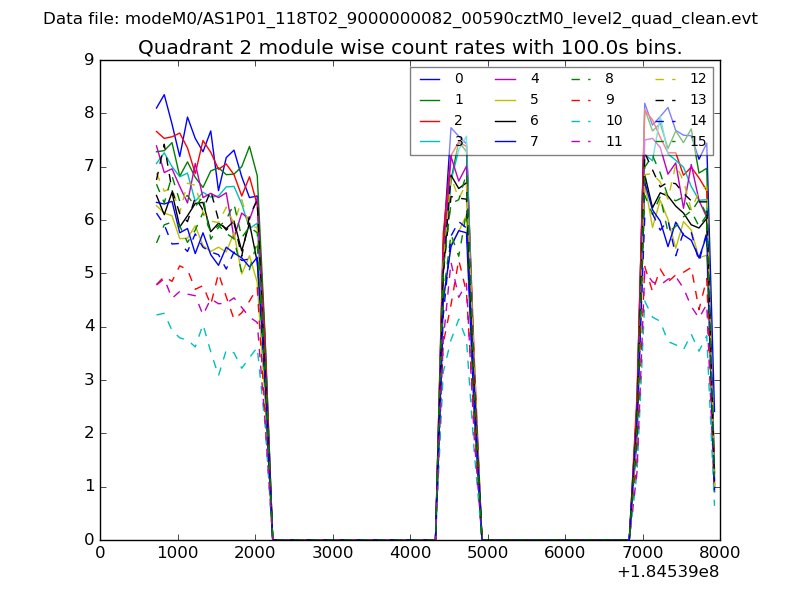
| Module-wise count rates for Quadrant A Data is divided into 100 sec bins |
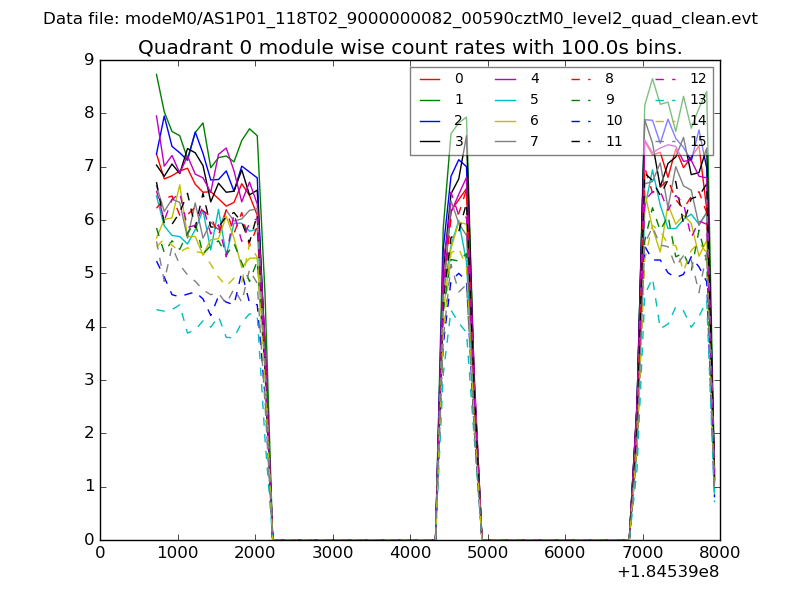 |
 |
| Module-wise count rates for Quadrant B Data is divided into 100 sec bins |
 |
 |
| Module-wise count rates for Quadrant C Data is divided into 100 sec bins |
 |
 |
| Module-wise count rates for Quadrant D Data is divided into 100 sec bins |
 |
 |
| Parameter | Plot |
|---|---|
| CZT HV Monitor | 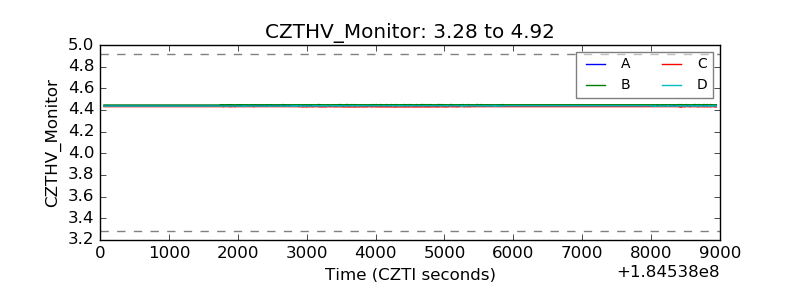 |
| D_VDD | 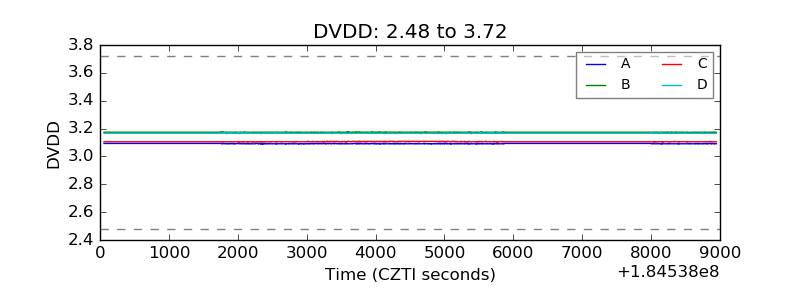 |
| Temperature 1 | 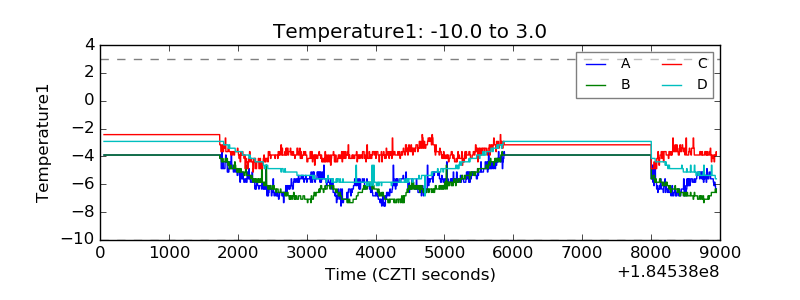 |
| Veto HV Monitor | 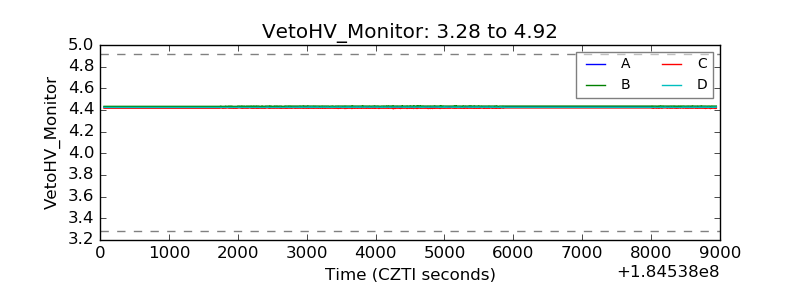 |
| Veto LLD | 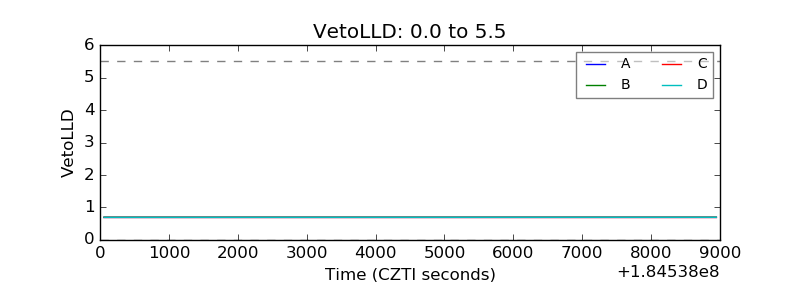 |
| Alpha Counter | 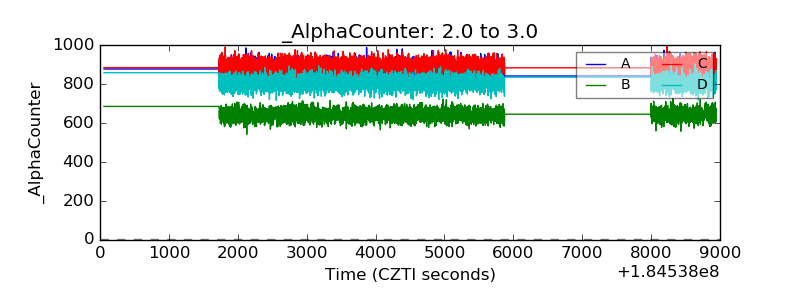 |
| _CPM_Rate | 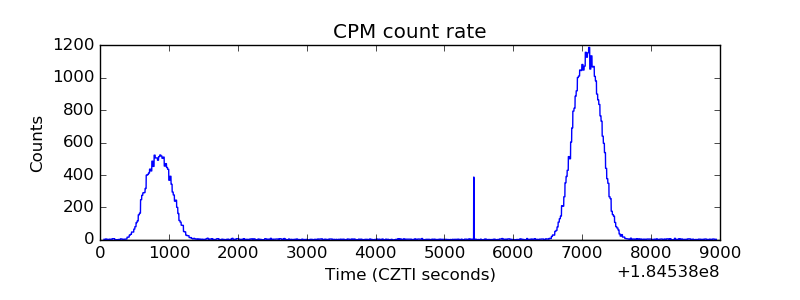 |
| CZT Counter | 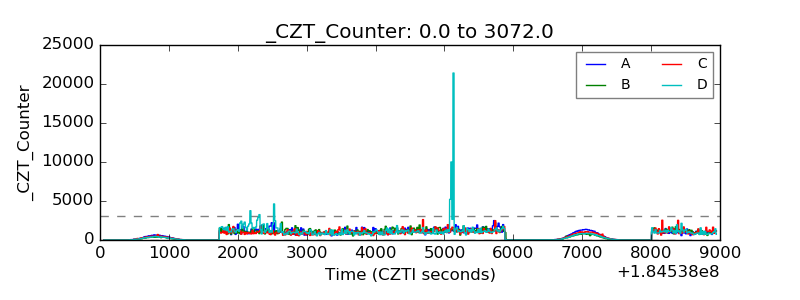 |
| +2.5 Volts monitor |  |
| +5 Volts monitor |  |
| _ROLL_ROT |  |
| _Roll_DEC | 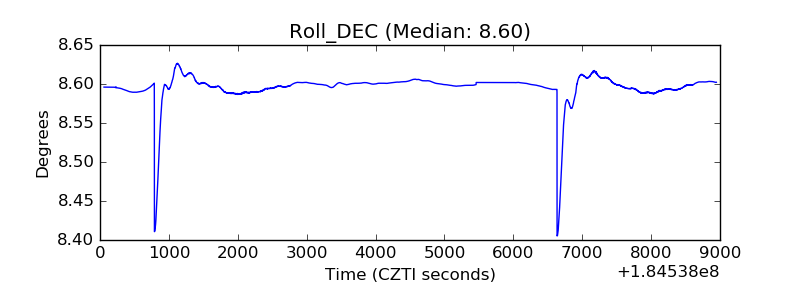 |
| _Roll_RA | 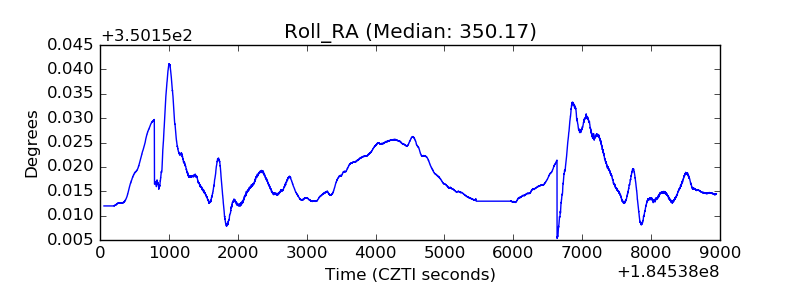 |
| Veto Counter | 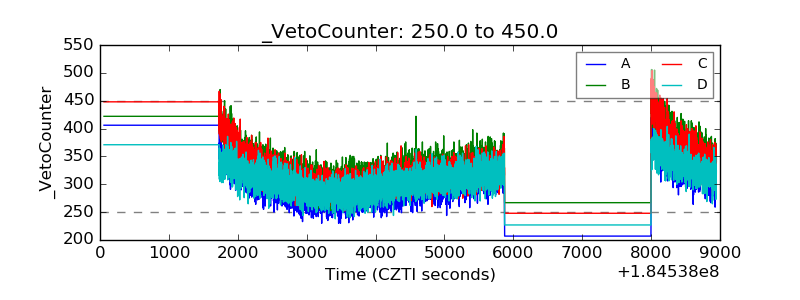 |