| Param | Original file | Final file |
|---|---|---|
| Filename | modeM0/AS1P01_118T02_9000000082_00592cztM0_level2.evt | modeM0/AS1P01_118T02_9000000082_00592cztM0_level2_quad_clean.evt |
| Size (bytes) | 858,651,840 | 39,997,440 |
| Size | 818.9 MB | 38.1 MB |
| Events in quadrant A | 6,325,728 | 212,697 |
| Events in quadrant B | 6,483,043 | 219,435 |
| Events in quadrant C | 6,312,030 | 207,908 |
| Events in quadrant D | 6,536,637 | 204,313 |
| Mode M0 | |||
|---|---|---|---|
| Quadrant | BADHDUFLAG | Total packets | Discarded packets |
| A | 0 | 22490 | 3 |
| B | 0 | 22971 | 2 |
| C | 0 | 22471 | 2 |
| D | 0 | 23151 | 2 |
| Mode SS | |||
|---|---|---|---|
| Quadrant | BADHDUFLAG | Total packets | Discarded packets |
| A | 0 | 106 | 0 |
| B | 0 | 106 | 0 |
| C | 0 | 106 | 0 |
| D | 0 | 106 | 0 |
| Mode M9 | |||
|---|---|---|---|
| Quadrant | BADHDUFLAG | Total packets | Discarded packets |
| A | 0 | 30 | 0 |
| B | 0 | 30 | 0 |
| C | 0 | 30 | 0 |
| D | 0 | 31 | 0 |
| Quadrant | Total seconds | Saturated seconds | Saturation percentage |
|---|---|---|---|
| A | 5226 | 21 | 0.401837% |
| B | 5226 | 15 | 0.287026% |
| C | 5226 | 97 | 1.856104% |
| D | 5226 | 152 | 2.908534% |
Noise dominated data is calculated using 1-second bins in cleaned event files. If a bin has >2000 counts, and if more than 50% of those come from <1% of pixels, then it is considered to be noise-dominated and hence unusable.
| Quadrant | # 1 sec bins | Bins with >0 counts | Bins with >2000 counts | High rate bins dominated by noise | Noise dominated (total time) | Noise dominated (detector-on time) | Marked lightcurve |
|---|---|---|---|---|---|---|---|
| A | 7351 | 5227 | 160 | 160 | 2.18% | 3.06% | 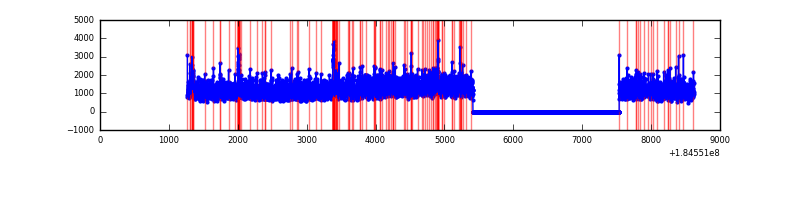 |
| B | 7351 | 5227 | 130 | 130 | 1.77% | 2.49% | 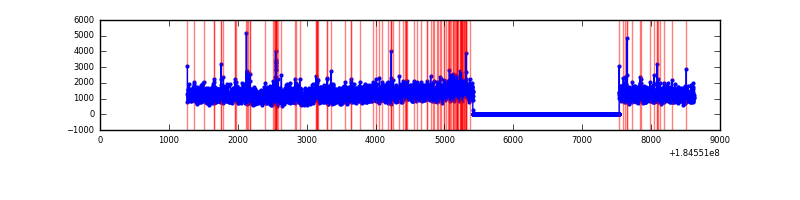 |
| C | 7351 | 5227 | 202 | 202 | 2.75% | 3.86% | 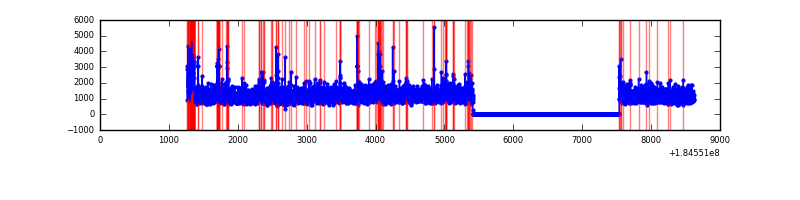 |
| D | 7351 | 5227 | 314 | 314 | 4.27% | 6.01% | 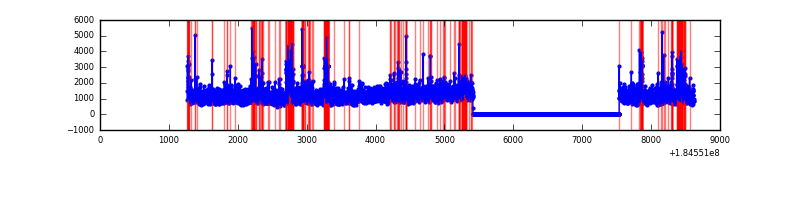 |
Top three noisy pixels from each quadrant. If the there are fewer than three noisy pixels in the level2.evt file, extra rows are filled as -1
| Pixel properties | Quadrant properties | ||||||
|---|---|---|---|---|---|---|---|
| Quadrant | DetID | PixID | Counts | Sigma | Mean | Median | Sigma |
| A | 14 | 79 | 148889 | 427.08 | 1573 | 1562 | 345.0 |
| A | 0 | 149 | 50372 | 141.49 | 1573 | 1562 | 345.0 |
| A | 13 | 160 | 33369 | 92.2 | 1573 | 1562 | 345.0 |
| B | 7 | 221 | 172408 | 458.07 | 1595 | 1605 | 372.9 |
| B | 0 | 153 | 64540 | 168.78 | 1595 | 1605 | 372.9 |
| B | 5 | 249 | 38287 | 98.38 | 1595 | 1605 | 372.9 |
| C | 3 | 159 | 582987 | 1464.77 | 1427 | 1479 | 397.0 |
| C | 1 | 1 | 82420 | 203.88 | 1427 | 1479 | 397.0 |
| C | 9 | 83 | 23917 | 56.52 | 1427 | 1479 | 397.0 |
| D | 1 | 4 | 347627 | 810.85 | 1362 | 1414 | 427.0 |
| D | 13 | 37 | 231676 | 539.29 | 1362 | 1414 | 427.0 |
| D | 7 | 39 | 204647 | 475.98 | 1362 | 1414 | 427.0 |
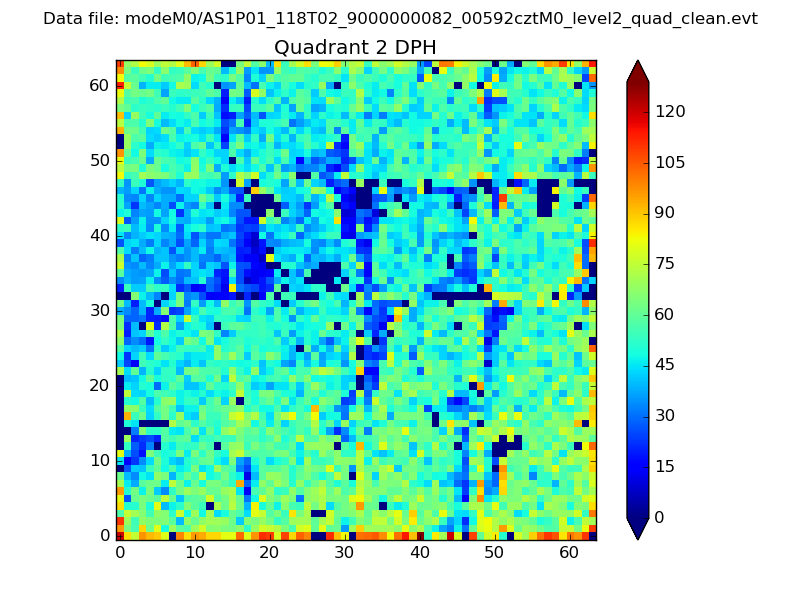
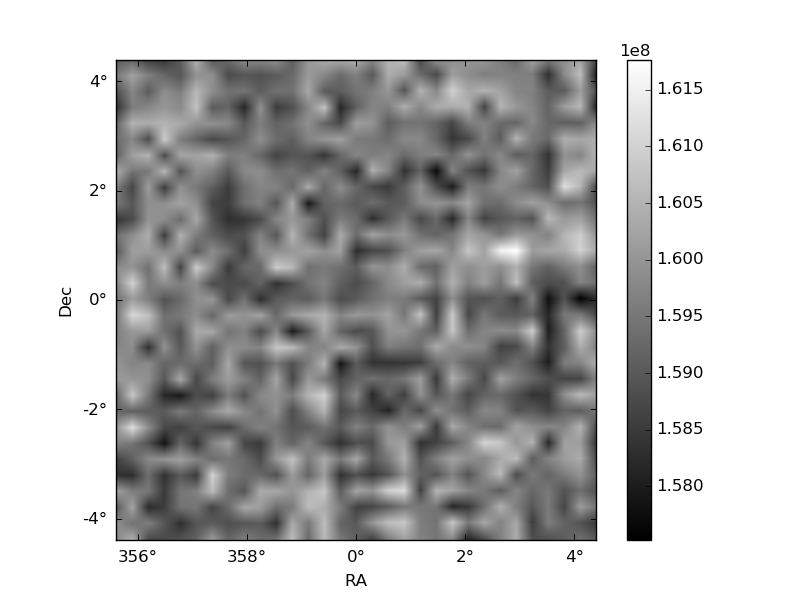
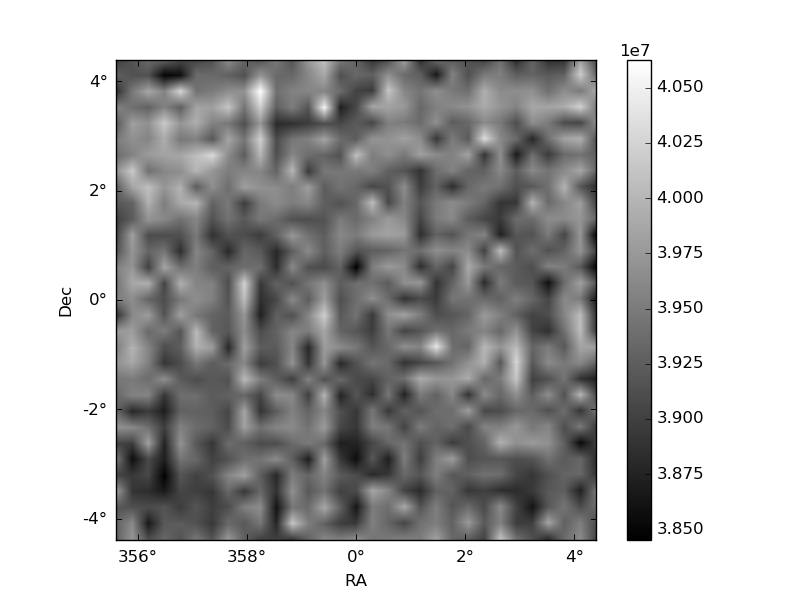
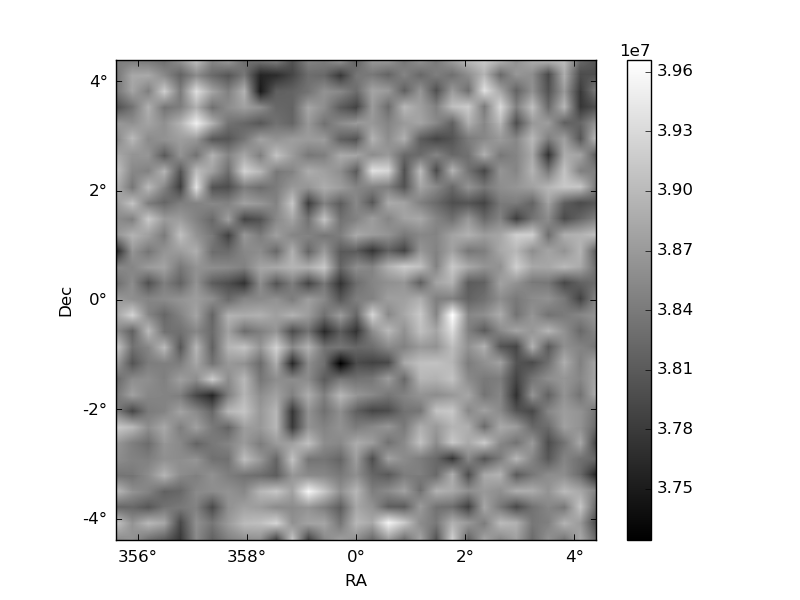
Histogram calculated using DETX and DETY for each event in the final _common_clean file
| Quadrant A | 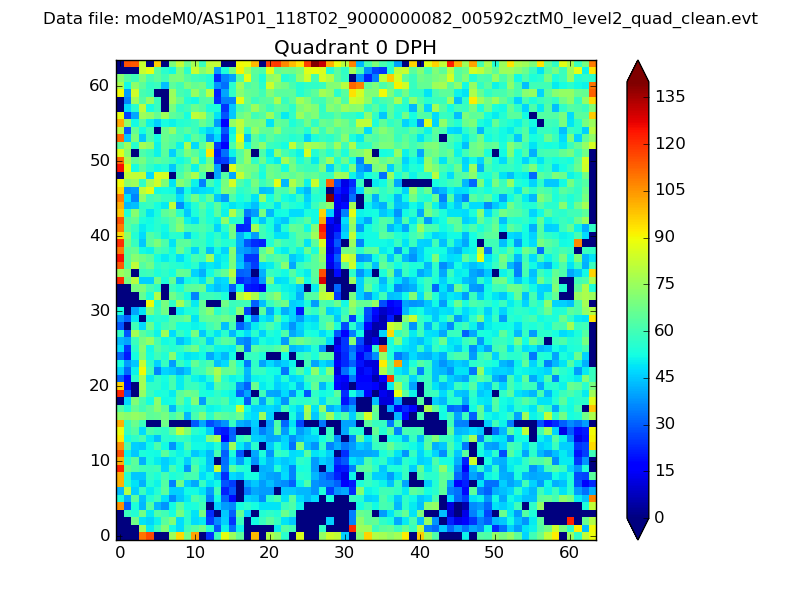 |
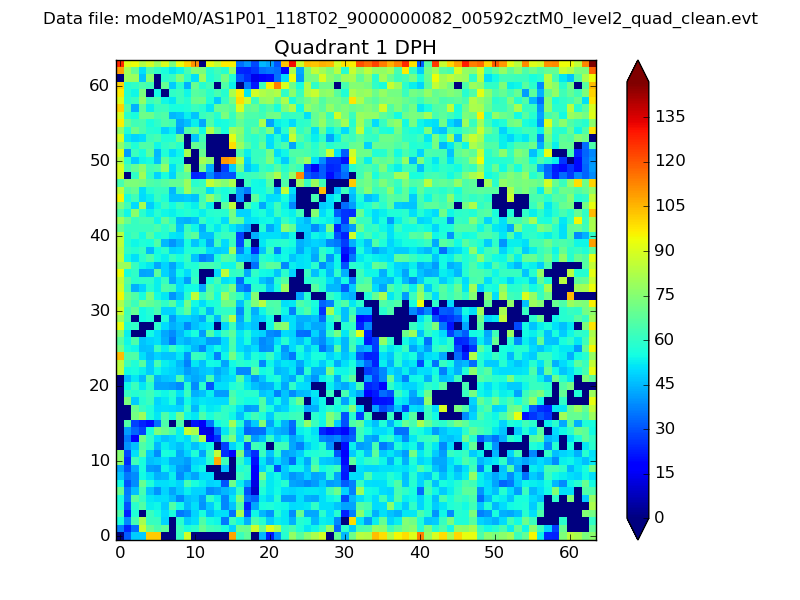 |
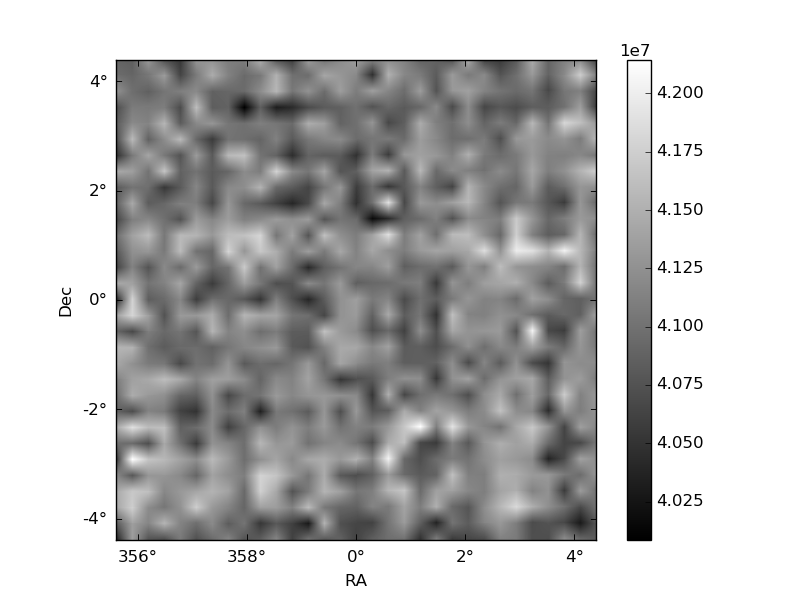
Quadrant B |
|---|---|---|---|
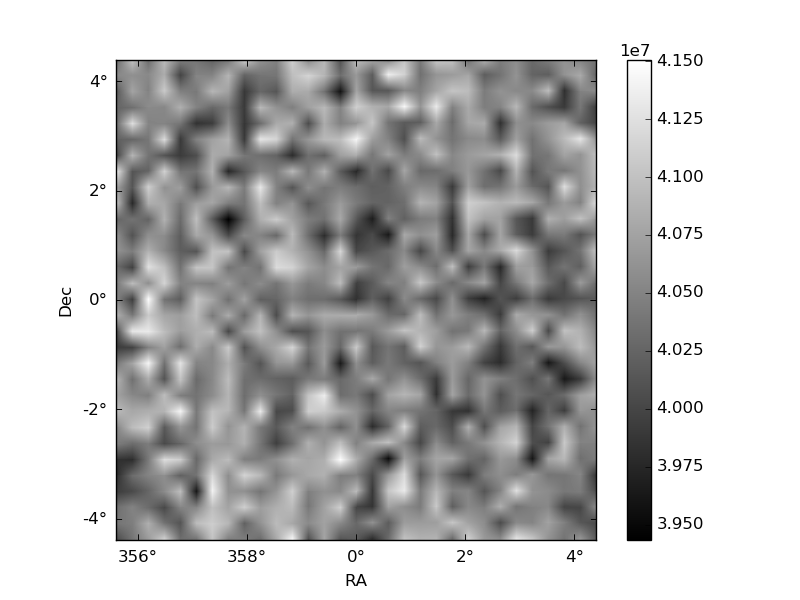
| Quadrant D | 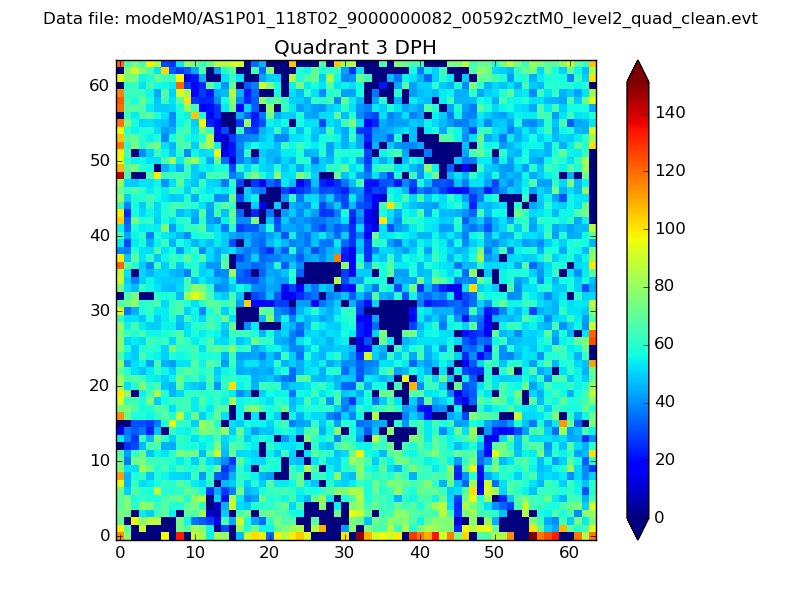 |
 |
Quadrant C |
| Plot type | Count rate plots | Images |
|---|---|---|
| Comparison with Poisson distribution Blue bars denote a histogram of data divided into 1 sec bins. Red curve is a Poisson curve with rate = median count rate of data. |
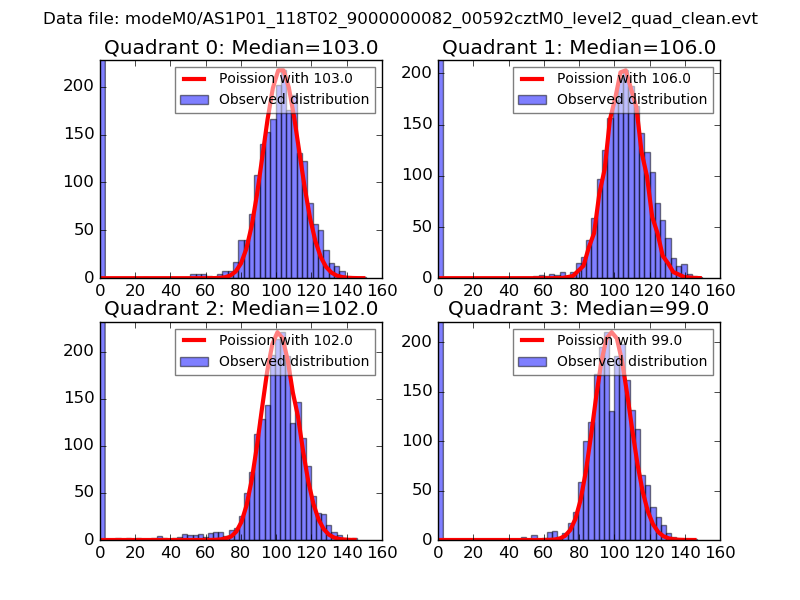 |
 |
| Quadrant-wise count rates Data is divided into 100 sec bins |
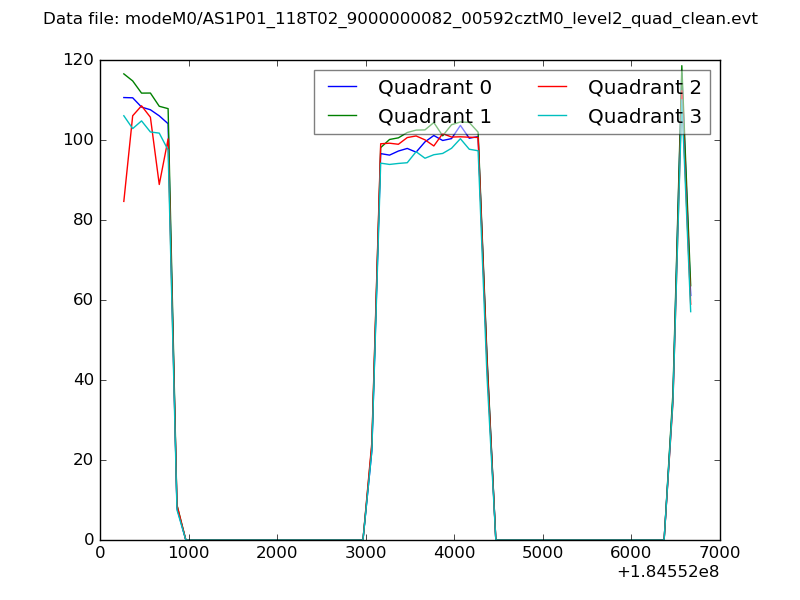 |
|
| Module-wise count rates for Quadrant A Data is divided into 100 sec bins |
 |
 |
| Module-wise count rates for Quadrant B Data is divided into 100 sec bins |
 |
 |
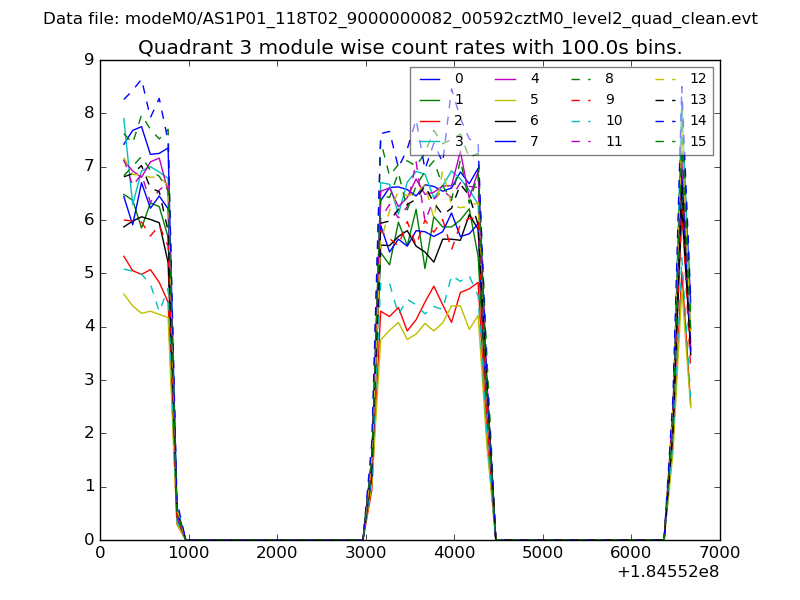
| Module-wise count rates for Quadrant C Data is divided into 100 sec bins |
 |
 |
| Module-wise count rates for Quadrant D Data is divided into 100 sec bins |
 |
 |
| Parameter | Plot |
|---|---|
| CZT HV Monitor |  |
| D_VDD | 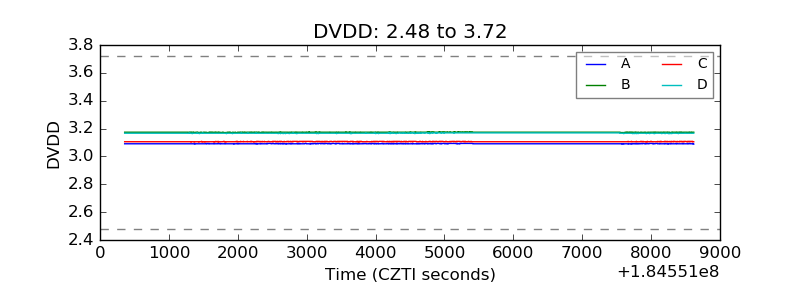 |
| Temperature 1 | 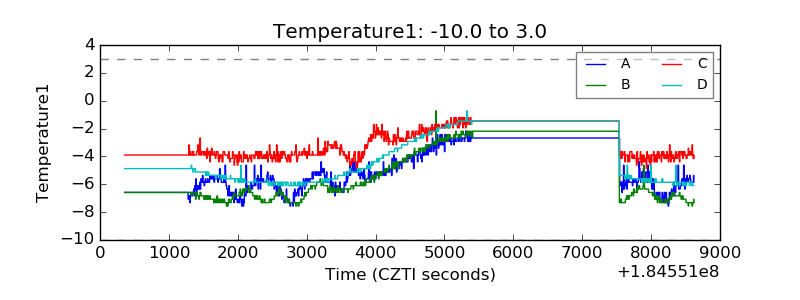 |
| Veto HV Monitor | 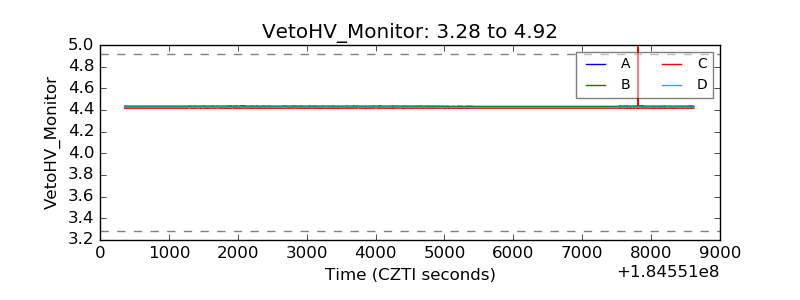 |
| Veto LLD | 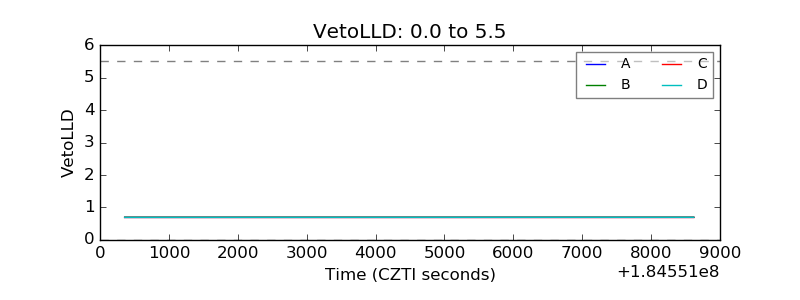 |
| Alpha Counter | 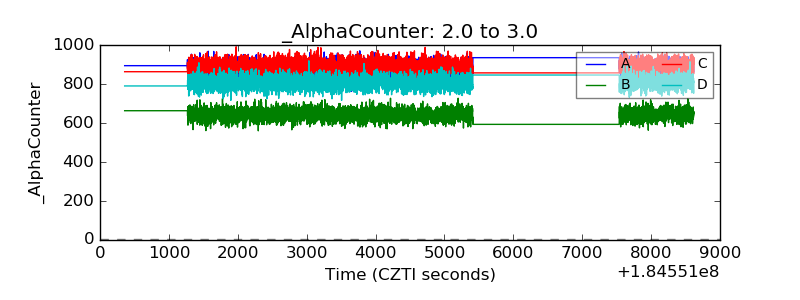 |
| _CPM_Rate | 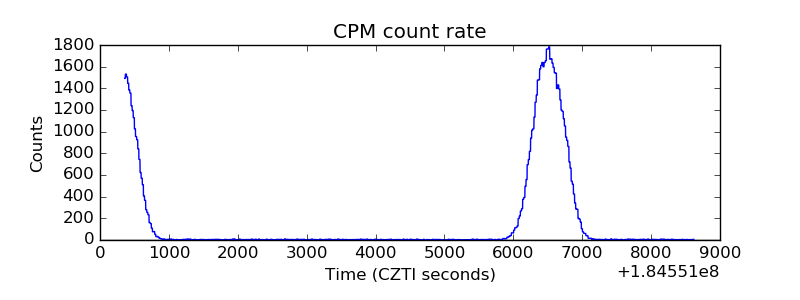 |
| CZT Counter | 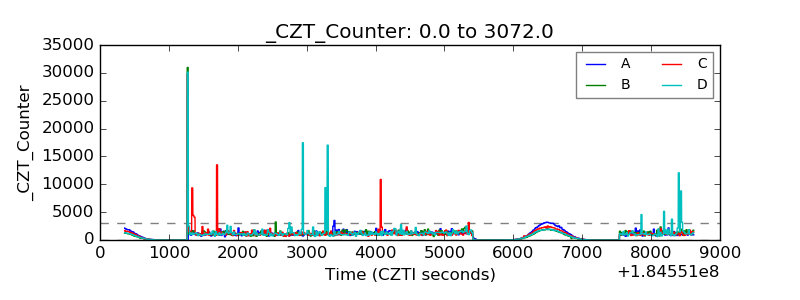 |
| +2.5 Volts monitor |  |
| +5 Volts monitor |  |
| _ROLL_ROT | 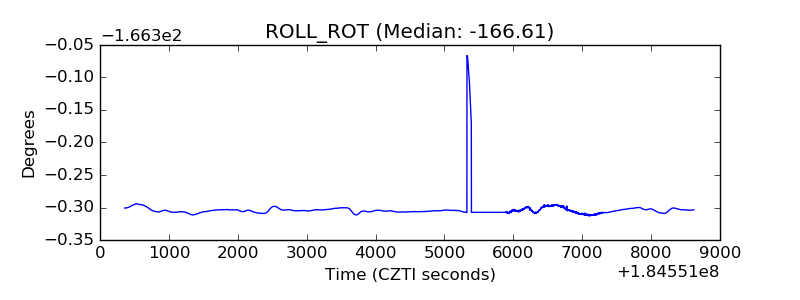 |
| _Roll_DEC | 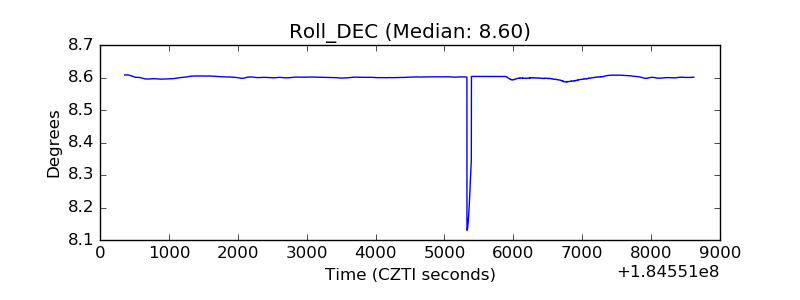 |
| _Roll_RA | 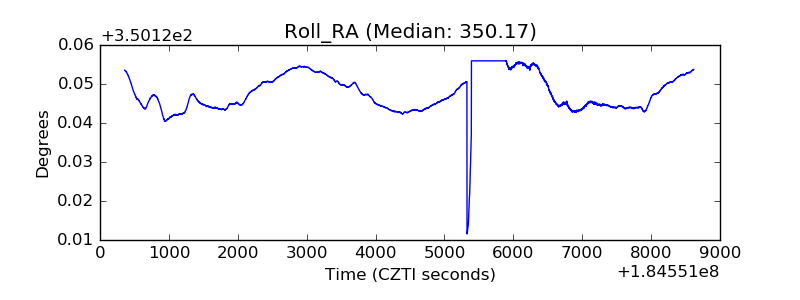 |
| Veto Counter |  |