| Param | Original file | Final file |
|---|---|---|
| Filename | modeM0/AS1P01_118T02_9000000082_00593cztM0_level2.evt | modeM0/AS1P01_118T02_9000000082_00593cztM0_level2_quad_clean.evt |
| Size (bytes) | 665,879,040 | 34,767,360 |
| Size | 635.0 MB | 33.2 MB |
| Events in quadrant A | 4,982,278 | 189,584 |
| Events in quadrant B | 5,231,762 | 195,413 |
| Events in quadrant C | 4,577,911 | 193,214 |
| Events in quadrant D | 5,097,603 | 181,473 |
| Mode M0 | |||
|---|---|---|---|
| Quadrant | BADHDUFLAG | Total packets | Discarded packets |
| A | 0 | 17710 | 1 |
| B | 0 | 18471 | 1 |
| C | 0 | 16539 | 1 |
| D | 0 | 18114 | 1 |
| Mode SS | |||
|---|---|---|---|
| Quadrant | BADHDUFLAG | Total packets | Discarded packets |
| A | 0 | 86 | 0 |
| B | 0 | 86 | 0 |
| C | 0 | 86 | 0 |
| D | 0 | 86 | 0 |
| Mode M9 | |||
|---|---|---|---|
| Quadrant | BADHDUFLAG | Total packets | Discarded packets |
| A | 0 | 21 | 0 |
| B | 0 | 21 | 0 |
| C | 0 | 21 | 0 |
| D | 0 | 22 | 0 |
| Quadrant | Total seconds | Saturated seconds | Saturation percentage |
|---|---|---|---|
| A | 4145 | 4 | 0.096502% |
| B | 4145 | 10 | 0.241255% |
| C | 4145 | 1 | 0.024125% |
| D | 4145 | 130 | 3.136309% |
Noise dominated data is calculated using 1-second bins in cleaned event files. If a bin has >2000 counts, and if more than 50% of those come from <1% of pixels, then it is considered to be noise-dominated and hence unusable.
| Quadrant | # 1 sec bins | Bins with >0 counts | Bins with >2000 counts | High rate bins dominated by noise | Noise dominated (total time) | Noise dominated (detector-on time) | Marked lightcurve |
|---|---|---|---|---|---|---|---|
| A | 4145 | 4145 | 85 | 85 | 2.05% | 2.05% | 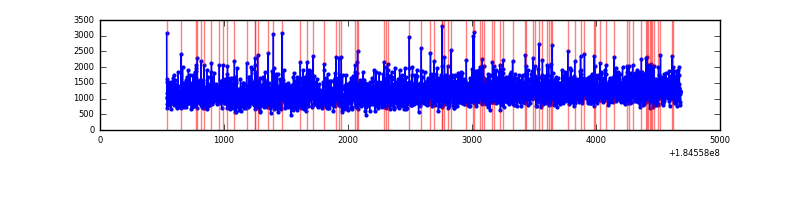 |
| B | 4145 | 4145 | 104 | 104 | 2.51% | 2.51% | 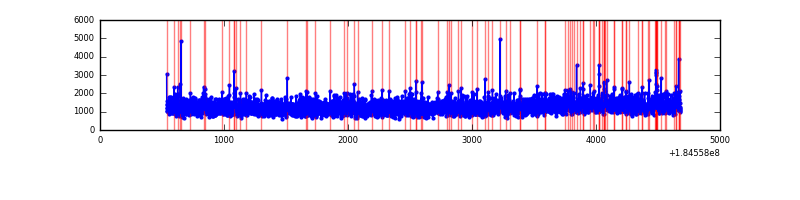 |
| C | 4145 | 4145 | 24 | 24 | 0.58% | 0.58% | 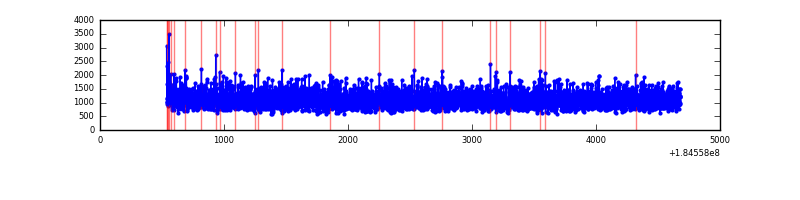 |
| D | 4145 | 4145 | 235 | 235 | 5.67% | 5.67% | 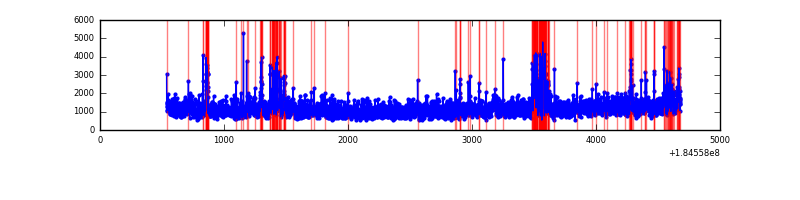 |
Top three noisy pixels from each quadrant. If the there are fewer than three noisy pixels in the level2.evt file, extra rows are filled as -1
| Pixel properties | Quadrant properties | ||||||
|---|---|---|---|---|---|---|---|
| Quadrant | DetID | PixID | Counts | Sigma | Mean | Median | Sigma |
| A | 0 | 149 | 24045 | 80.41 | 1277 | 1270 | 283.2 |
| A | 0 | 238 | 8648 | 26.05 | 1277 | 1270 | 283.2 |
| A | 13 | 190 | 8032 | 23.87 | 1277 | 1270 | 283.2 |
| B | 7 | 221 | 210060 | 697.9 | 1272 | 1285 | 299.1 |
| B | 4 | 250 | 59761 | 195.48 | 1272 | 1285 | 299.1 |
| B | 4 | 206 | 20760 | 65.1 | 1272 | 1285 | 299.1 |
| C | 1 | 1 | 21868 | 64.24 | 1152 | 1191 | 321.9 |
| C | 3 | 159 | 21250 | 62.32 | 1152 | 1191 | 321.9 |
| C | 15 | 241 | 13182 | 37.26 | 1152 | 1191 | 321.9 |
| D | 13 | 37 | 321072 | 922.21 | 1104 | 1147 | 346.9 |
| D | 13 | 216 | 154708 | 442.65 | 1104 | 1147 | 346.9 |
| D | 1 | 4 | 104360 | 297.52 | 1104 | 1147 | 346.9 |
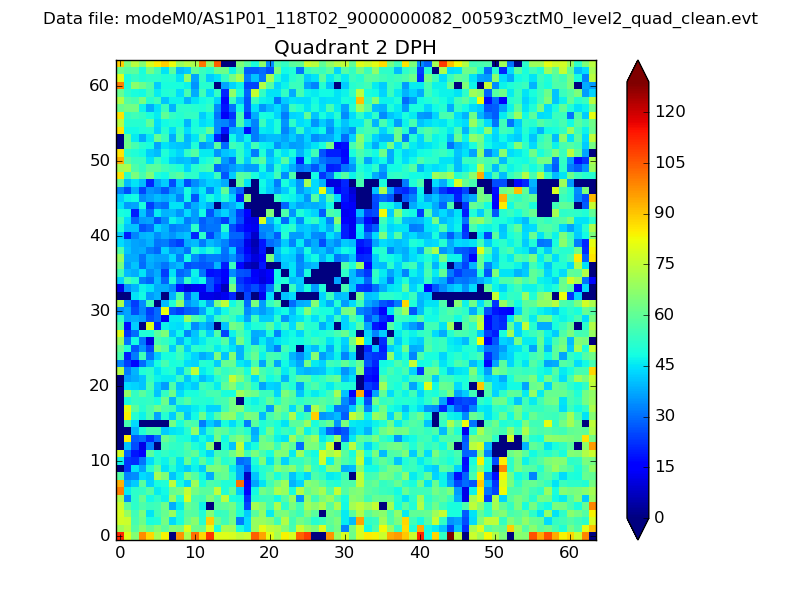
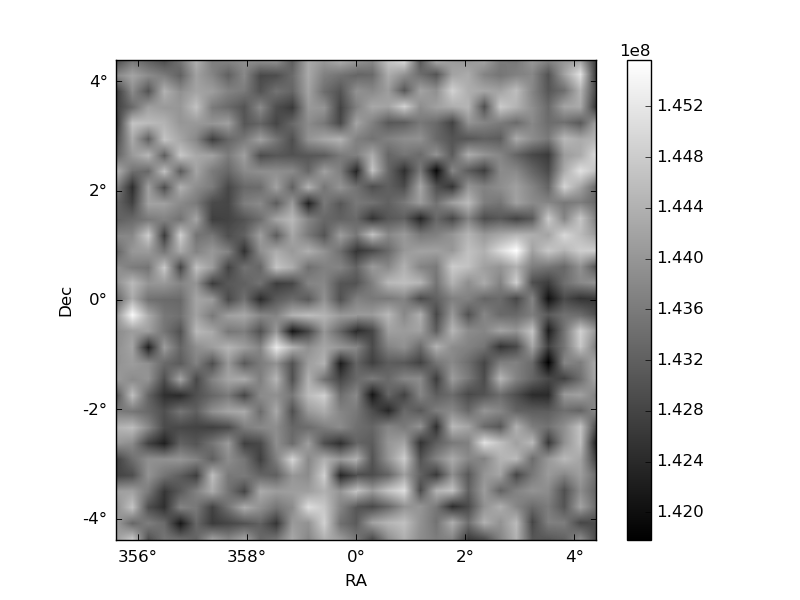
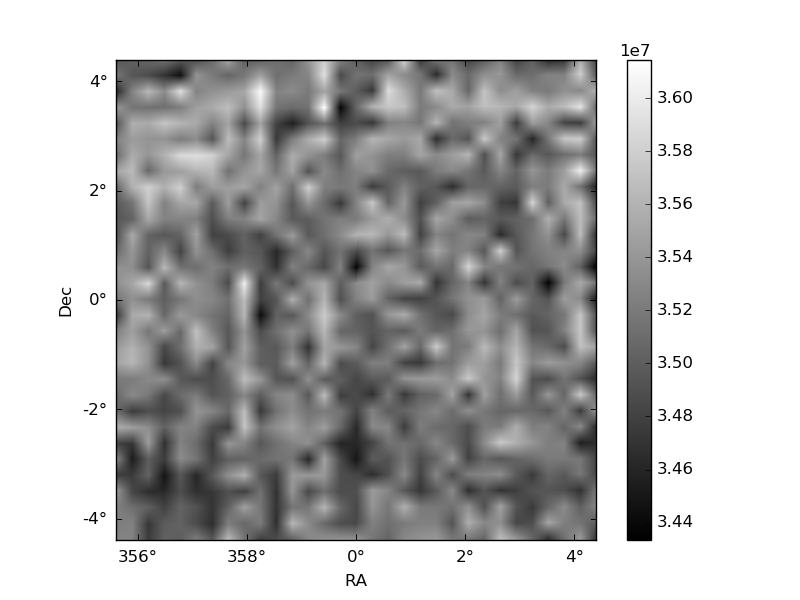
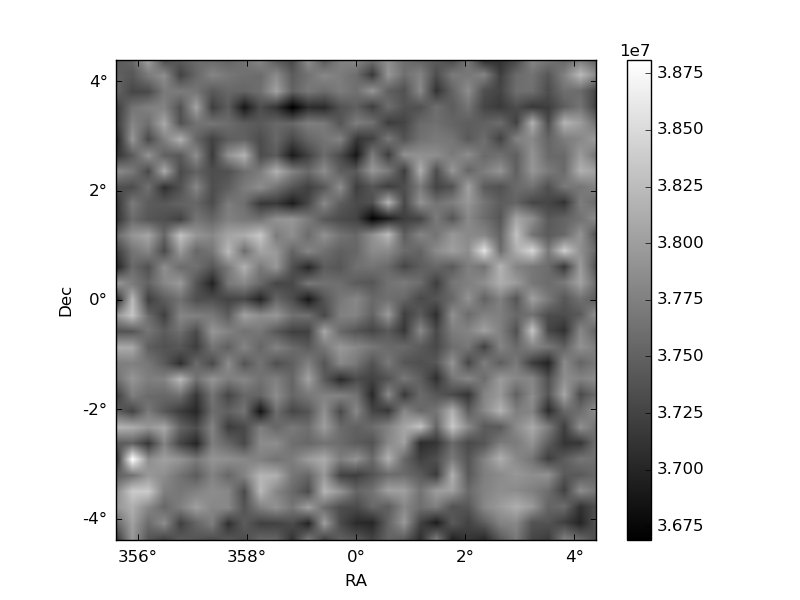
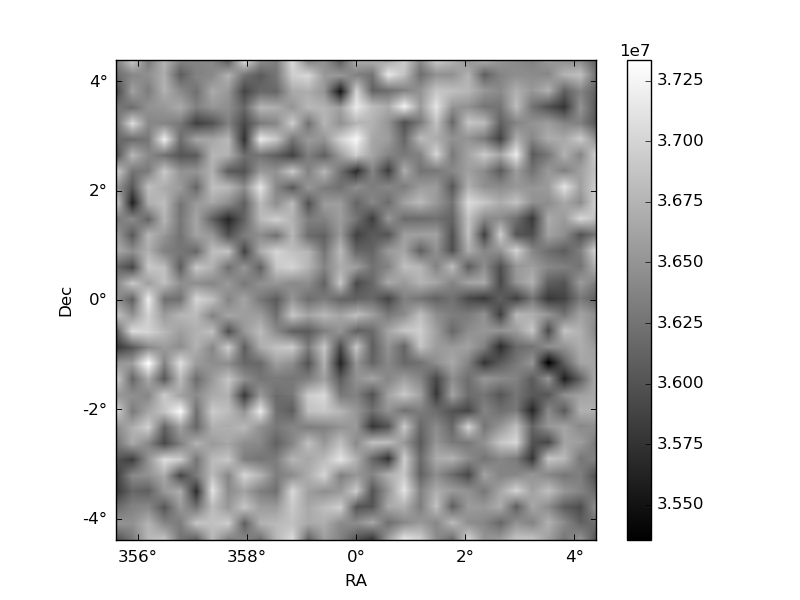
Histogram calculated using DETX and DETY for each event in the final _common_clean file
| Quadrant A | 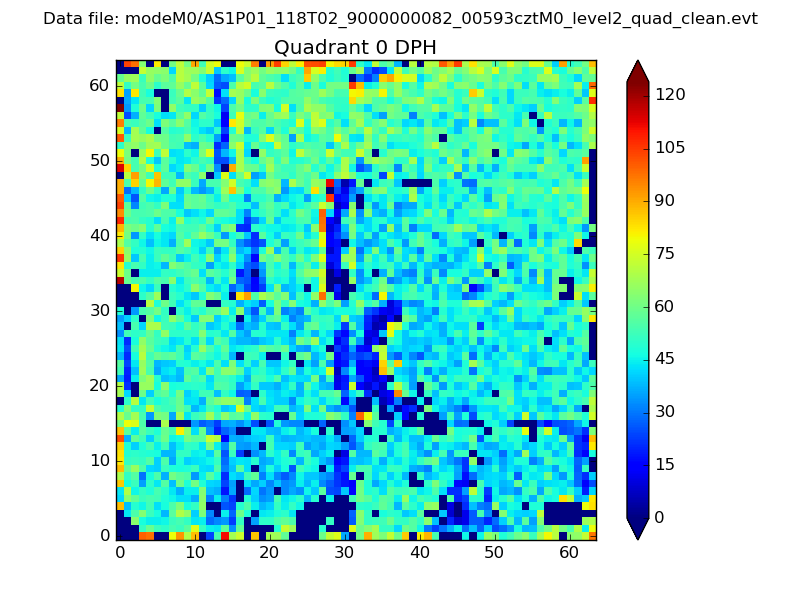 |
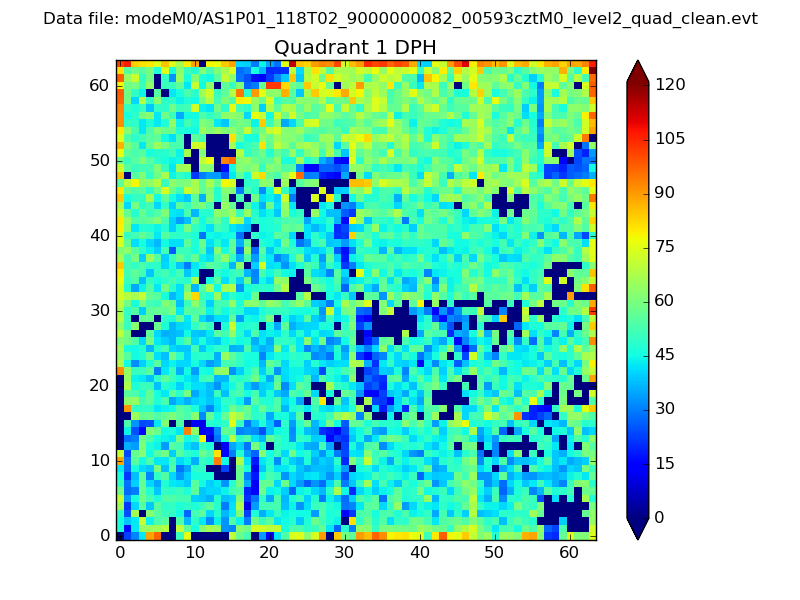 |
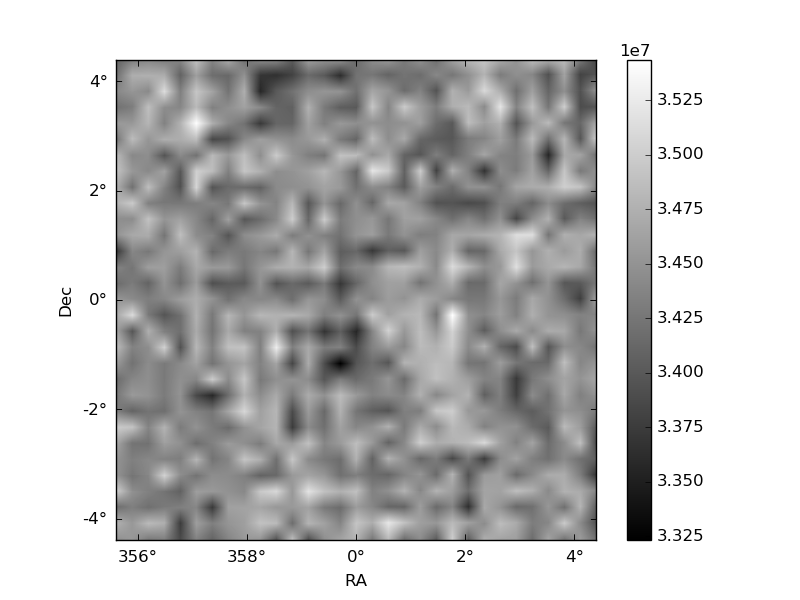
Quadrant B |
|---|---|---|---|
| Quadrant D | 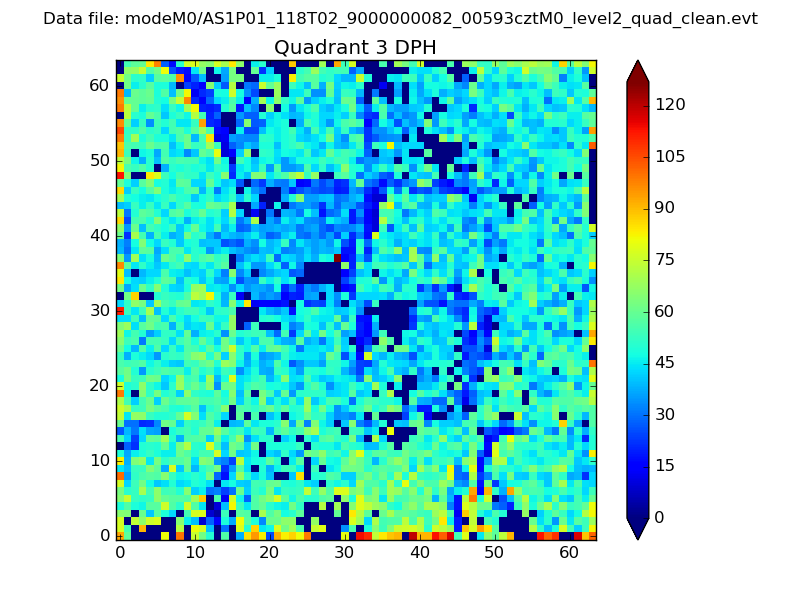 |
 |
Quadrant C |
| Plot type | Count rate plots | Images |
|---|---|---|
| Comparison with Poisson distribution Blue bars denote a histogram of data divided into 1 sec bins. Red curve is a Poisson curve with rate = median count rate of data. |
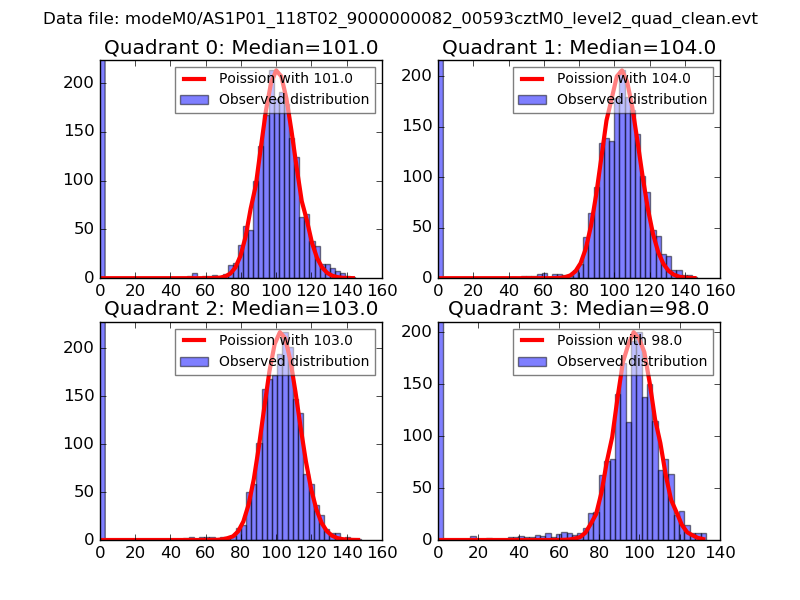 |
 |
| Quadrant-wise count rates Data is divided into 100 sec bins |
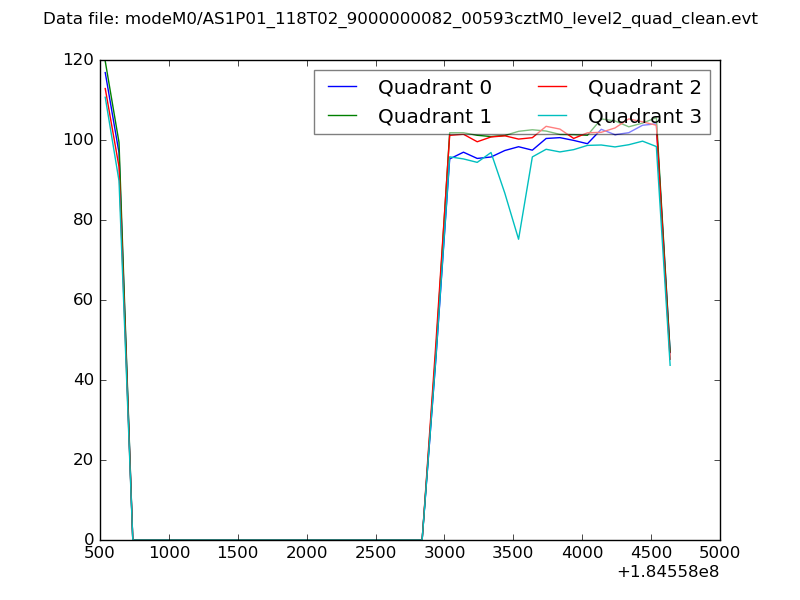 |
|
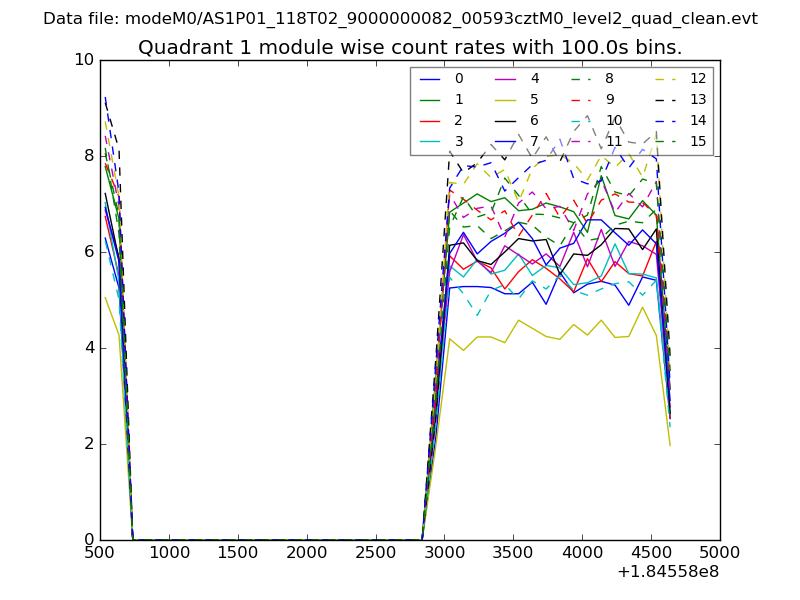
| Module-wise count rates for Quadrant A Data is divided into 100 sec bins |
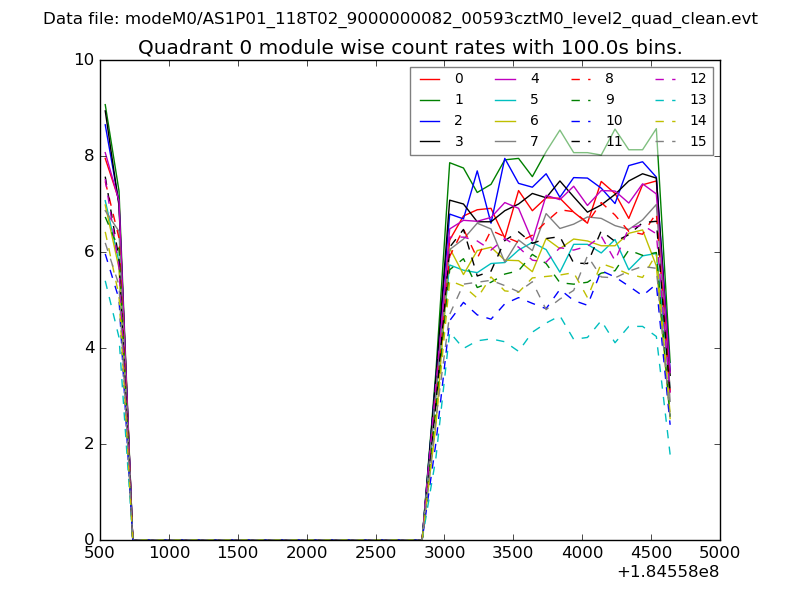 |
 |
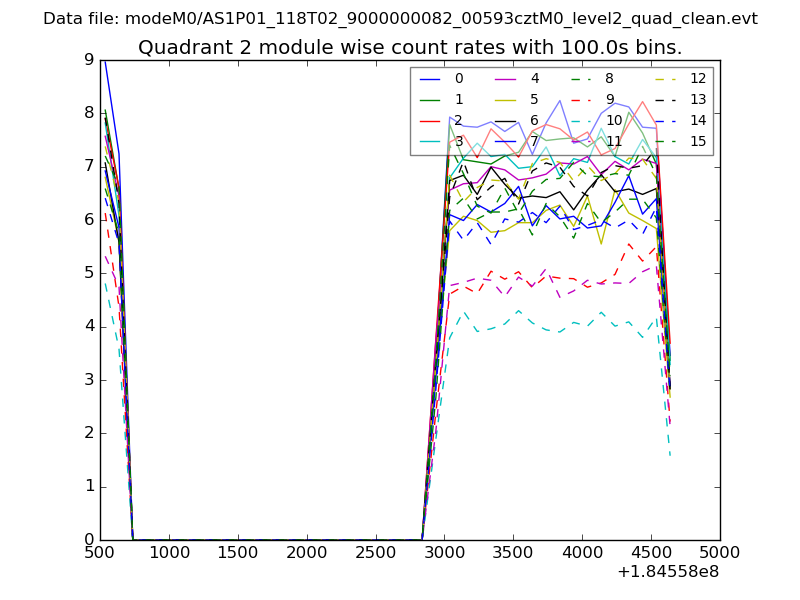
| Module-wise count rates for Quadrant B Data is divided into 100 sec bins |
 |
 |
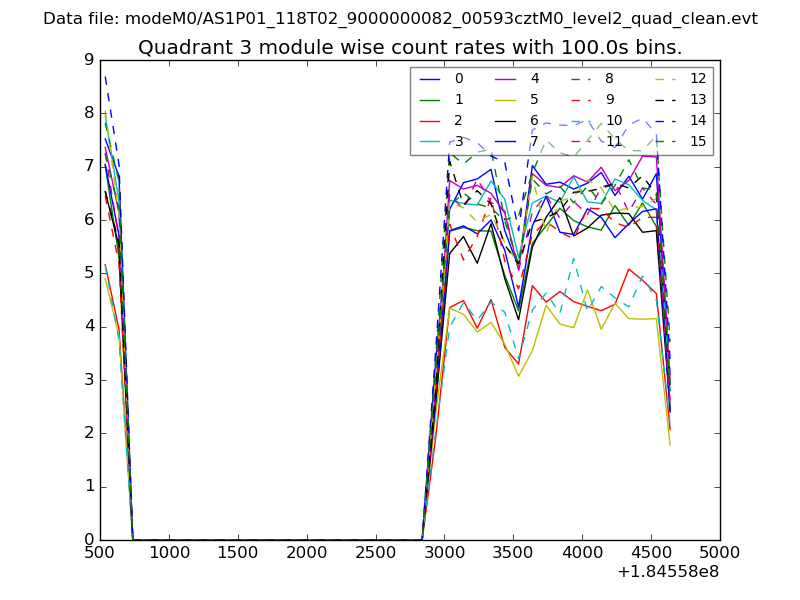
| Module-wise count rates for Quadrant C Data is divided into 100 sec bins |
 |
 |
| Module-wise count rates for Quadrant D Data is divided into 100 sec bins |
 |
 |
| Parameter | Plot |
|---|---|
| CZT HV Monitor | 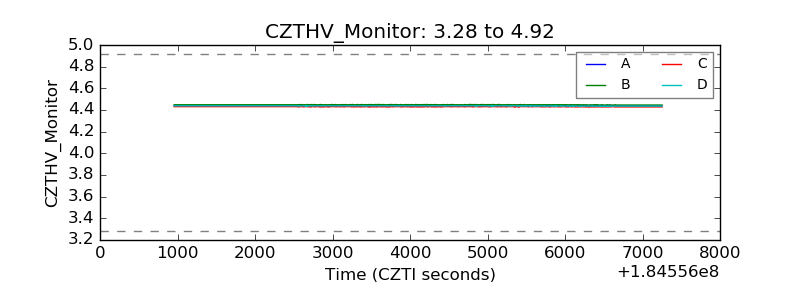 |
| D_VDD | 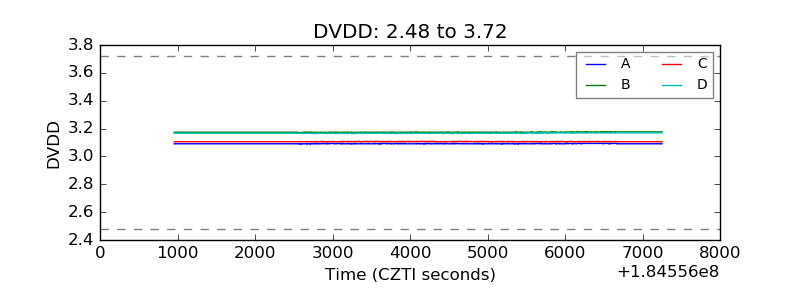 |
| Temperature 1 | 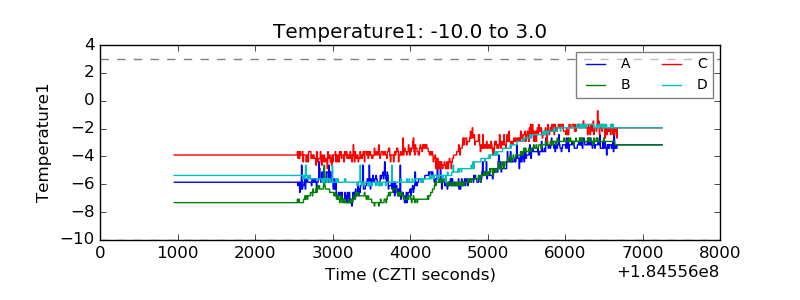 |
| Veto HV Monitor |  |
| Veto LLD | 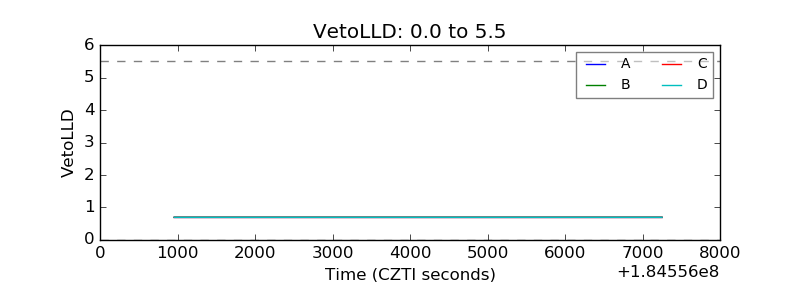 |
| Alpha Counter |  |
| _CPM_Rate | 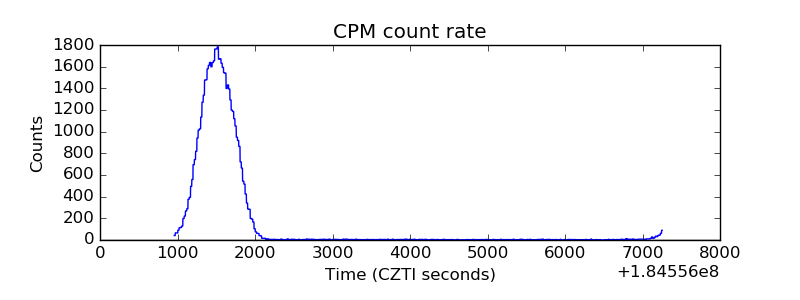 |
| CZT Counter | 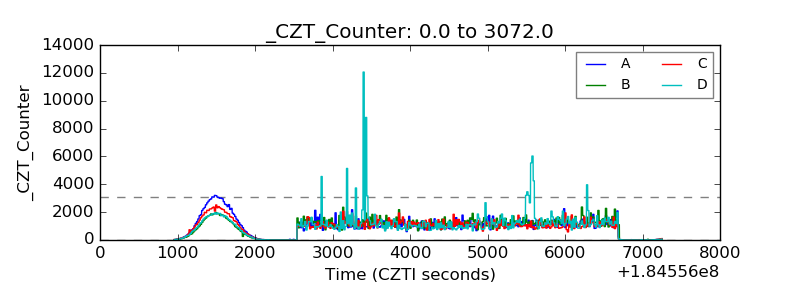 |
| +2.5 Volts monitor |  |
| +5 Volts monitor | 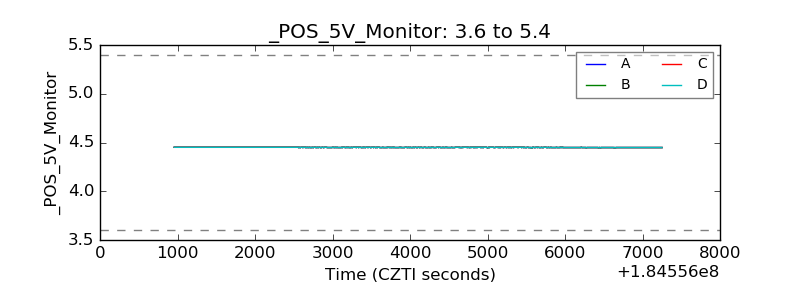 |
| _ROLL_ROT | 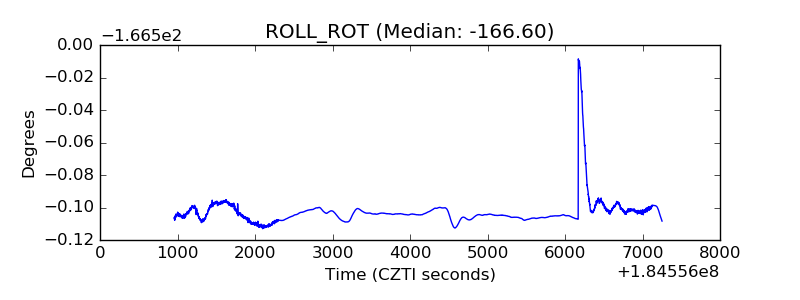 |
| _Roll_DEC | 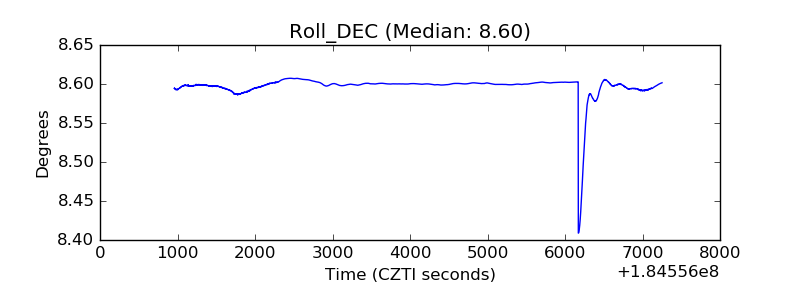 |
| _Roll_RA | 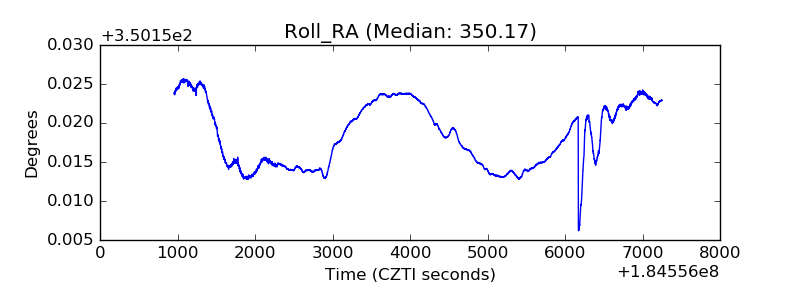 |
| Veto Counter | 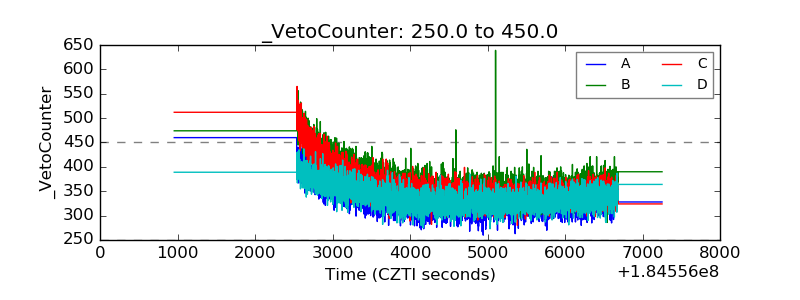 |