| Param | Original file | Final file |
|---|---|---|
| Filename | modeM0/AS1P01_126T01_9000000084cztM0_level2.fits | modeM0/AS1P01_126T01_9000000084cztM0_level2_quad_clean.evt |
| Size (bytes) | 591,615,360 | 789,497,280 |
| Size | 564.2 MB | 752.9 MB |
| Events in quadrant A | 3,295,706 | 4,822,702 |
| Events in quadrant B | 3,349,650 | 4,955,162 |
| Events in quadrant C | 3,322,482 | 4,729,158 |
| Events in quadrant D | 2,808,910 | 4,266,205 |
| Mode M9 | |||
|---|---|---|---|
| Quadrant | BADHDUFLAG | Total packets | Discarded packets |
| A | 0 | 379 | 0 |
| B | 0 | 379 | 0 |
| C | 0 | 379 | 0 |
| D | 0 | 381 | 0 |
| Mode M0 | |||
|---|---|---|---|
| Quadrant | BADHDUFLAG | Total packets | Discarded packets |
| A | 0 | 331805 | 0 |
| B | 0 | 324937 | 0 |
| C | 0 | 296907 | 0 |
| D | 0 | 322371 | 0 |
| Mode SS | |||
|---|---|---|---|
| Quadrant | BADHDUFLAG | Total packets | Discarded packets |
| A | 0 | 1532 | 0 |
| B | 0 | 1532 | 0 |
| C | 0 | 1532 | 0 |
| D | 0 | 1532 | 0 |
| Quadrant | Total seconds | Saturated seconds | Saturation percentage |
|---|---|---|---|
| A | 74953 | 1042 | 1.390205% |
| B | 74953 | 331 | 0.441610% |
| C | 74953 | 105 | 0.140088% |
| D | 74953 | 1284 | 1.713074% |
Noise dominated data is calculated using 1-second bins in cleaned event files. If a bin has >2000 counts, and if more than 50% of those come from <1% of pixels, then it is considered to be noise-dominated and hence unusable.
| Quadrant | # 1 sec bins | Bins with >0 counts | Bins with >2000 counts | High rate bins dominated by noise | Noise dominated (total time) | Noise dominated (detector-on time) | Marked lightcurve |
|---|---|---|---|---|---|---|---|
| A | 117003 | 74950 | 0 | 0 | 0.00% | 0.00% |  |
| B | 117003 | 74948 | 0 | 0 | 0.00% | 0.00% | 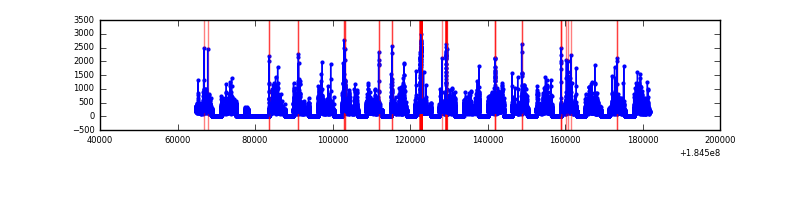 |
| C | 117003 | 74951 | 0 | 0 | 0.00% | 0.00% | 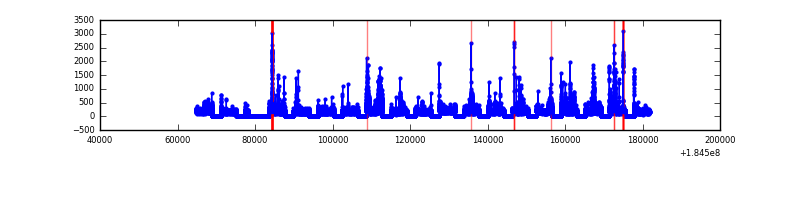 |
| D | 117003 | 74935 | 0 | 0 | 0.00% | 0.00% | 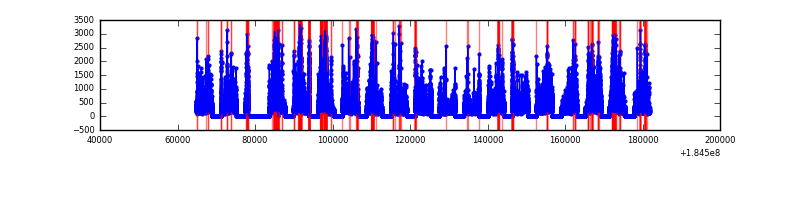 |
Top three noisy pixels from each quadrant. If the there are fewer than three noisy pixels in the level2.evt file, extra rows are filled as -1
| Pixel properties | Quadrant properties | ||||||
|---|---|---|---|---|---|---|---|
| Quadrant | DetID | PixID | Counts | Sigma | Mean | Median | Sigma |
| A | 7 | 110 | 3275 | 12.27 | 856 | 800 | 201.6 |
| A | 0 | 29 | 3004 | 10.93 | 856 | 800 | 201.6 |
| A | 12 | 45 | 2315 | 7.51 | 856 | 800 | 201.6 |
| B | 2 | 9 | 2833 | 13.03 | 883 | 843 | 152.8 |
| B | 2 | 8 | 2228 | 9.07 | 883 | 843 | 152.8 |
| B | 14 | 254 | 2180 | 8.75 | 883 | 843 | 152.8 |
| C | 12 | 241 | 2380 | 7.31 | 878 | 814 | 214.3 |
| C | 2 | 191 | 2358 | 7.2 | 878 | 814 | 214.3 |
| C | 1 | 81 | 2231 | 6.61 | 878 | 814 | 214.3 |
| D | 6 | 44 | 2231 | 7.78 | 801 | 737 | 192.0 |
| D | 11 | 82 | 2107 | 7.14 | 801 | 737 | 192.0 |
| D | 6 | 231 | 2087 | 7.03 | 801 | 737 | 192.0 |
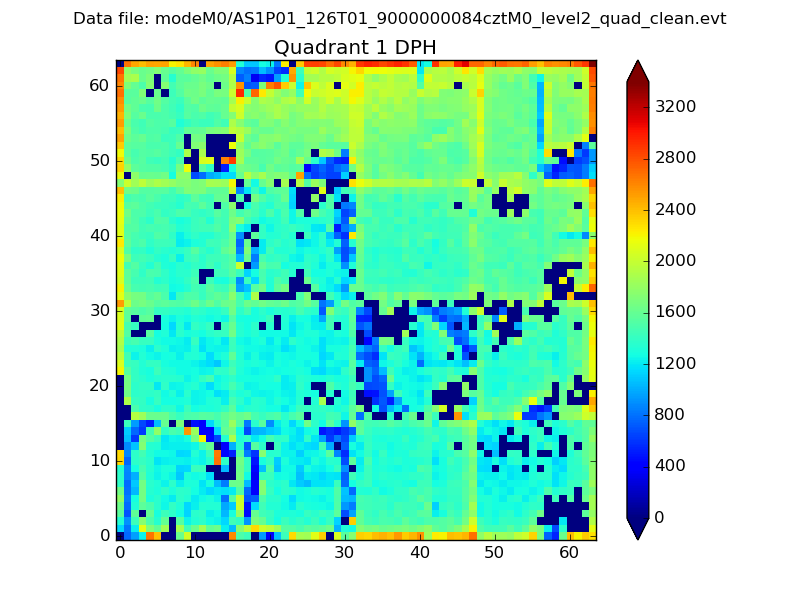
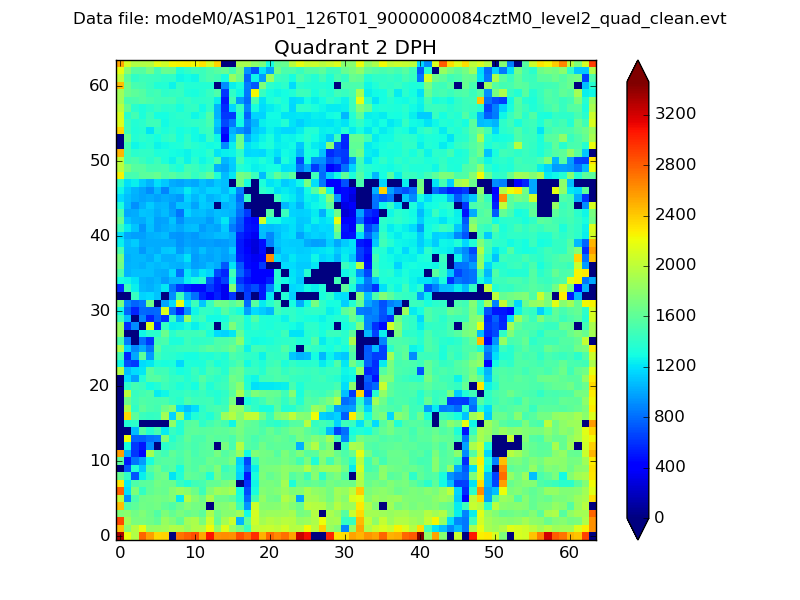
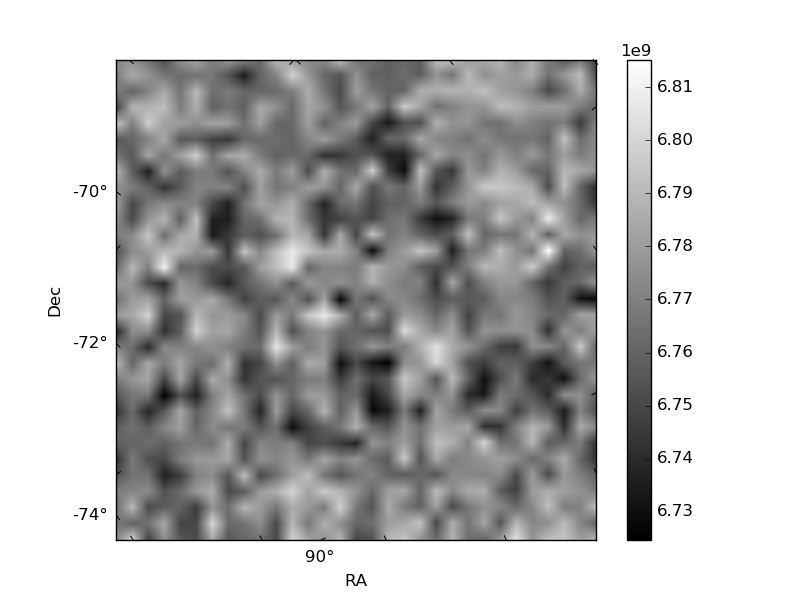
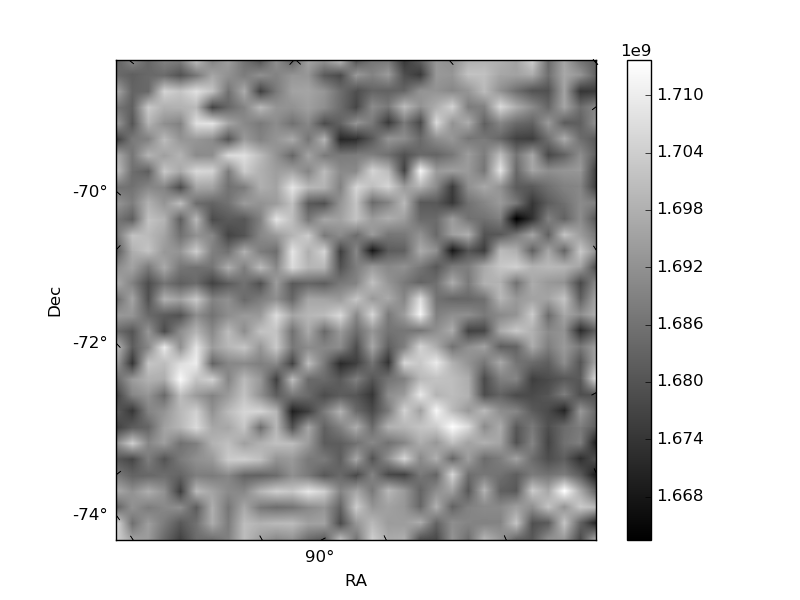
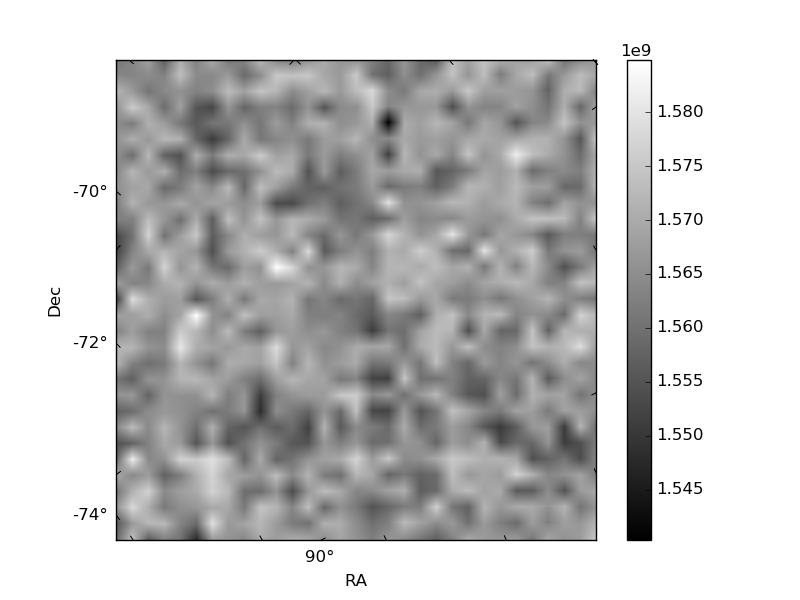
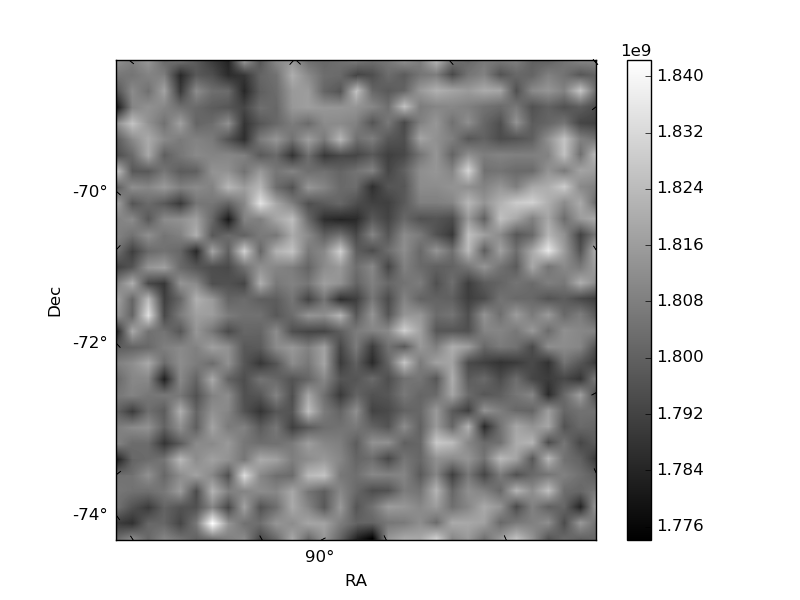
Histogram calculated using DETX and DETY for each event in the final _common_clean file
| Quadrant A | 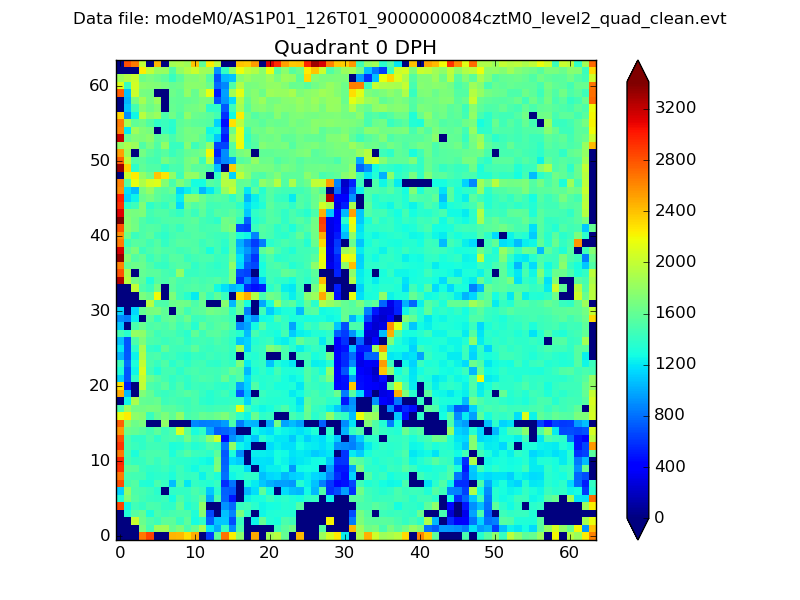 |
 |
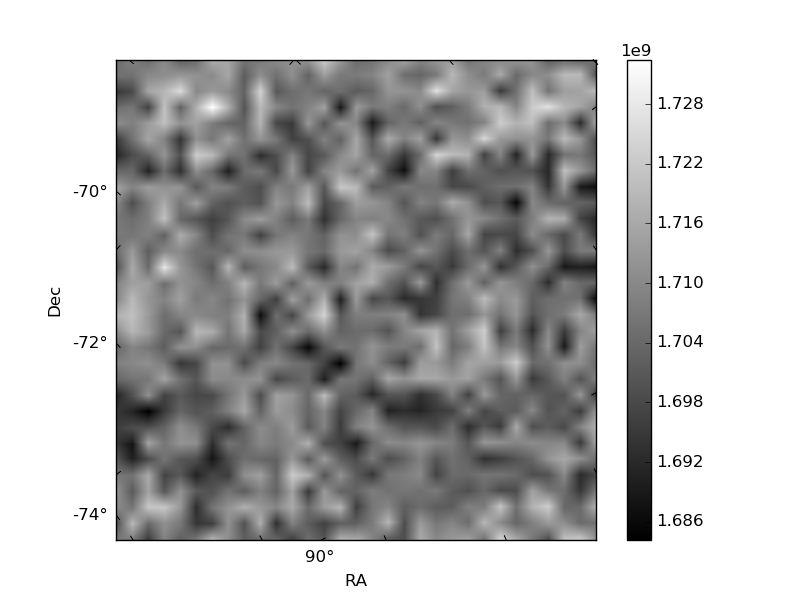
Quadrant B |
|---|---|---|---|
| Quadrant D | 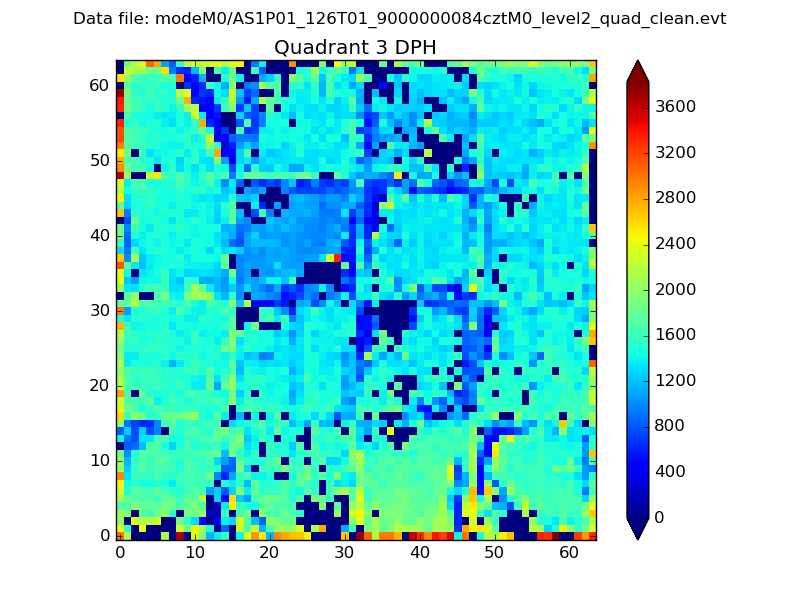 |
 |
Quadrant C |
| Plot type | Count rate plots | Images |
|---|---|---|
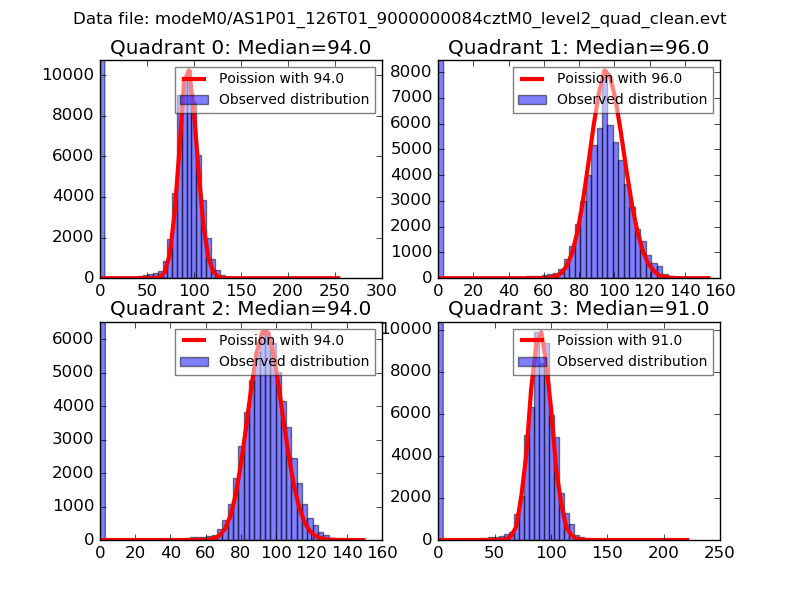
| Comparison with Poisson distribution Blue bars denote a histogram of data divided into 1 sec bins. Red curve is a Poisson curve with rate = median count rate of data. |
 |
 |
| Quadrant-wise count rates Data is divided into 100 sec bins |
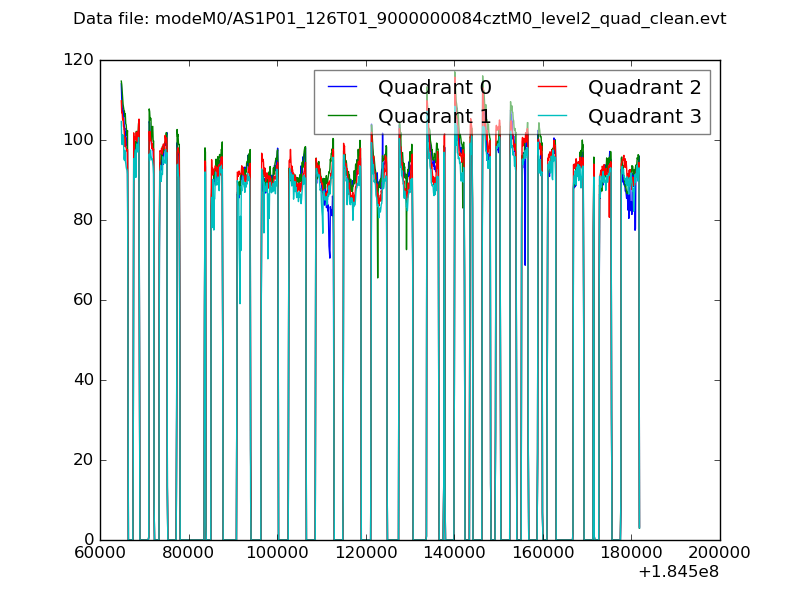 |
|
| Module-wise count rates for Quadrant A Data is divided into 100 sec bins |
 |
 |
| Module-wise count rates for Quadrant B Data is divided into 100 sec bins |
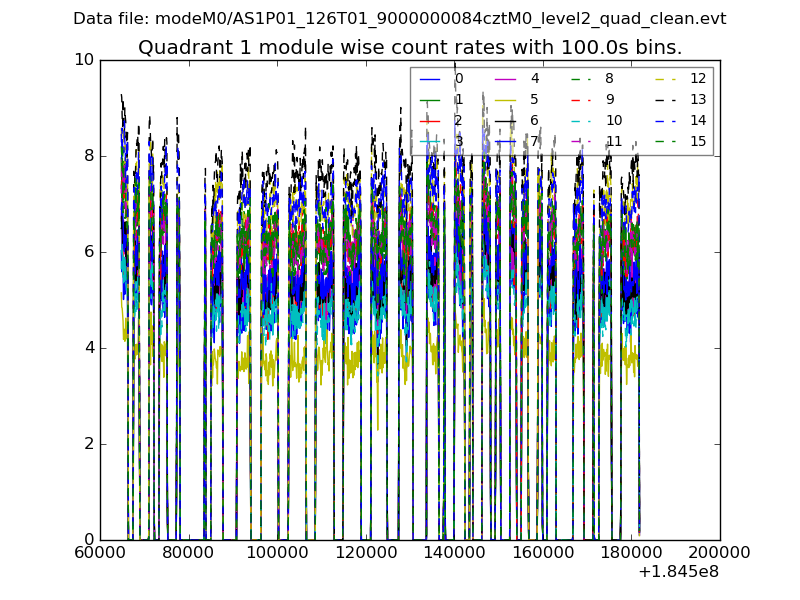 |
 |
| Module-wise count rates for Quadrant C Data is divided into 100 sec bins |
 |
 |
| Module-wise count rates for Quadrant D Data is divided into 100 sec bins |
 |
 |
| Parameter | Plot |
|---|---|
| CZT HV Monitor | 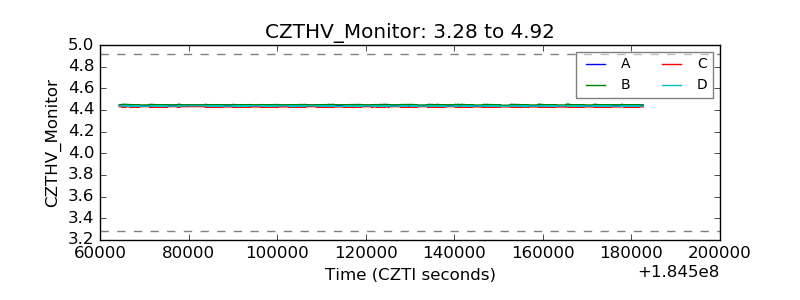 |
| D_VDD | 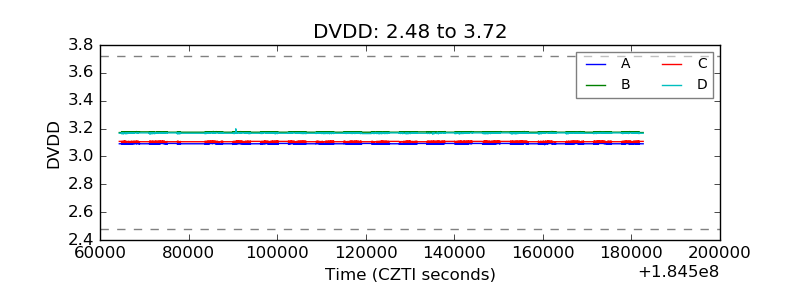 |
| Temperature 1 |  |
| Veto HV Monitor | 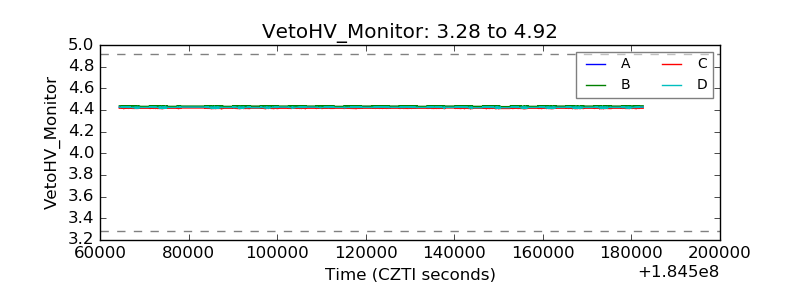 |
| Veto LLD | 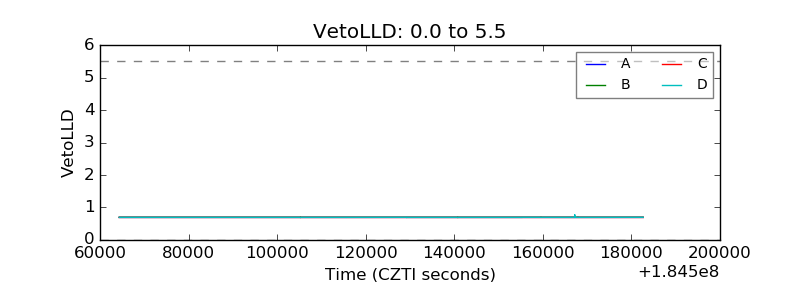 |
| Alpha Counter | 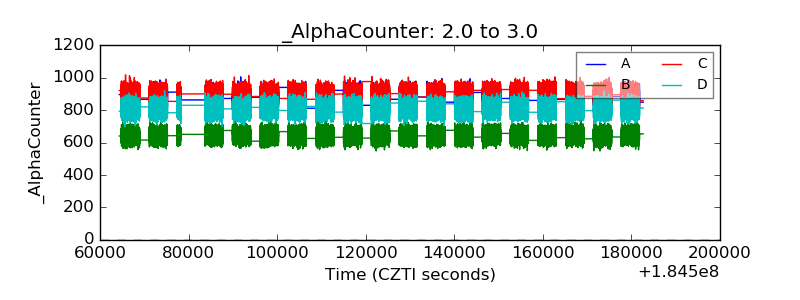 |
| _CPM_Rate | 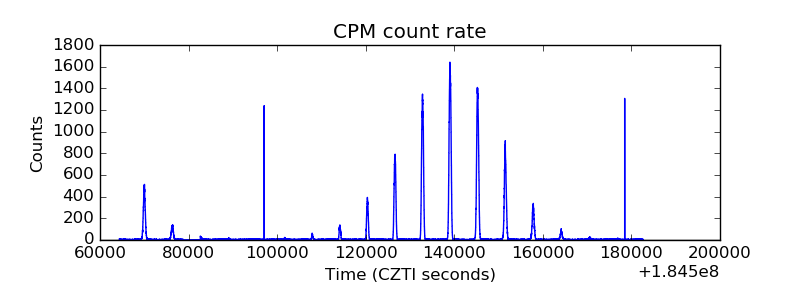 |
| CZT Counter |  |
| +2.5 Volts monitor | 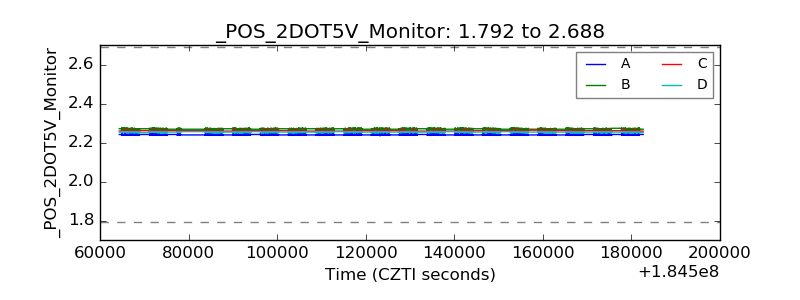 |
| +5 Volts monitor | 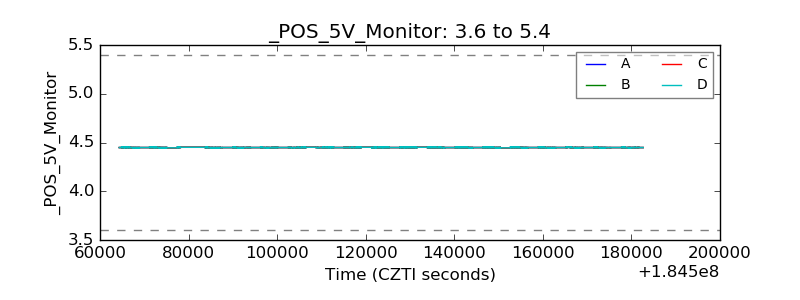 |
| _ROLL_ROT | 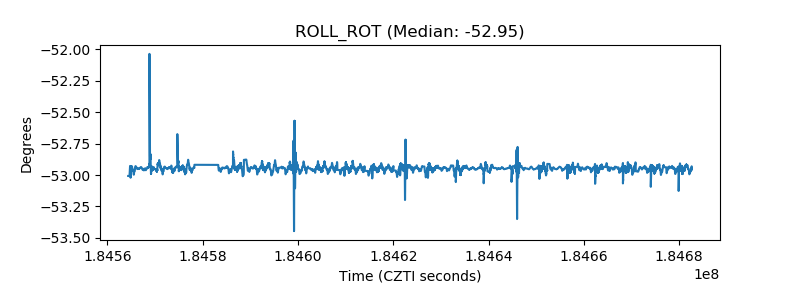 |
| _Roll_DEC | 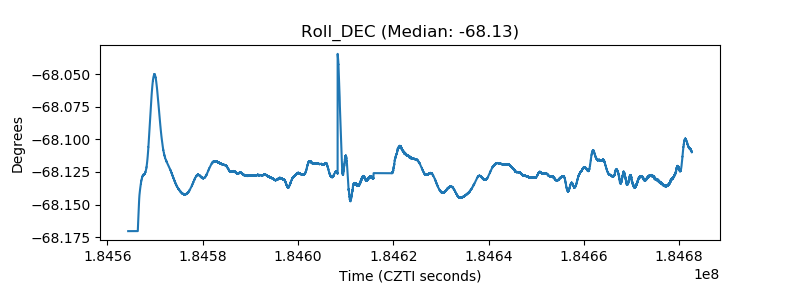 |
| _Roll_RA | 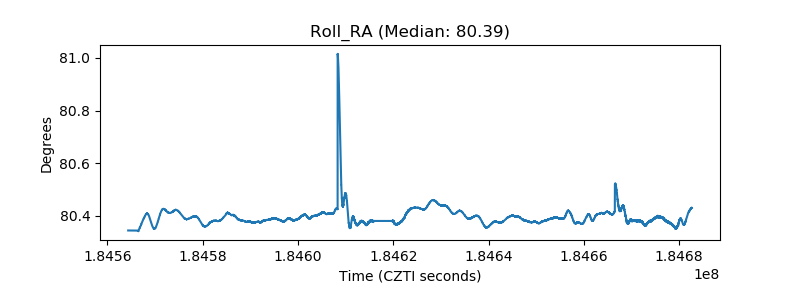 |
| Veto Counter | 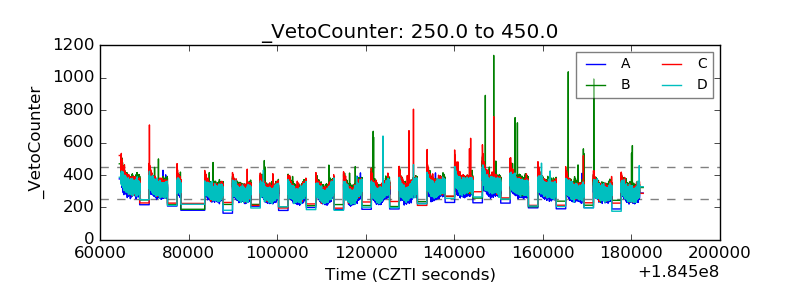 |