| Param | Original file | Final file |
|---|---|---|
| Filename | modeM0/AS1P01_126T01_9000000084_00595cztM0_level2.evt | modeM0/AS1P01_126T01_9000000084_00595cztM0_level2_quad_clean.evt |
| Size (bytes) | 798,943,680 | 57,913,920 |
| Size | 761.9 MB | 55.2 MB |
| Events in quadrant A | 5,967,943 | 351,382 |
| Events in quadrant B | 5,915,125 | 359,840 |
| Events in quadrant C | 5,428,647 | 355,390 |
| Events in quadrant D | 6,554,059 | 338,237 |
| Mode M9 | |||
|---|---|---|---|
| Quadrant | BADHDUFLAG | Total packets | Discarded packets |
| A | 0 | 29 | 0 |
| B | 0 | 29 | 0 |
| C | 0 | 29 | 0 |
| D | 0 | 30 | 0 |
| Mode M0 | |||
|---|---|---|---|
| Quadrant | BADHDUFLAG | Total packets | Discarded packets |
| A | 0 | 21289 | 3 |
| B | 0 | 21088 | 2 |
| C | 0 | 19662 | 2 |
| D | 0 | 23006 | 2 |
| Mode SS | |||
|---|---|---|---|
| Quadrant | BADHDUFLAG | Total packets | Discarded packets |
| A | 0 | 100 | 0 |
| B | 0 | 100 | 0 |
| C | 0 | 100 | 0 |
| D | 0 | 100 | 0 |
| Quadrant | Total seconds | Saturated seconds | Saturation percentage |
|---|---|---|---|
| A | 4972 | 3 | 0.060338% |
| B | 4972 | 4 | 0.080451% |
| C | 4972 | 3 | 0.060338% |
| D | 4972 | 80 | 1.609010% |
Noise dominated data is calculated using 1-second bins in cleaned event files. If a bin has >2000 counts, and if more than 50% of those come from <1% of pixels, then it is considered to be noise-dominated and hence unusable.
| Quadrant | # 1 sec bins | Bins with >0 counts | Bins with >2000 counts | High rate bins dominated by noise | Noise dominated (total time) | Noise dominated (detector-on time) | Marked lightcurve |
|---|---|---|---|---|---|---|---|
| A | 7126 | 4973 | 95 | 95 | 1.33% | 1.91% | 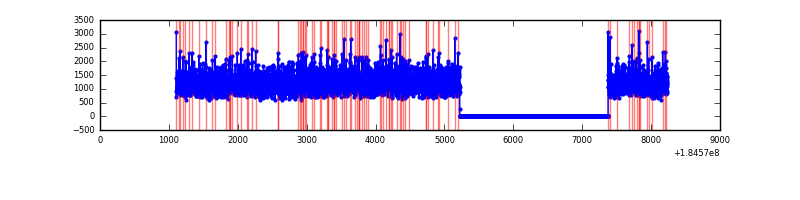 |
| B | 7126 | 4973 | 76 | 76 | 1.07% | 1.53% | 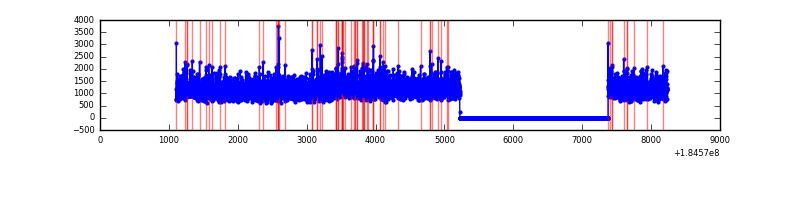 |
| C | 7126 | 4973 | 34 | 34 | 0.48% | 0.68% | 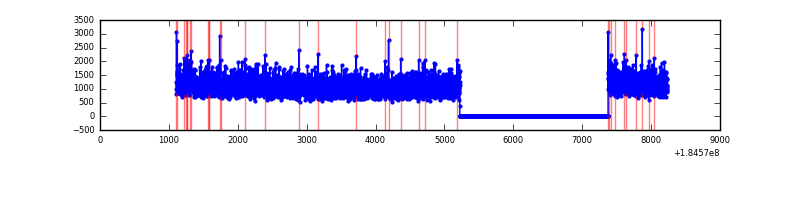 |
| D | 7126 | 4973 | 372 | 372 | 5.22% | 7.48% | 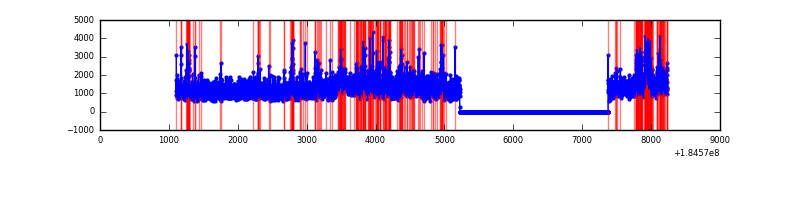 |
Top three noisy pixels from each quadrant. If the there are fewer than three noisy pixels in the level2.evt file, extra rows are filled as -1
| Pixel properties | Quadrant properties | ||||||
|---|---|---|---|---|---|---|---|
| Quadrant | DetID | PixID | Counts | Sigma | Mean | Median | Sigma |
| A | 13 | 160 | 46807 | 134.61 | 1511 | 1490 | 336.6 |
| A | 0 | 238 | 27986 | 78.7 | 1511 | 1490 | 336.6 |
| A | 0 | 69 | 19249 | 52.75 | 1511 | 1490 | 336.6 |
| B | 7 | 221 | 95325 | 265.35 | 1488 | 1495 | 353.6 |
| B | 4 | 250 | 54175 | 148.98 | 1488 | 1495 | 353.6 |
| B | 8 | 54 | 31376 | 84.5 | 1488 | 1495 | 353.6 |
| C | 15 | 241 | 15873 | 37.9 | 1373 | 1419 | 381.4 |
| C | 0 | 221 | 10227 | 23.1 | 1373 | 1419 | 381.4 |
| C | 9 | 83 | 7164 | 15.06 | 1373 | 1419 | 381.4 |
| D | 13 | 216 | 422277 | 1002.57 | 1342 | 1396 | 419.8 |
| D | 1 | 4 | 396685 | 941.61 | 1342 | 1396 | 419.8 |
| D | 13 | 221 | 165515 | 390.94 | 1342 | 1396 | 419.8 |
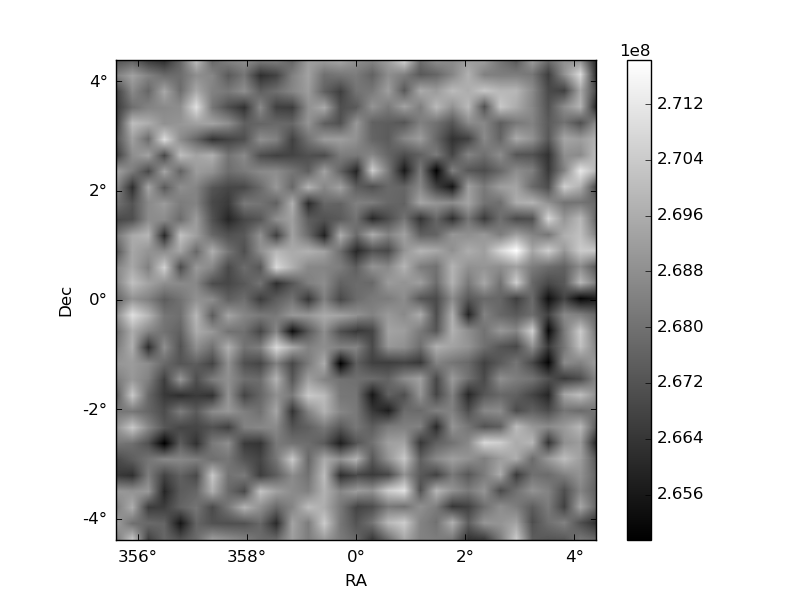
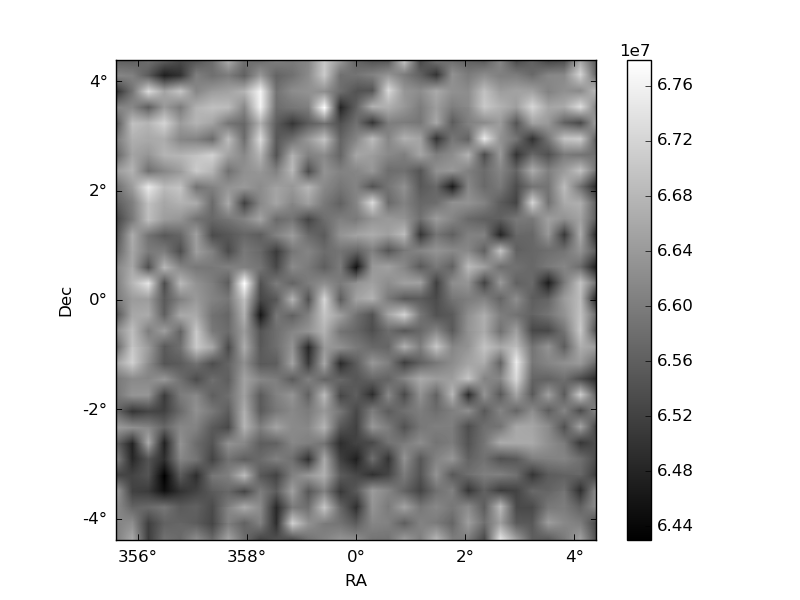
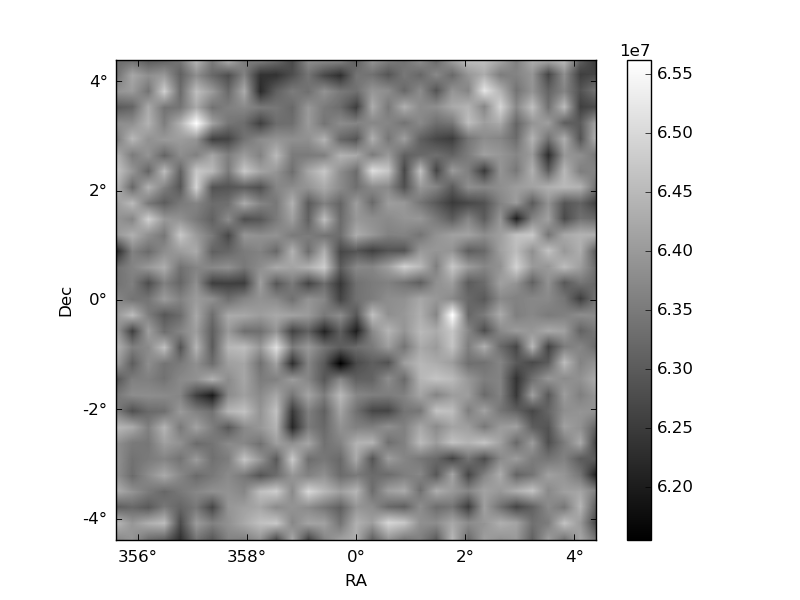
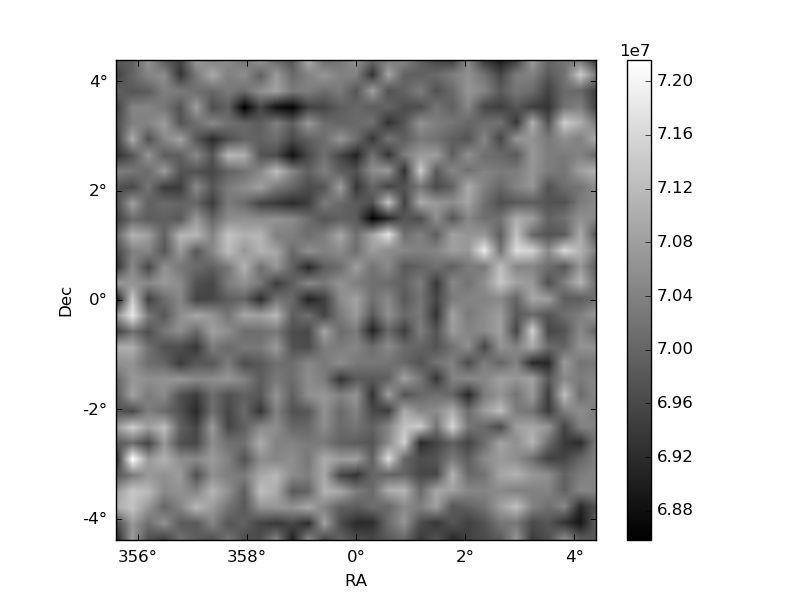
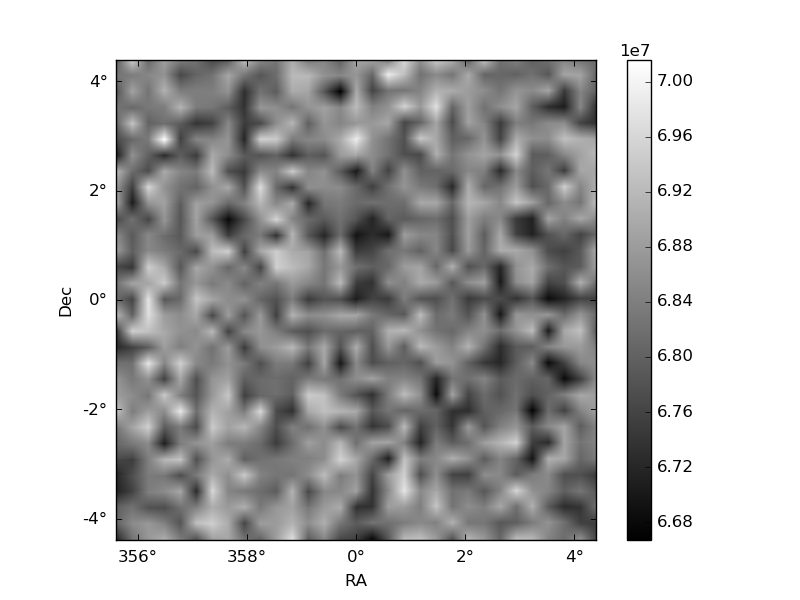
Histogram calculated using DETX and DETY for each event in the final _common_clean file
| Quadrant A | 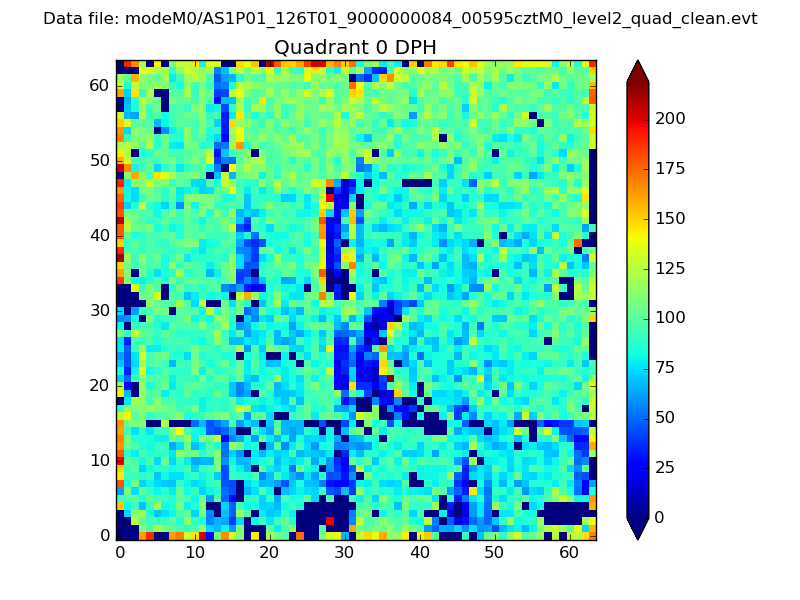 |
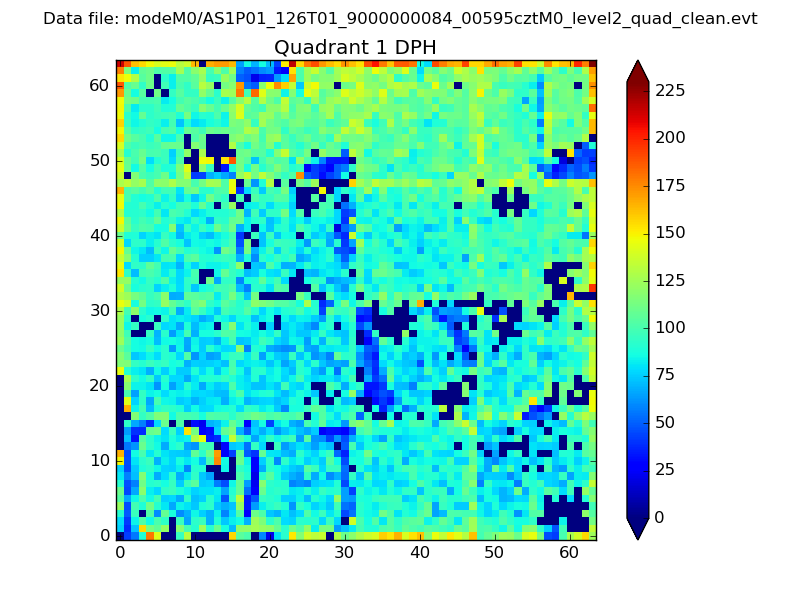 |
Quadrant B |
|---|---|---|---|
| Quadrant D |  |
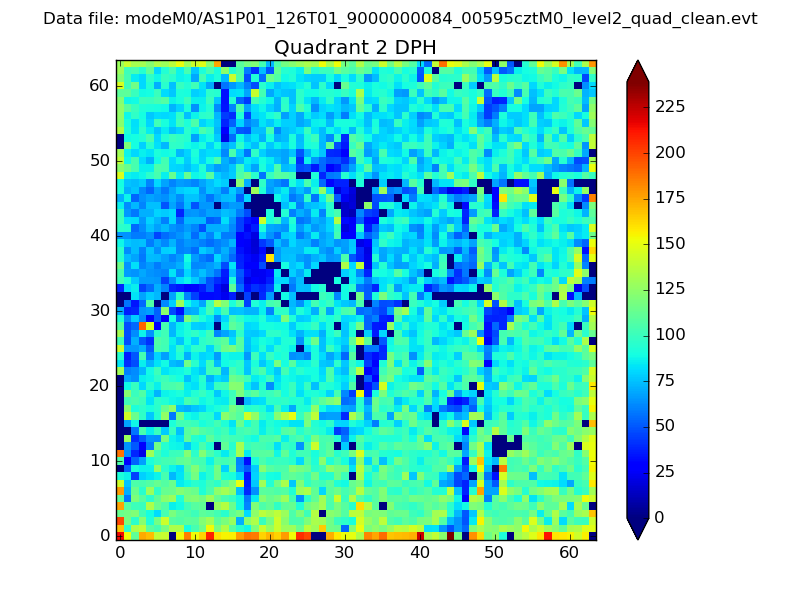 |
Quadrant C |
| Plot type | Count rate plots | Images |
|---|---|---|
| Comparison with Poisson distribution Blue bars denote a histogram of data divided into 1 sec bins. Red curve is a Poisson curve with rate = median count rate of data. |
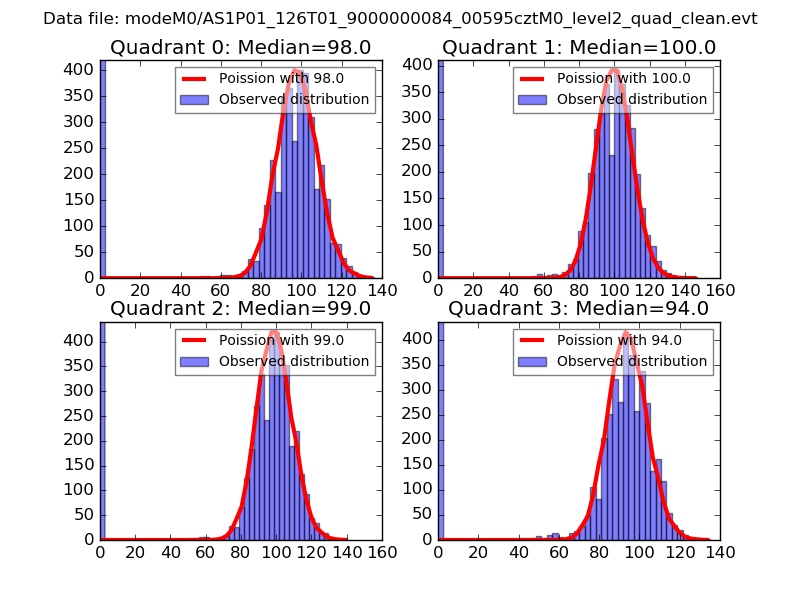 |
 |
| Quadrant-wise count rates Data is divided into 100 sec bins |
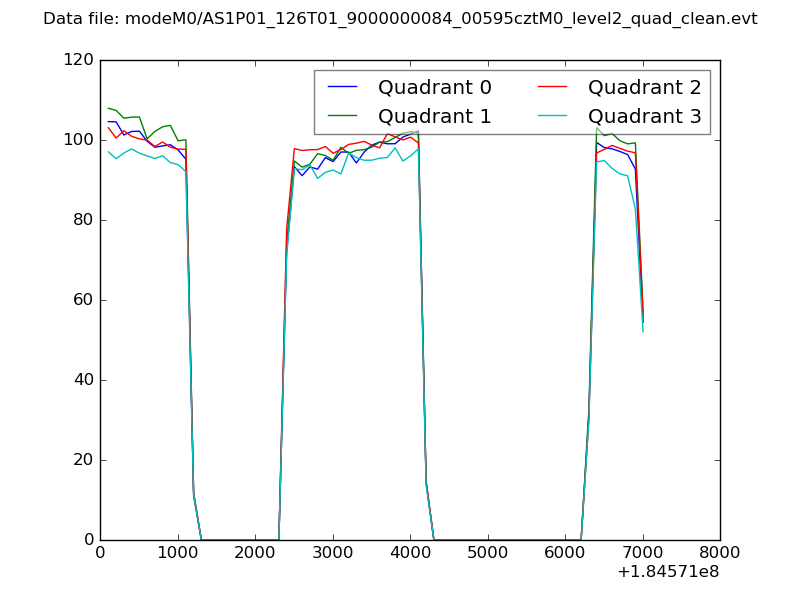 |
|
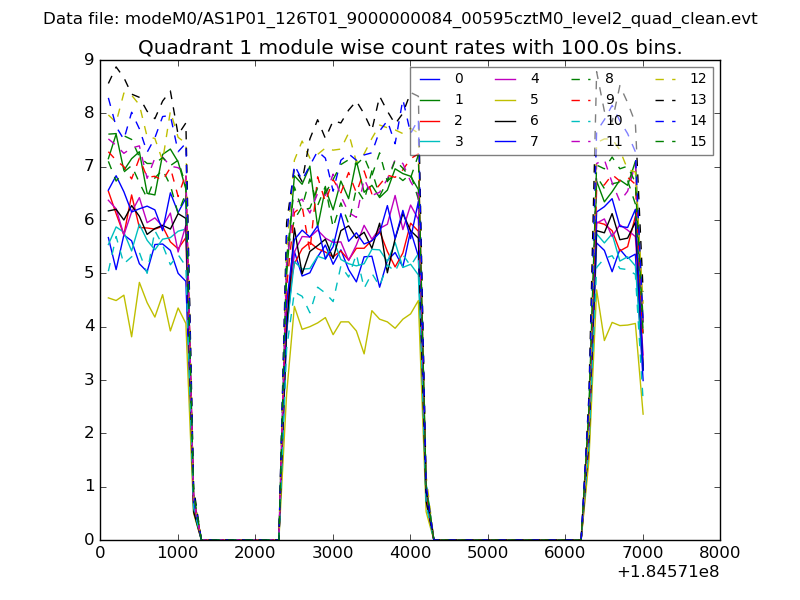
| Module-wise count rates for Quadrant A Data is divided into 100 sec bins |
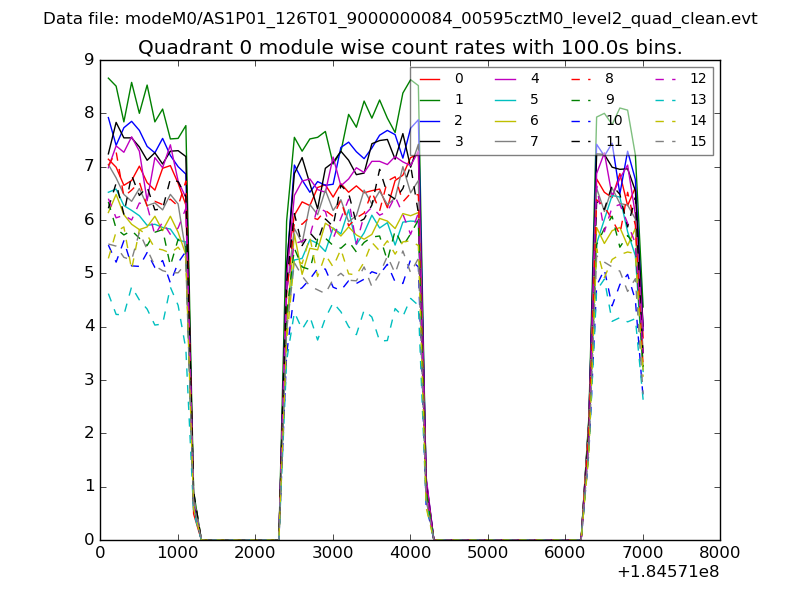 |
 |
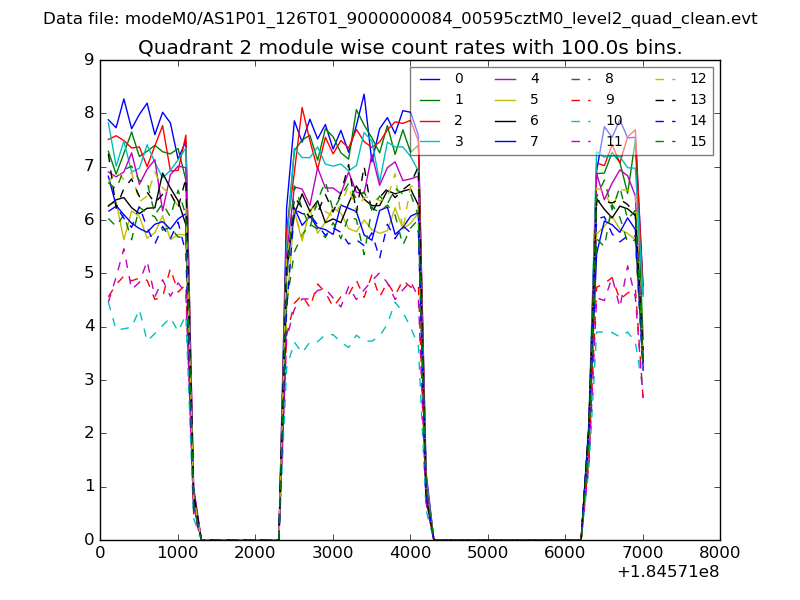
| Module-wise count rates for Quadrant B Data is divided into 100 sec bins |
 |
 |
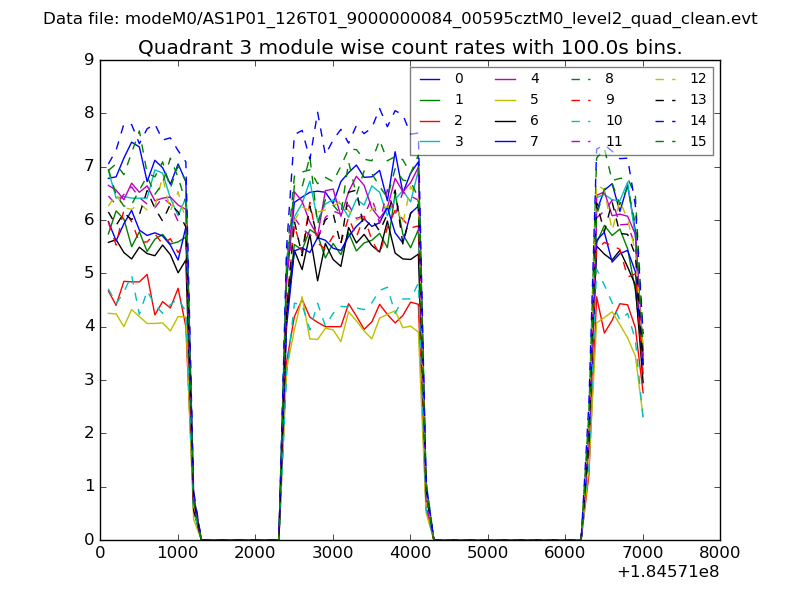
| Module-wise count rates for Quadrant C Data is divided into 100 sec bins |
 |
 |
| Module-wise count rates for Quadrant D Data is divided into 100 sec bins |
 |
 |
| Parameter | Plot |
|---|---|
| CZT HV Monitor | 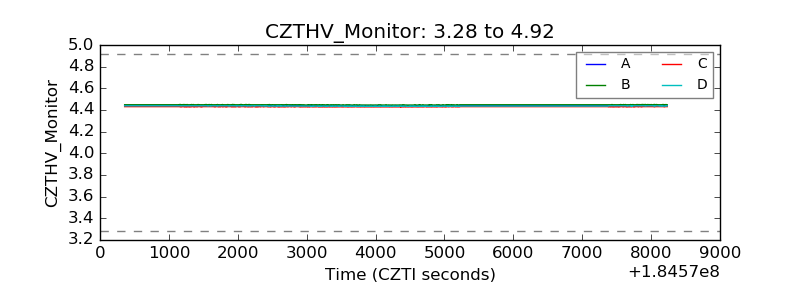 |
| D_VDD | 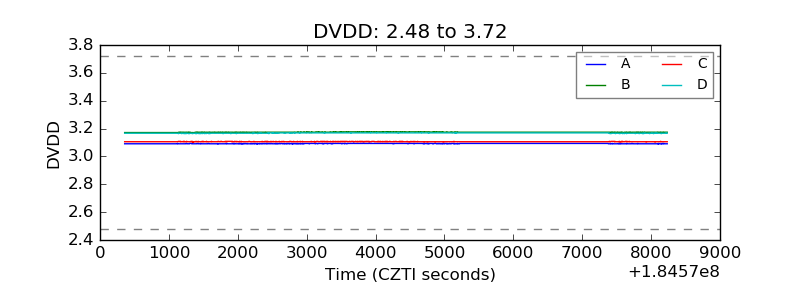 |
| Temperature 1 | 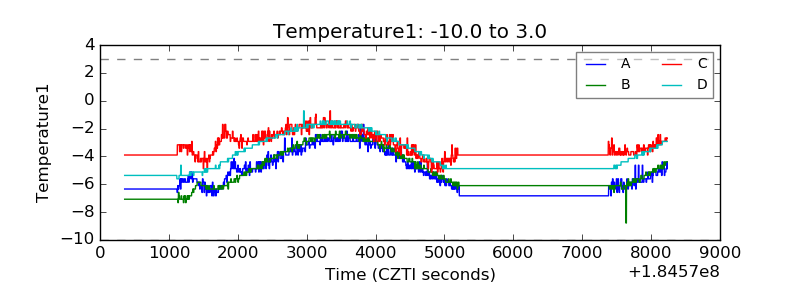 |
| Veto HV Monitor | 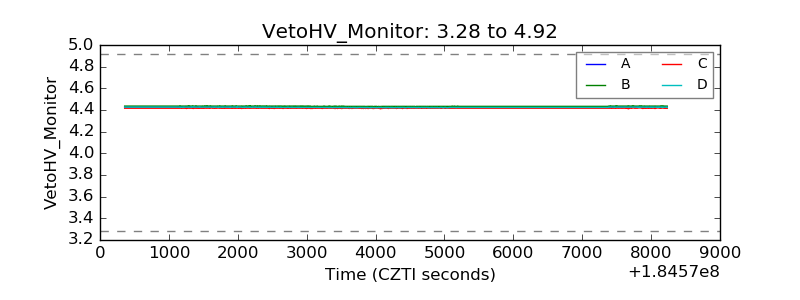 |
| Veto LLD | 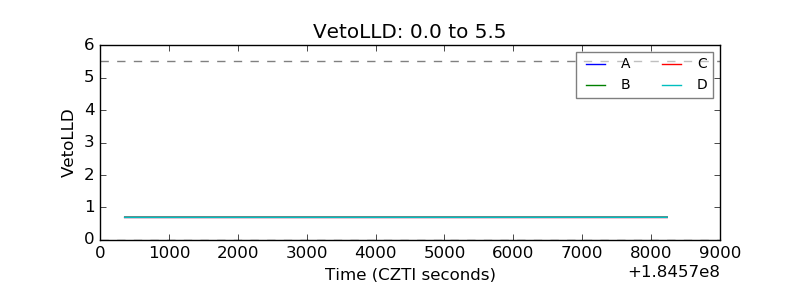 |
| Alpha Counter | 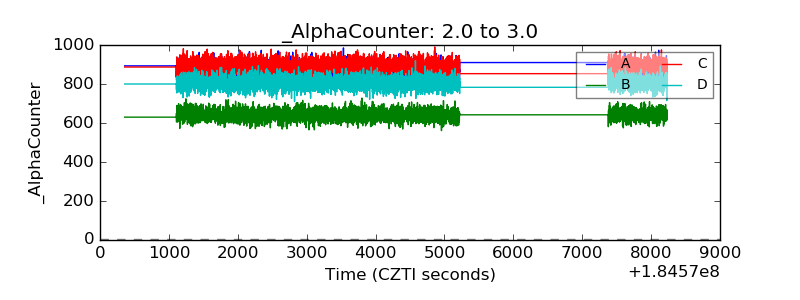 |
| _CPM_Rate | 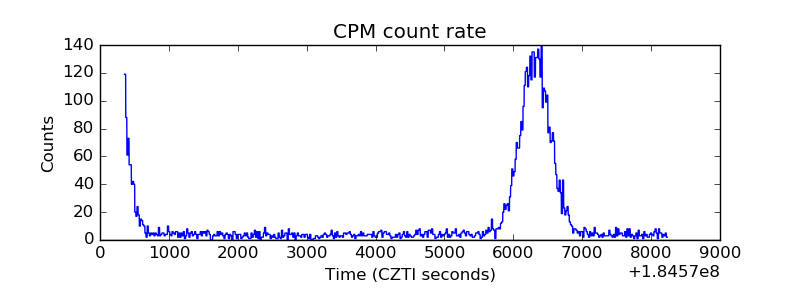 |
| CZT Counter | 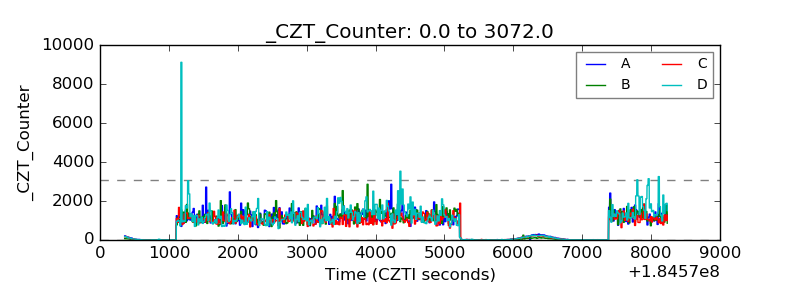 |
| +2.5 Volts monitor |  |
| +5 Volts monitor |  |
| _ROLL_ROT | 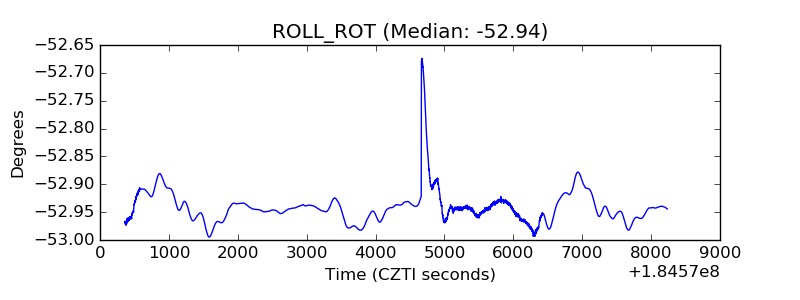 |
| _Roll_DEC | 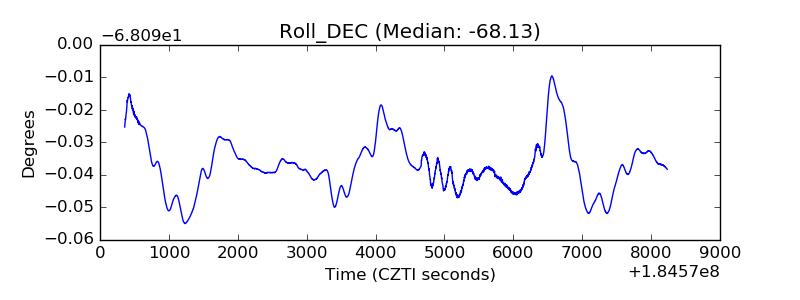 |
| _Roll_RA | 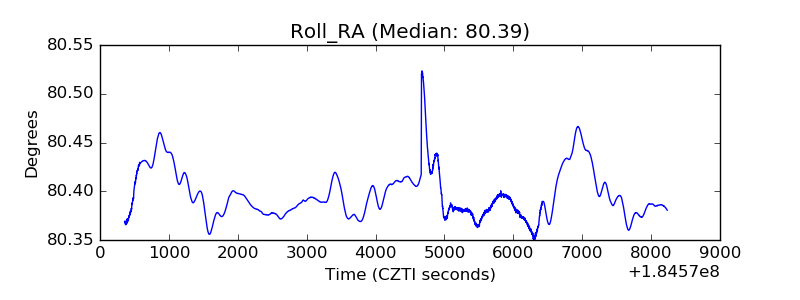 |
| Veto Counter | 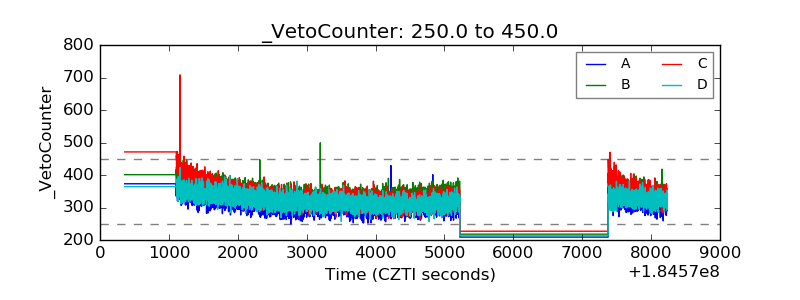 |