| Param | Original file | Final file |
|---|---|---|
| Filename | modeM0/AS1P01_126T01_9000000084_00597cztM0_level2.evt | modeM0/AS1P01_126T01_9000000084_00597cztM0_level2_quad_clean.evt |
| Size (bytes) | 819,270,720 | 47,076,480 |
| Size | 781.3 MB | 44.9 MB |
| Events in quadrant A | 6,072,087 | 269,883 |
| Events in quadrant B | 6,226,514 | 273,271 |
| Events in quadrant C | 5,389,818 | 272,352 |
| Events in quadrant D | 6,791,389 | 259,120 |
| Mode M9 | |||
|---|---|---|---|
| Quadrant | BADHDUFLAG | Total packets | Discarded packets |
| A | 0 | 24 | 0 |
| B | 0 | 24 | 0 |
| C | 0 | 24 | 0 |
| D | 0 | 25 | 0 |
| Mode M0 | |||
|---|---|---|---|
| Quadrant | BADHDUFLAG | Total packets | Discarded packets |
| A | 0 | 21600 | 3 |
| B | 0 | 22071 | 2 |
| C | 0 | 19580 | 2 |
| D | 0 | 23755 | 2 |
| Mode SS | |||
|---|---|---|---|
| Quadrant | BADHDUFLAG | Total packets | Discarded packets |
| A | 0 | 104 | 0 |
| B | 0 | 104 | 0 |
| C | 0 | 104 | 0 |
| D | 0 | 104 | 0 |
| Quadrant | Total seconds | Saturated seconds | Saturation percentage |
|---|---|---|---|
| A | 4987 | 4 | 0.080209% |
| B | 4987 | 10 | 0.200521% |
| C | 4987 | 31 | 0.621616% |
| D | 4987 | 202 | 4.050531% |
Noise dominated data is calculated using 1-second bins in cleaned event files. If a bin has >2000 counts, and if more than 50% of those come from <1% of pixels, then it is considered to be noise-dominated and hence unusable.
| Quadrant | # 1 sec bins | Bins with >0 counts | Bins with >2000 counts | High rate bins dominated by noise | Noise dominated (total time) | Noise dominated (detector-on time) | Marked lightcurve |
|---|---|---|---|---|---|---|---|
| A | 7143 | 4988 | 130 | 130 | 1.82% | 2.61% | 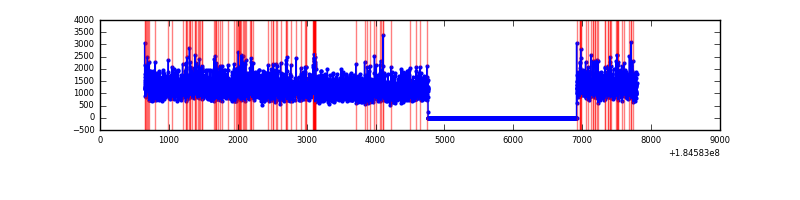 |
| B | 7143 | 4988 | 139 | 139 | 1.95% | 2.79% | 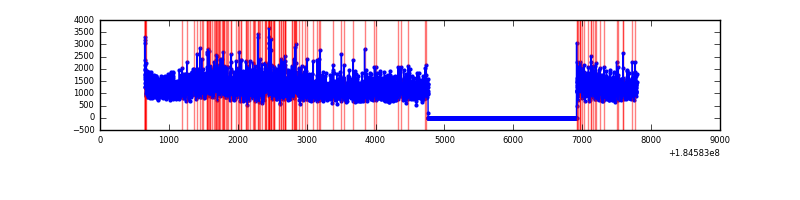 |
| C | 7143 | 4988 | 79 | 79 | 1.11% | 1.58% | 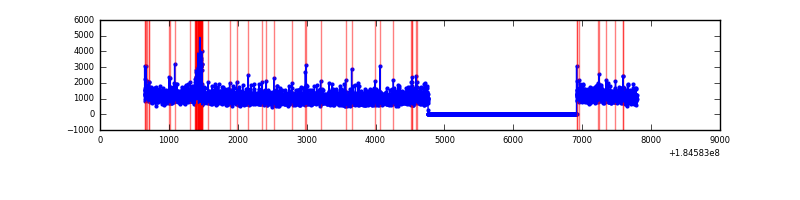 |
| D | 7143 | 4988 | 527 | 527 | 7.38% | 10.57% | 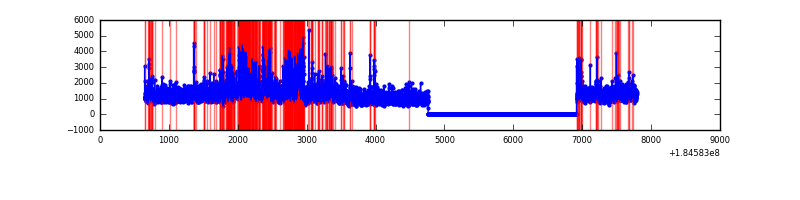 |
Top three noisy pixels from each quadrant. If the there are fewer than three noisy pixels in the level2.evt file, extra rows are filled as -1
| Pixel properties | Quadrant properties | ||||||
|---|---|---|---|---|---|---|---|
| Quadrant | DetID | PixID | Counts | Sigma | Mean | Median | Sigma |
| A | 13 | 160 | 55886 | 158.82 | 1521 | 1499 | 342.4 |
| A | 0 | 238 | 32793 | 91.39 | 1521 | 1499 | 342.4 |
| A | 15 | 249 | 26962 | 74.36 | 1521 | 1499 | 342.4 |
| B | 7 | 221 | 330234 | 925.78 | 1494 | 1502 | 355.1 |
| B | 8 | 38 | 68892 | 189.78 | 1494 | 1502 | 355.1 |
| B | 4 | 250 | 44922 | 122.28 | 1494 | 1502 | 355.1 |
| C | 3 | 159 | 140947 | 378.34 | 1327 | 1373 | 368.9 |
| C | 15 | 241 | 17156 | 42.78 | 1327 | 1373 | 368.9 |
| C | 5 | 249 | 9607 | 22.32 | 1327 | 1373 | 368.9 |
| D | 12 | 237 | 869794 | 2197.62 | 1329 | 1366 | 395.2 |
| D | 1 | 4 | 273990 | 689.9 | 1329 | 1366 | 395.2 |
| D | 13 | 221 | 190785 | 479.34 | 1329 | 1366 | 395.2 |
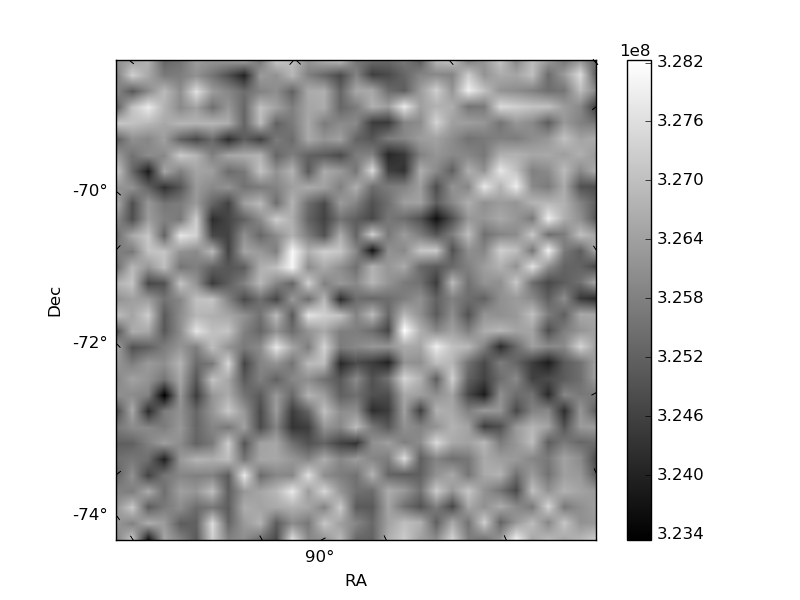
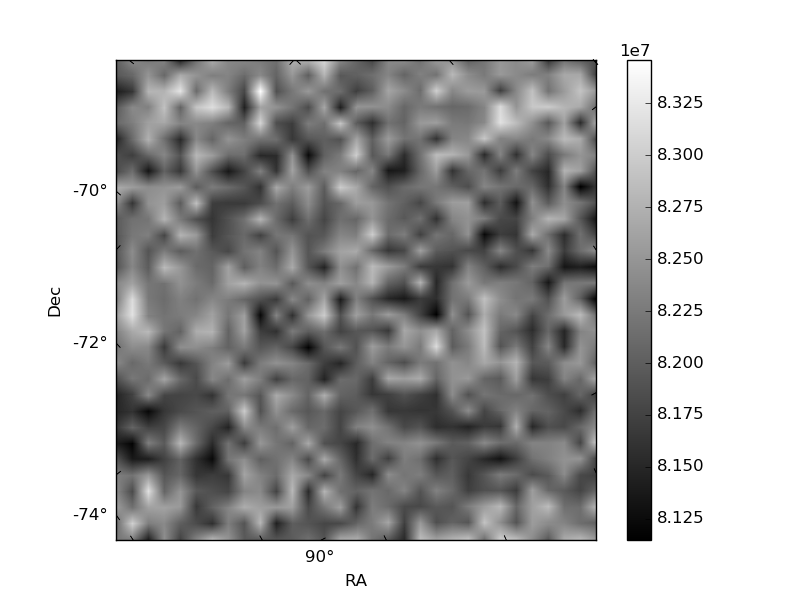
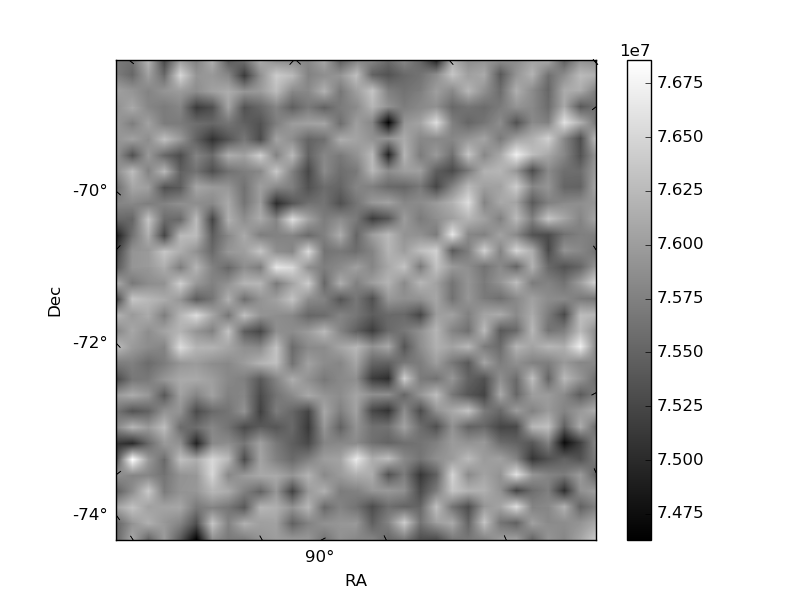
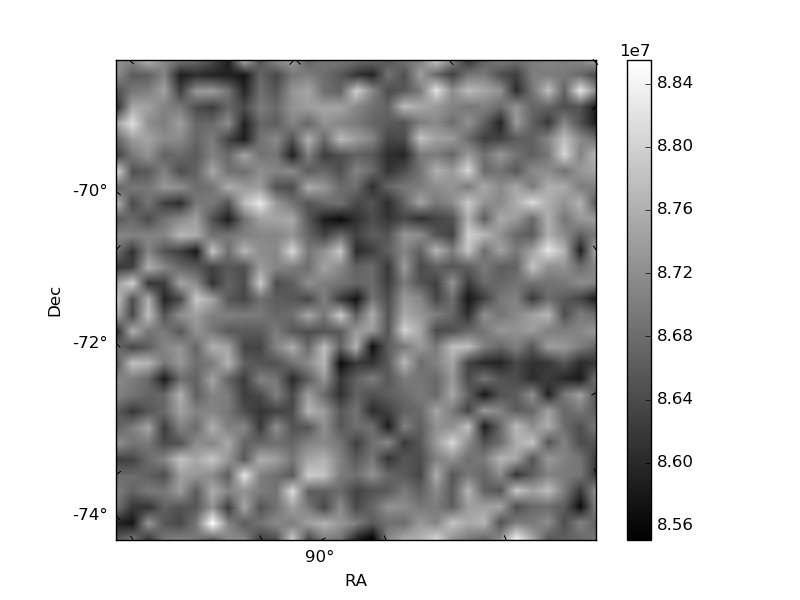
Histogram calculated using DETX and DETY for each event in the final _common_clean file
| Quadrant A | 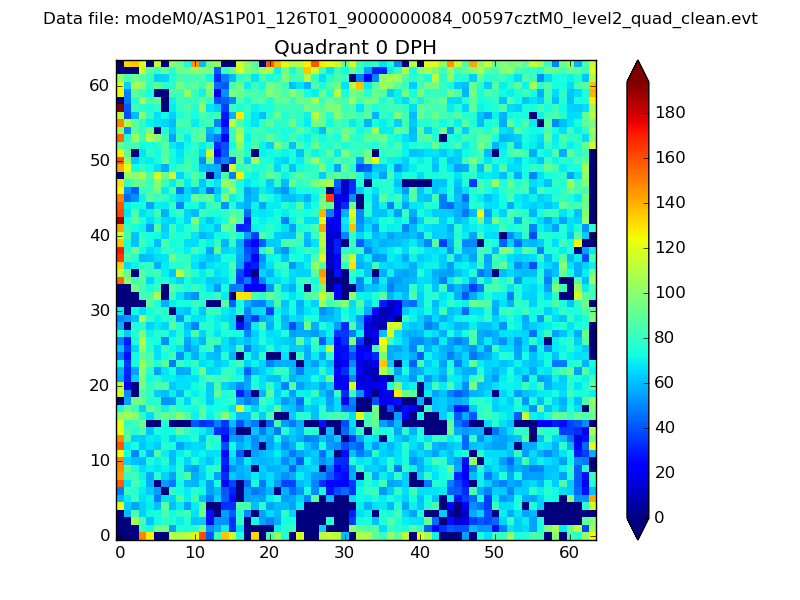 |
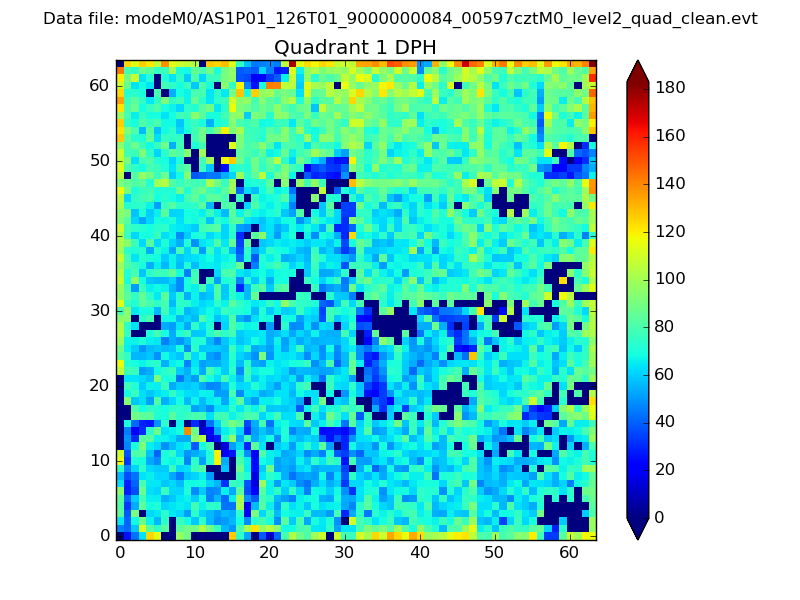 |
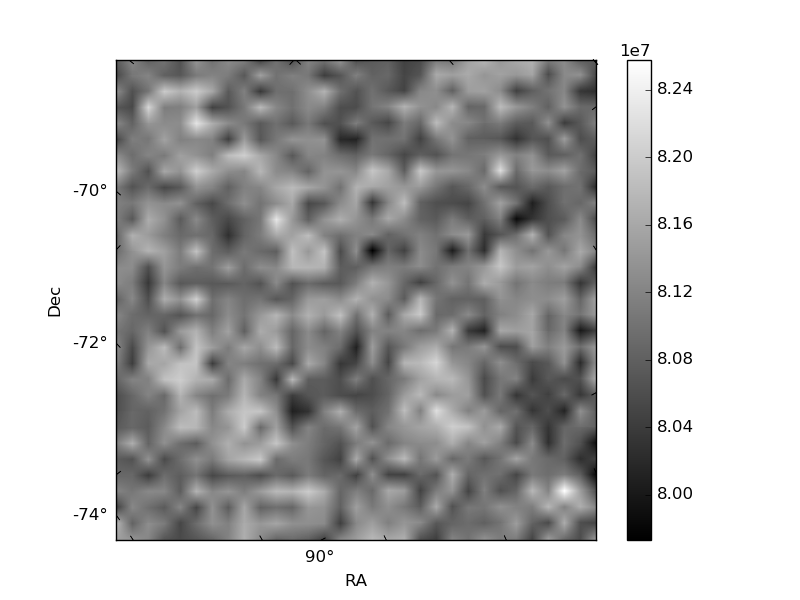
Quadrant B |
|---|---|---|---|
| Quadrant D | 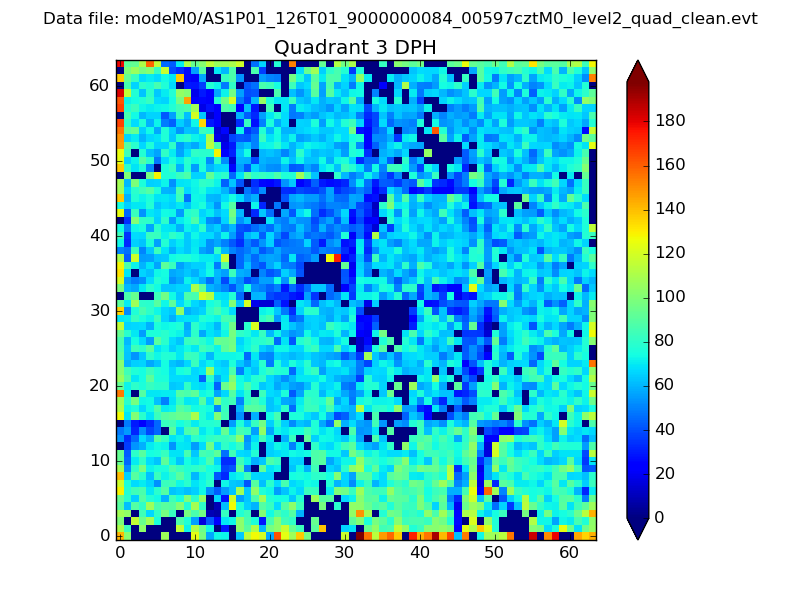 |
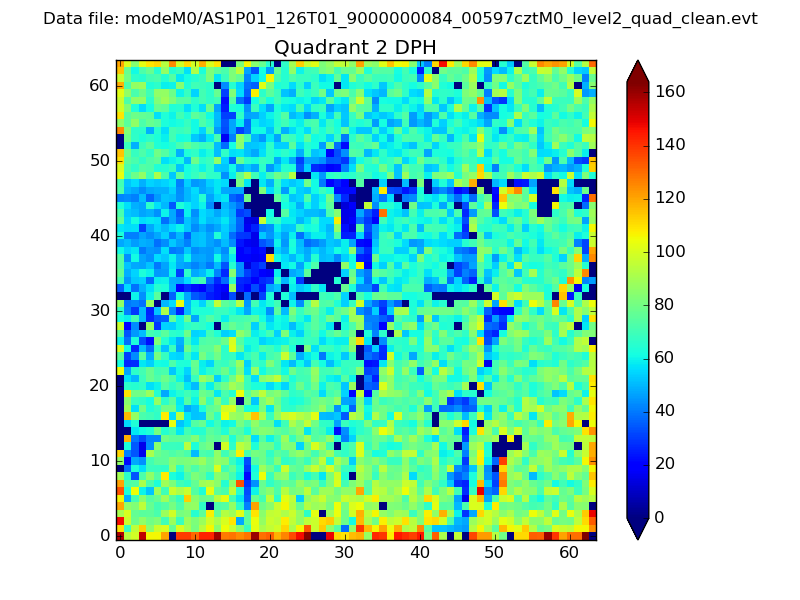 |
Quadrant C |
| Plot type | Count rate plots | Images |
|---|---|---|
| Comparison with Poisson distribution Blue bars denote a histogram of data divided into 1 sec bins. Red curve is a Poisson curve with rate = median count rate of data. |
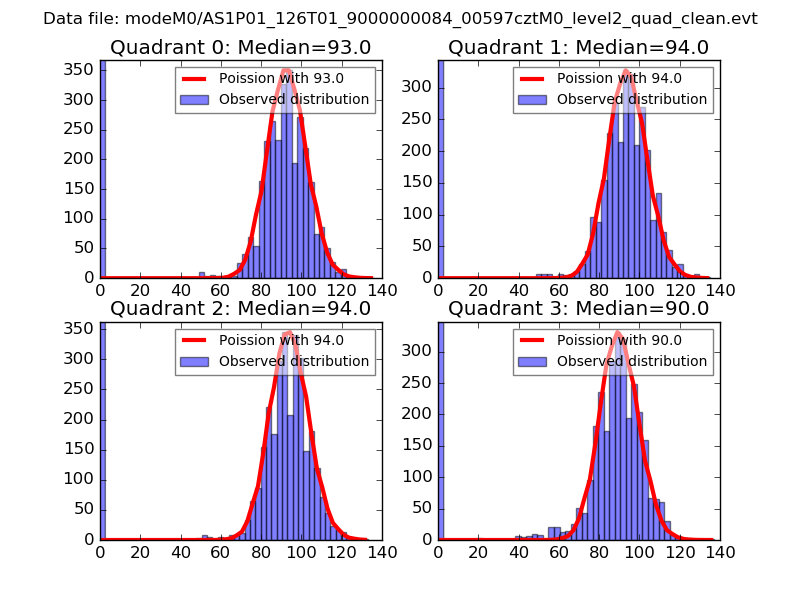 |
 |
| Quadrant-wise count rates Data is divided into 100 sec bins |
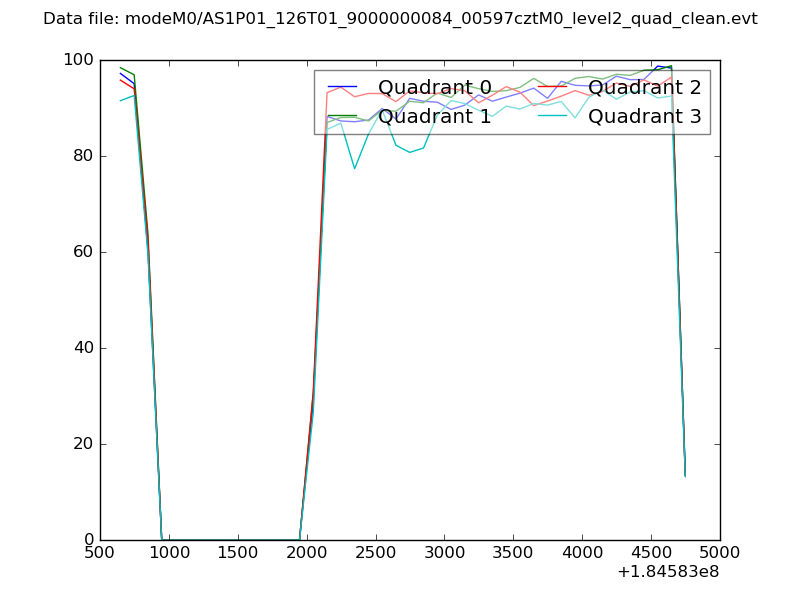 |
|
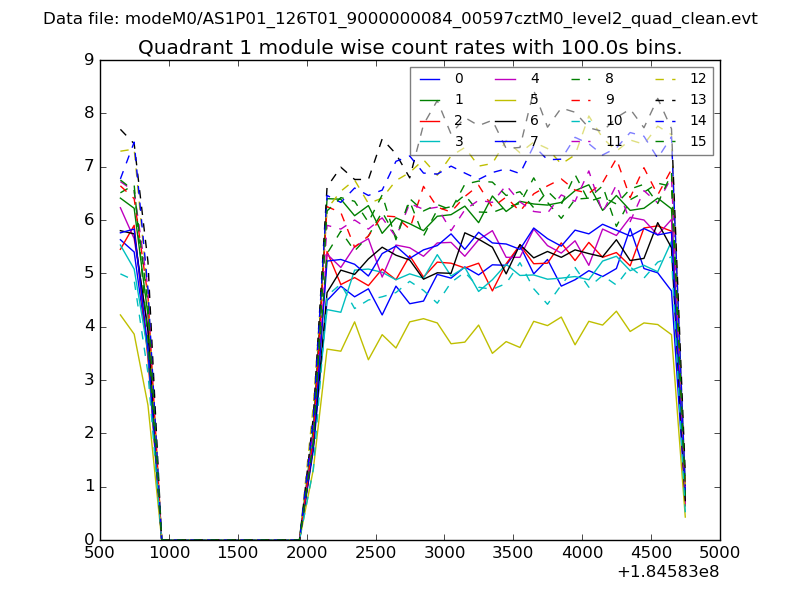
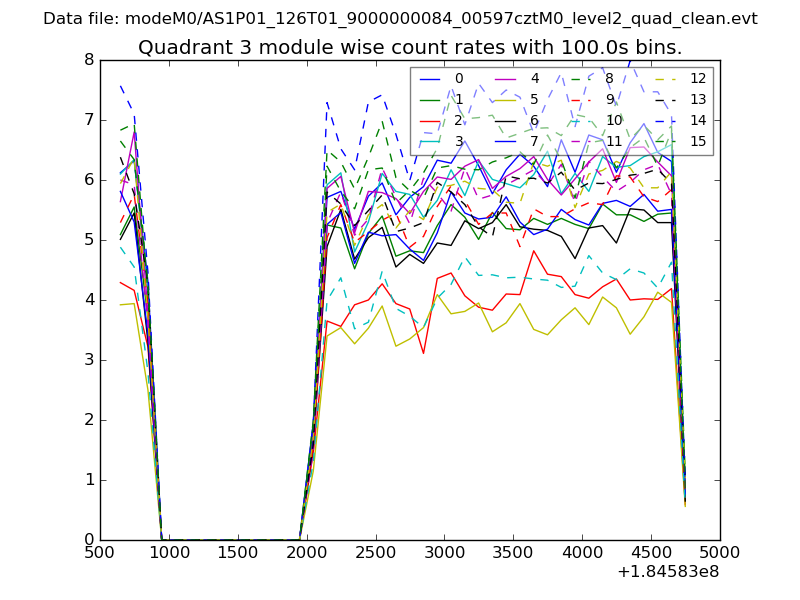
| Module-wise count rates for Quadrant A Data is divided into 100 sec bins |
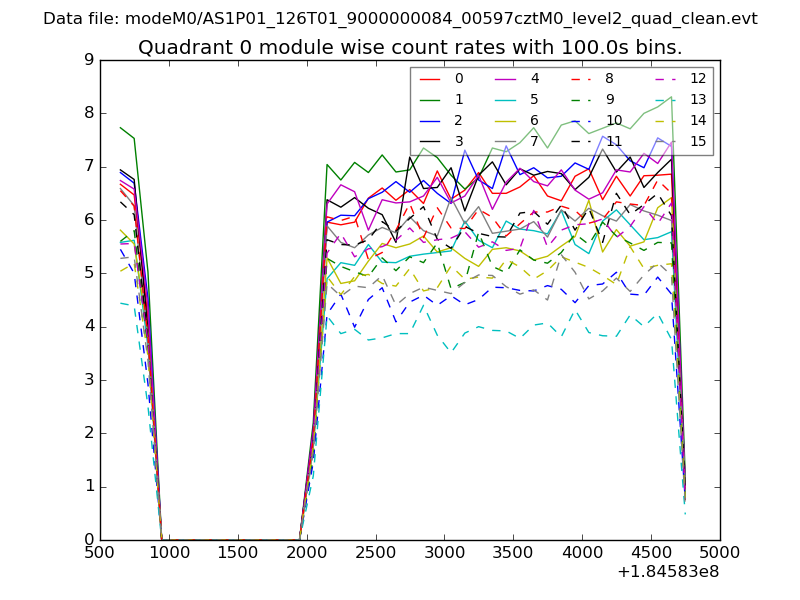 |
 |
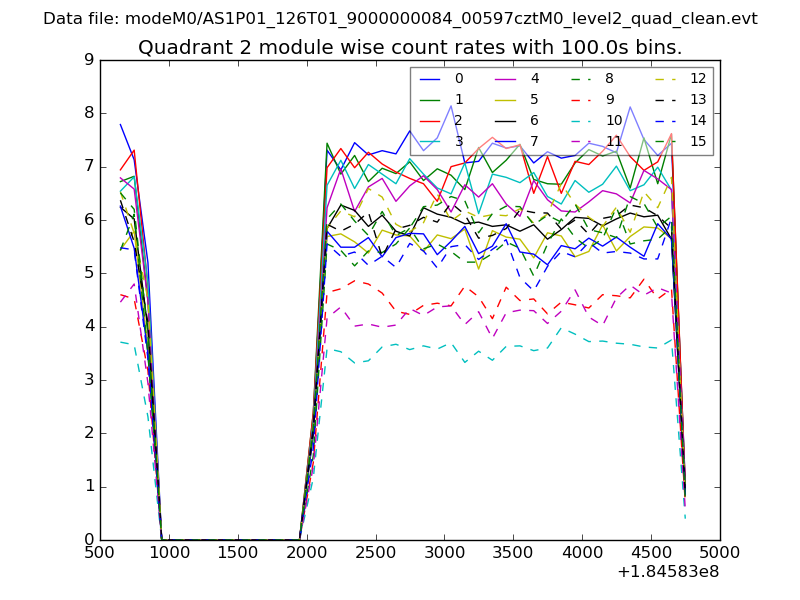
| Module-wise count rates for Quadrant B Data is divided into 100 sec bins |
 |
 |
| Module-wise count rates for Quadrant C Data is divided into 100 sec bins |
 |
 |
| Module-wise count rates for Quadrant D Data is divided into 100 sec bins |
 |
 |
| Parameter | Plot |
|---|---|
| CZT HV Monitor | 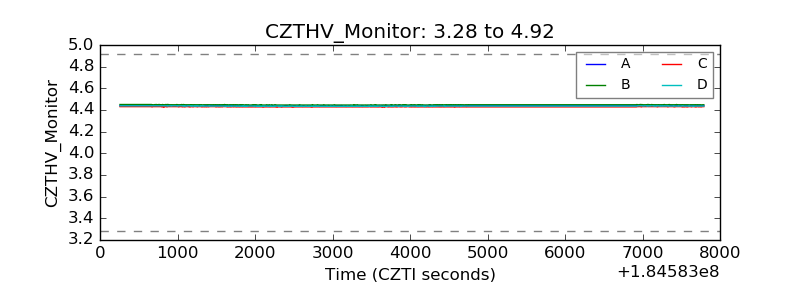 |
| D_VDD | 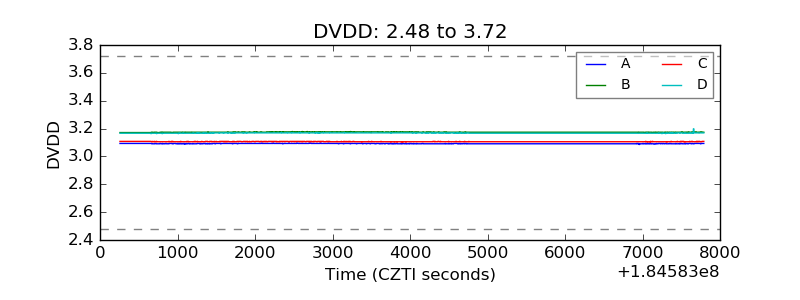 |
| Temperature 1 | 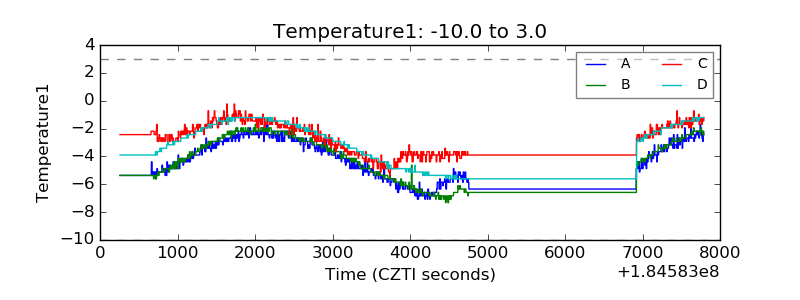 |
| Veto HV Monitor | 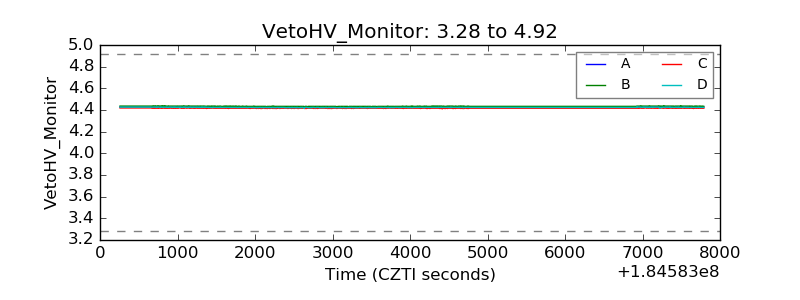 |
| Veto LLD | 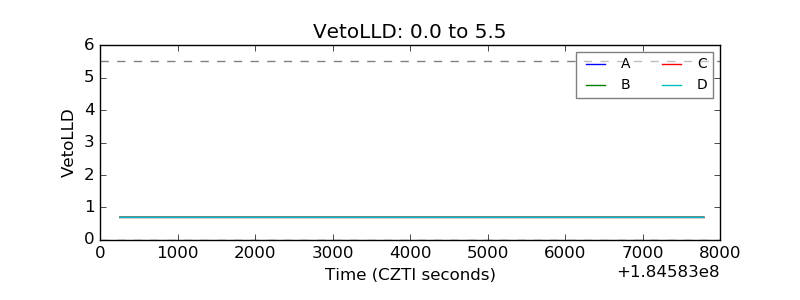 |
| Alpha Counter | 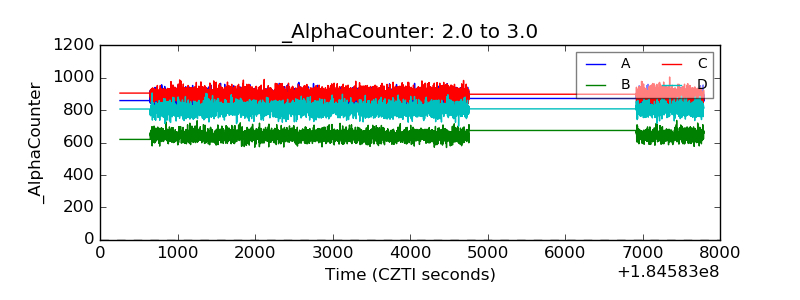 |
| _CPM_Rate | 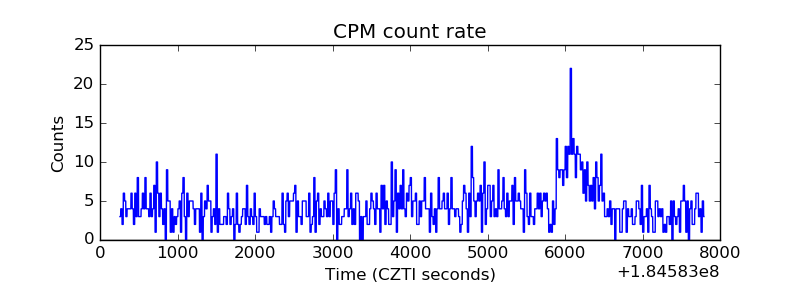 |
| CZT Counter | 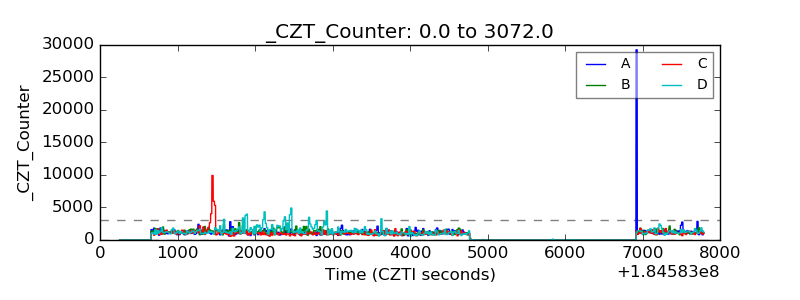 |
| +2.5 Volts monitor |  |
| +5 Volts monitor | 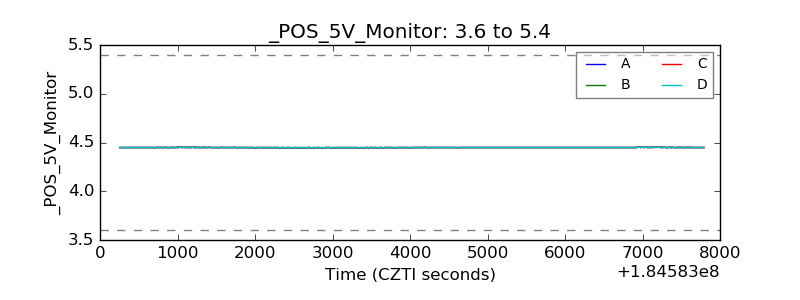 |
| _ROLL_ROT | 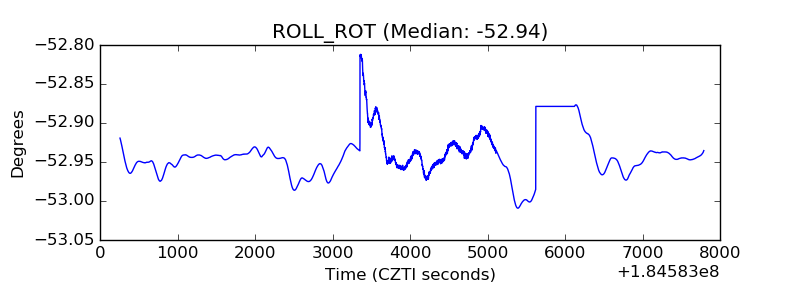 |
| _Roll_DEC | 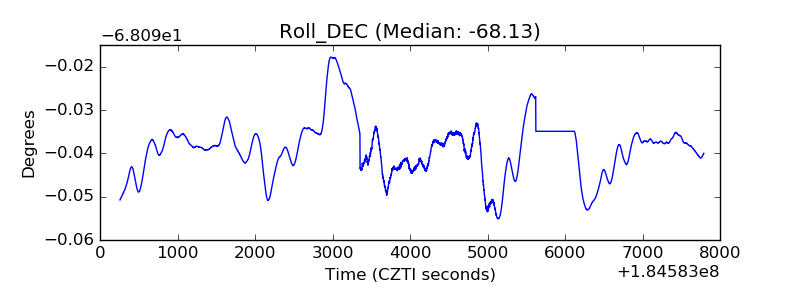 |
| _Roll_RA | 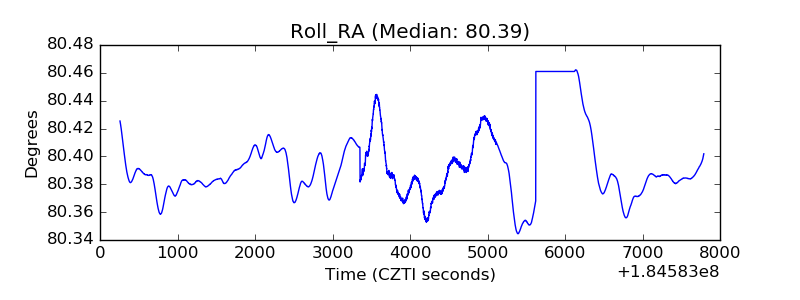 |
| Veto Counter | 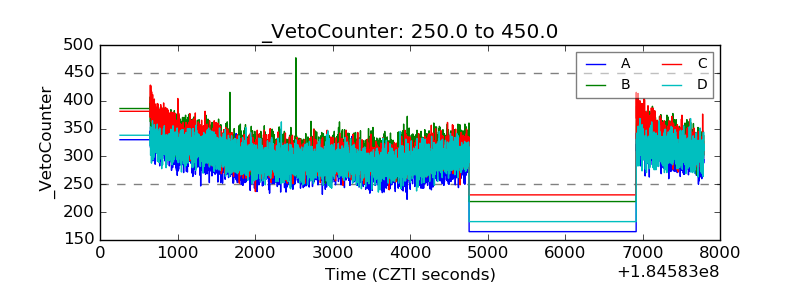 |