| Param | Original file | Final file |
|---|---|---|
| Filename | modeM0/AS1P01_126T01_9000000084_00598cztM0_level2.evt | modeM0/AS1P01_126T01_9000000084_00598cztM0_level2_quad_clean.evt |
| Size (bytes) | 862,182,720 | 56,494,080 |
| Size | 822.2 MB | 53.9 MB |
| Events in quadrant A | 6,371,443 | 337,721 |
| Events in quadrant B | 6,650,865 | 339,438 |
| Events in quadrant C | 5,619,791 | 341,422 |
| Events in quadrant D | 7,113,725 | 317,279 |
| Mode M9 | |||
|---|---|---|---|
| Quadrant | BADHDUFLAG | Total packets | Discarded packets |
| A | 0 | 29 | 0 |
| B | 0 | 29 | 0 |
| C | 0 | 29 | 0 |
| D | 0 | 30 | 0 |
| Mode M0 | |||
|---|---|---|---|
| Quadrant | BADHDUFLAG | Total packets | Discarded packets |
| A | 0 | 22721 | 3 |
| B | 0 | 23579 | 2 |
| C | 0 | 20545 | 2 |
| D | 0 | 24970 | 2 |
| Mode SS | |||
|---|---|---|---|
| Quadrant | BADHDUFLAG | Total packets | Discarded packets |
| A | 0 | 108 | 0 |
| B | 0 | 108 | 0 |
| C | 0 | 108 | 0 |
| D | 0 | 108 | 0 |
| Quadrant | Total seconds | Saturated seconds | Saturation percentage |
|---|---|---|---|
| A | 5349 | 2 | 0.037390% |
| B | 5349 | 17 | 0.317816% |
| C | 5349 | 2 | 0.037390% |
| D | 5349 | 337 | 6.300243% |
Noise dominated data is calculated using 1-second bins in cleaned event files. If a bin has >2000 counts, and if more than 50% of those come from <1% of pixels, then it is considered to be noise-dominated and hence unusable.
| Quadrant | # 1 sec bins | Bins with >0 counts | Bins with >2000 counts | High rate bins dominated by noise | Noise dominated (total time) | Noise dominated (detector-on time) | Marked lightcurve |
|---|---|---|---|---|---|---|---|
| A | 7505 | 5350 | 113 | 113 | 1.51% | 2.11% | 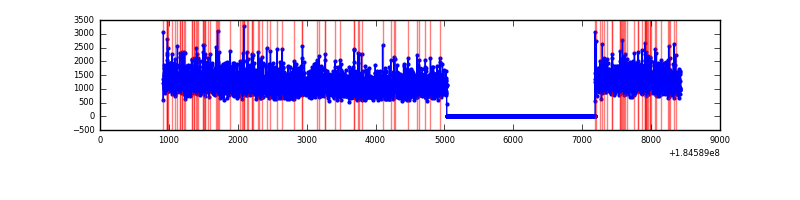 |
| B | 7505 | 5350 | 166 | 166 | 2.21% | 3.10% | 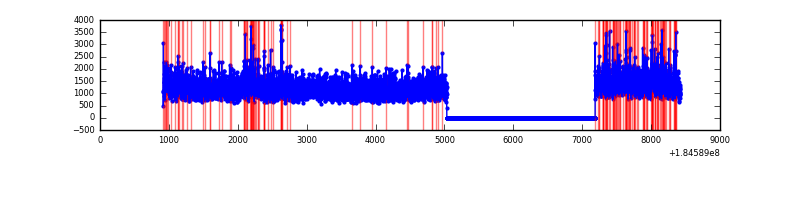 |
| C | 7505 | 5350 | 29 | 29 | 0.39% | 0.54% | 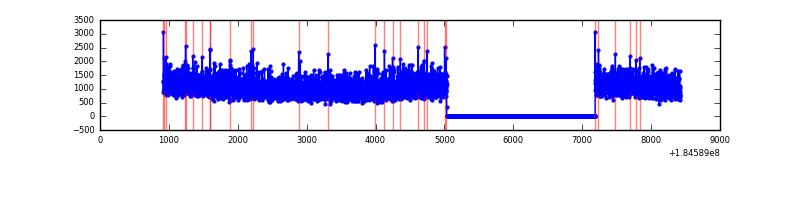 |
| D | 7505 | 5349 | 517 | 517 | 6.89% | 9.67% | 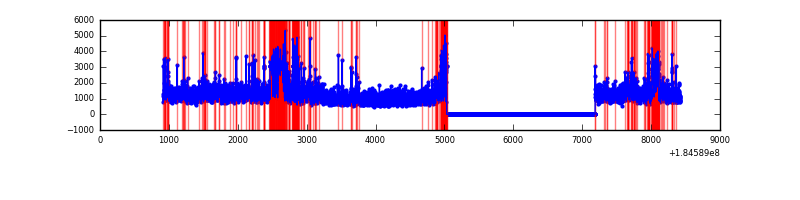 |
Top three noisy pixels from each quadrant. If the there are fewer than three noisy pixels in the level2.evt file, extra rows are filled as -1
| Pixel properties | Quadrant properties | ||||||
|---|---|---|---|---|---|---|---|
| Quadrant | DetID | PixID | Counts | Sigma | Mean | Median | Sigma |
| A | 13 | 160 | 35371 | 93.91 | 1617 | 1605 | 359.5 |
| A | 0 | 238 | 34915 | 92.65 | 1617 | 1605 | 359.5 |
| A | 13 | 190 | 23622 | 61.24 | 1617 | 1605 | 359.5 |
| B | 7 | 221 | 341416 | 891.84 | 1600 | 1610 | 381.0 |
| B | 4 | 250 | 86390 | 222.51 | 1600 | 1610 | 381.0 |
| B | 5 | 46 | 19204 | 46.18 | 1600 | 1610 | 381.0 |
| C | 5 | 234 | 20450 | 47.79 | 1417 | 1459 | 397.4 |
| C | 15 | 241 | 16976 | 39.05 | 1417 | 1459 | 397.4 |
| C | 9 | 83 | 14499 | 32.82 | 1417 | 1459 | 397.4 |
| D | 12 | 188 | 393988 | 911.1 | 1370 | 1421 | 430.9 |
| D | 1 | 4 | 317445 | 733.45 | 1370 | 1421 | 430.9 |
| D | 2 | 90 | 291164 | 672.46 | 1370 | 1421 | 430.9 |
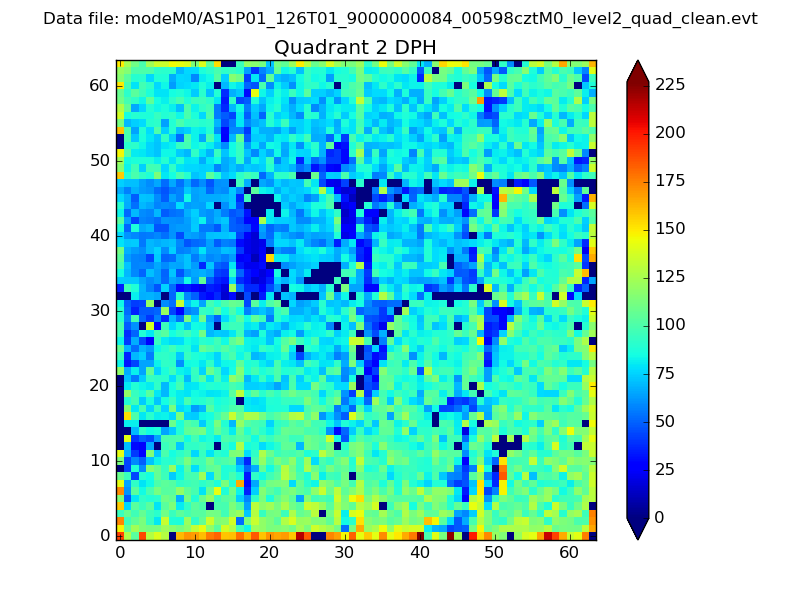
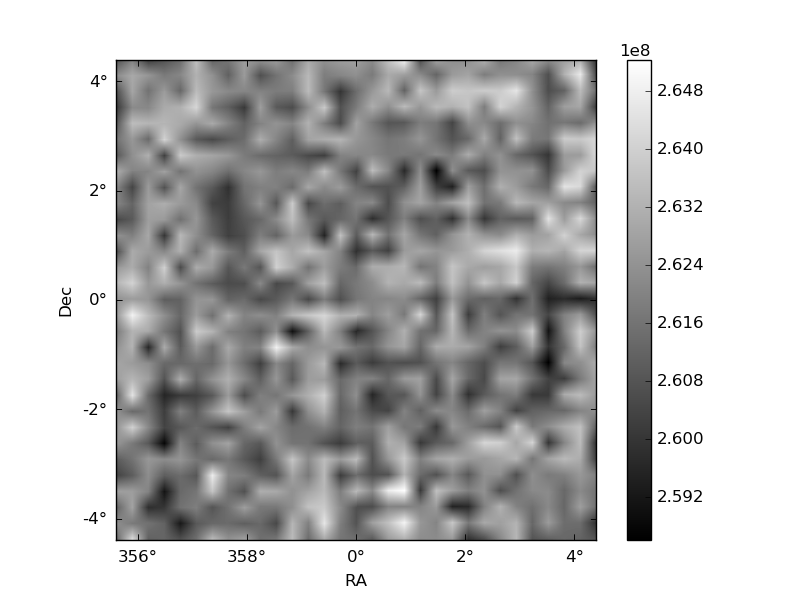
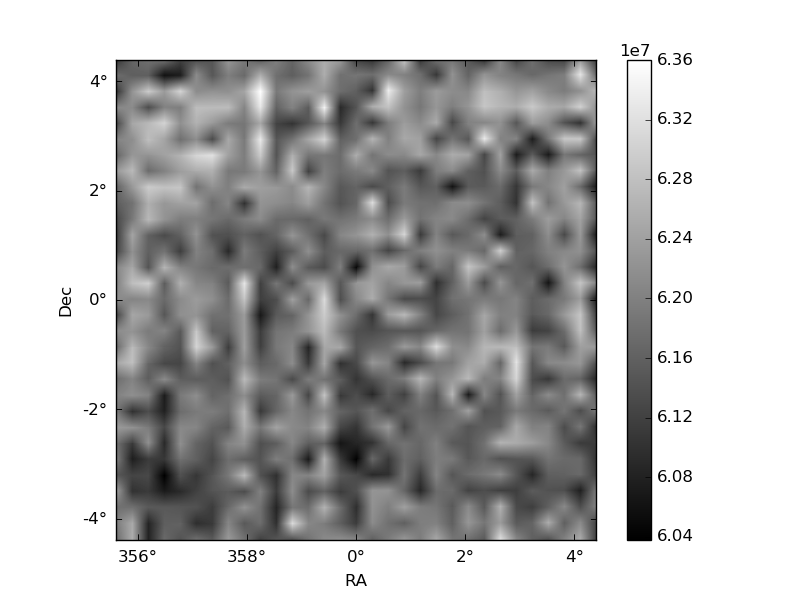
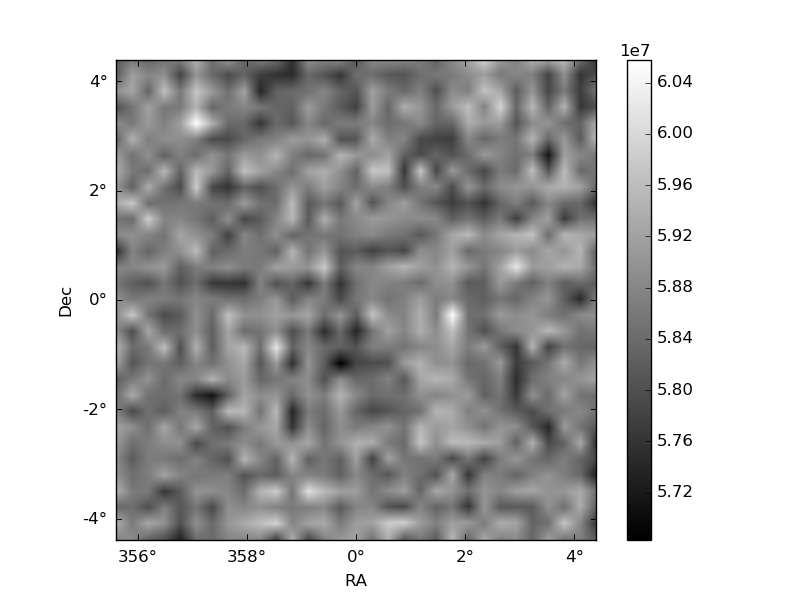
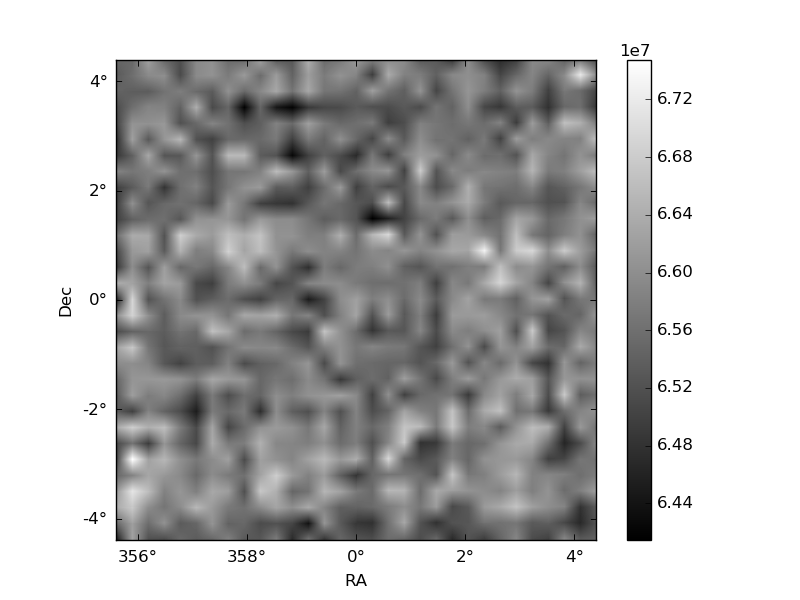
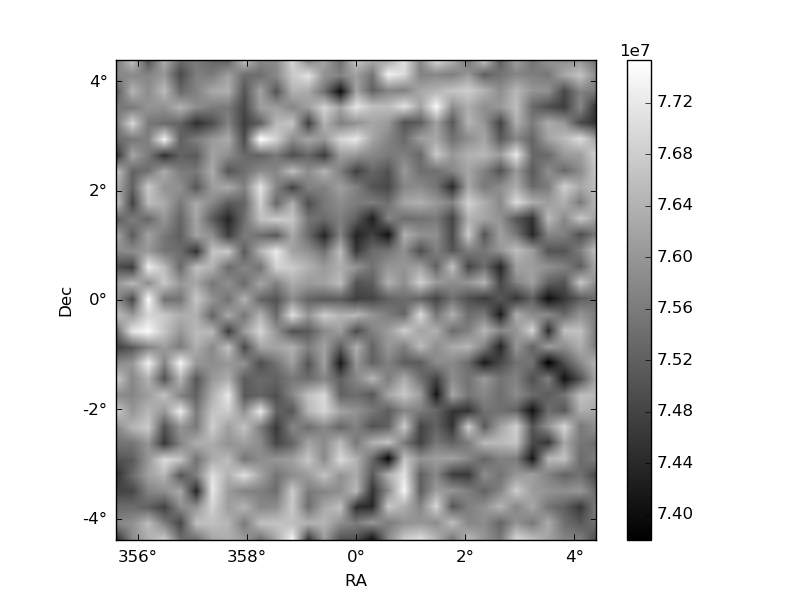
Histogram calculated using DETX and DETY for each event in the final _common_clean file
| Quadrant A | 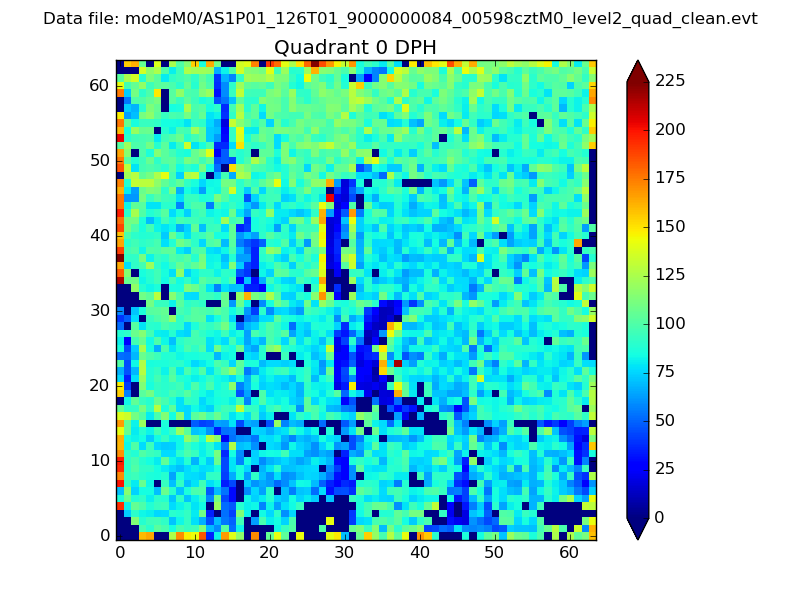 |
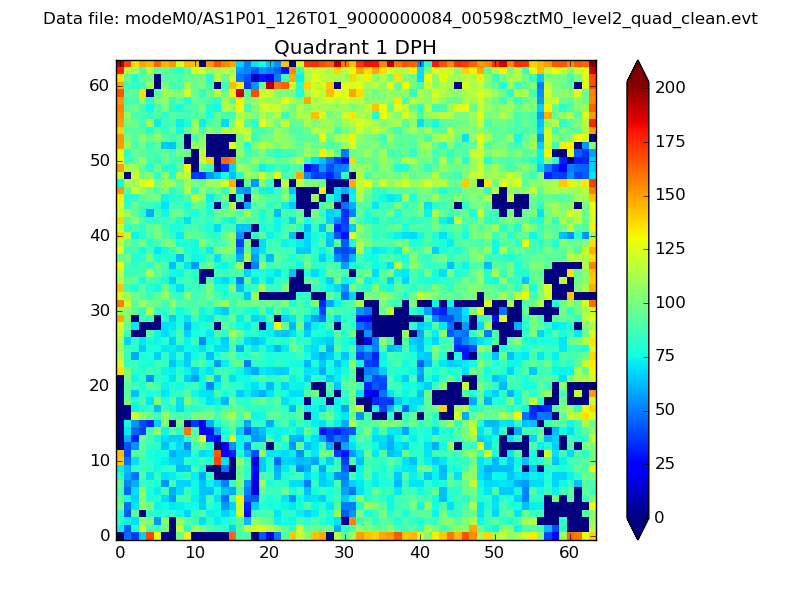 |
Quadrant B |
|---|---|---|---|
| Quadrant D | 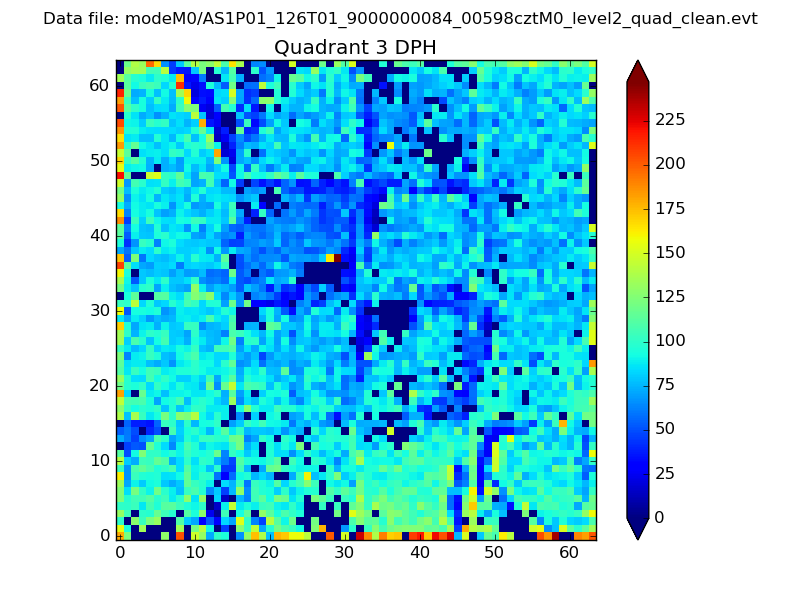 |
 |
Quadrant C |
| Plot type | Count rate plots | Images |
|---|---|---|
| Comparison with Poisson distribution Blue bars denote a histogram of data divided into 1 sec bins. Red curve is a Poisson curve with rate = median count rate of data. |
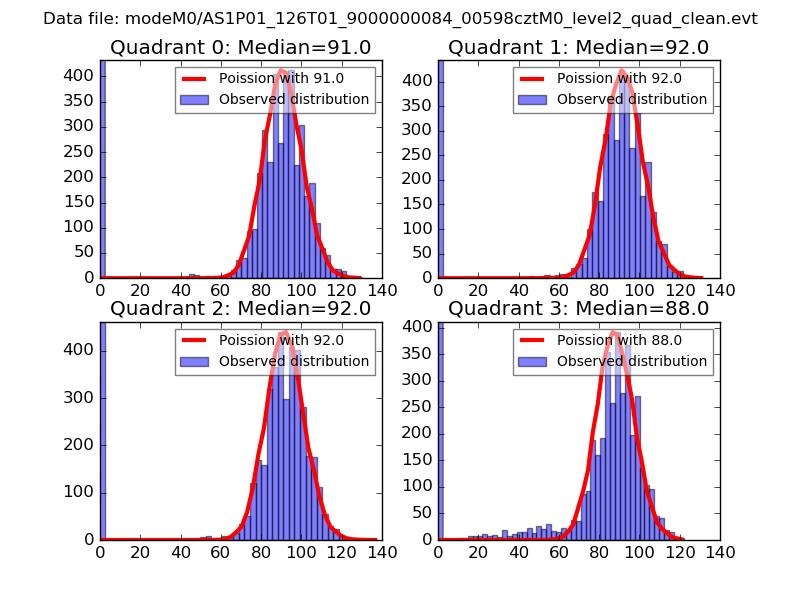 |
 |
| Quadrant-wise count rates Data is divided into 100 sec bins |
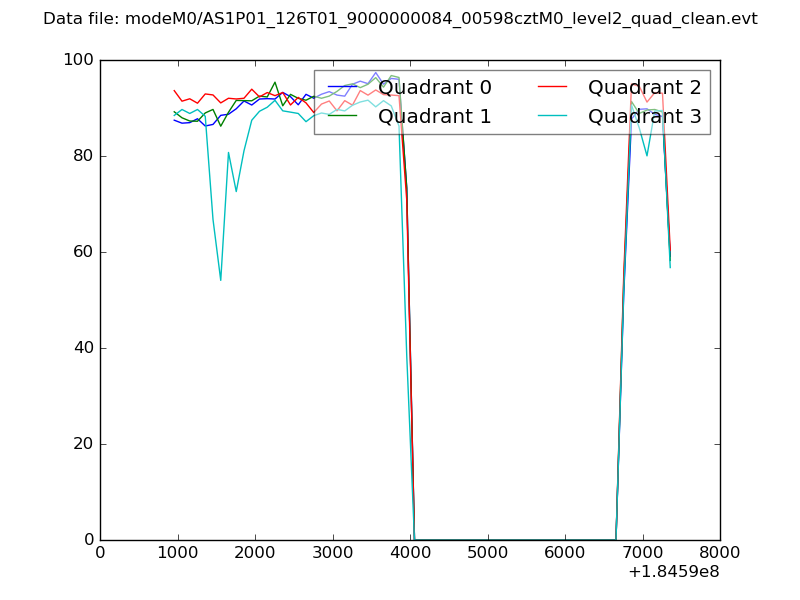 |
|
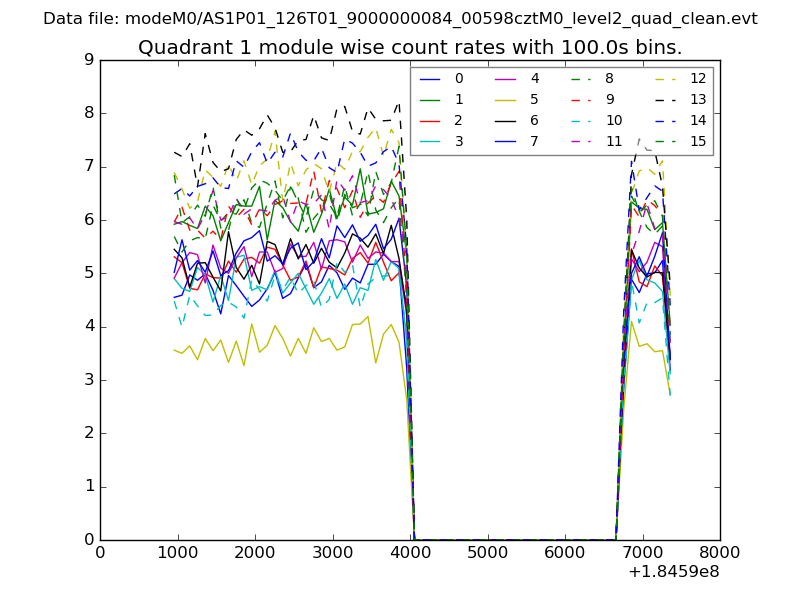
| Module-wise count rates for Quadrant A Data is divided into 100 sec bins |
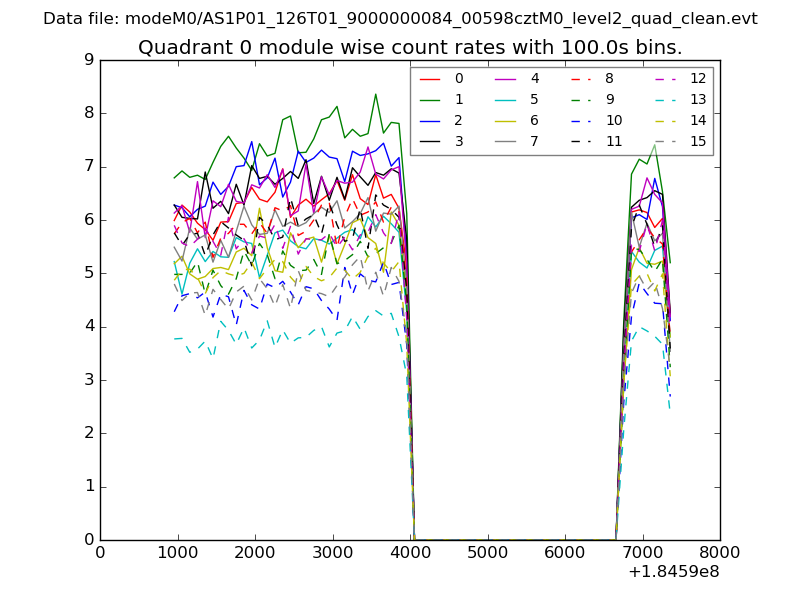 |
 |
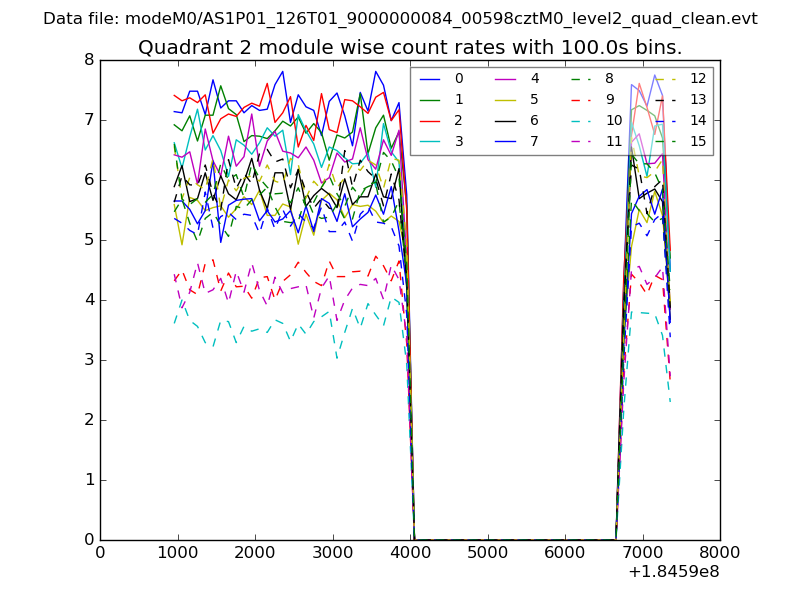
| Module-wise count rates for Quadrant B Data is divided into 100 sec bins |
 |
 |
| Module-wise count rates for Quadrant C Data is divided into 100 sec bins |
 |
 |
| Module-wise count rates for Quadrant D Data is divided into 100 sec bins |
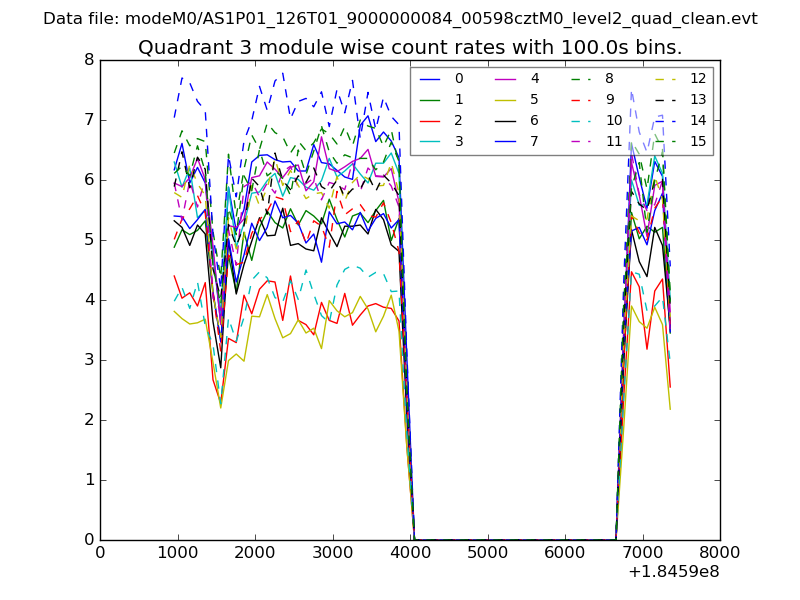 |
 |
| Parameter | Plot |
|---|---|
| CZT HV Monitor | 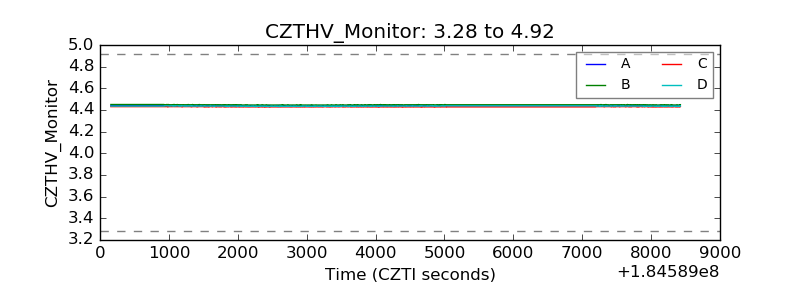 |
| D_VDD | 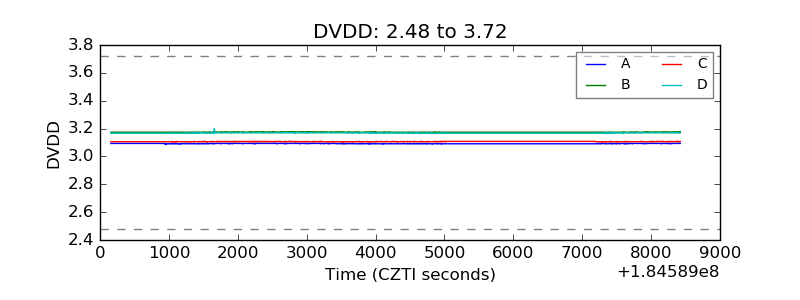 |
| Temperature 1 | 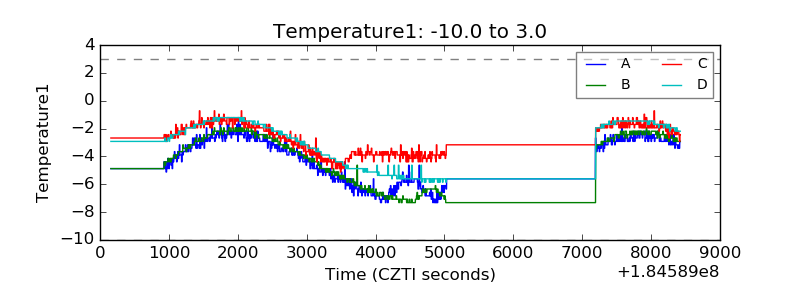 |
| Veto HV Monitor | 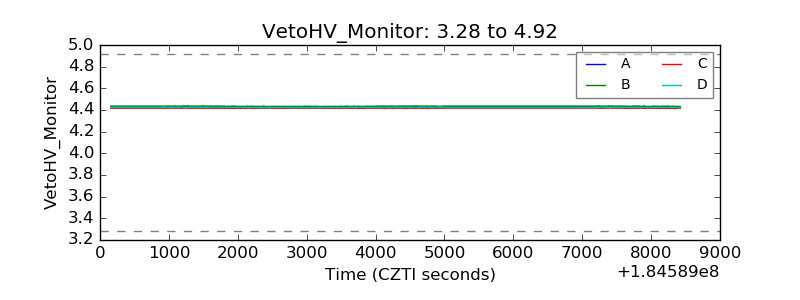 |
| Veto LLD | 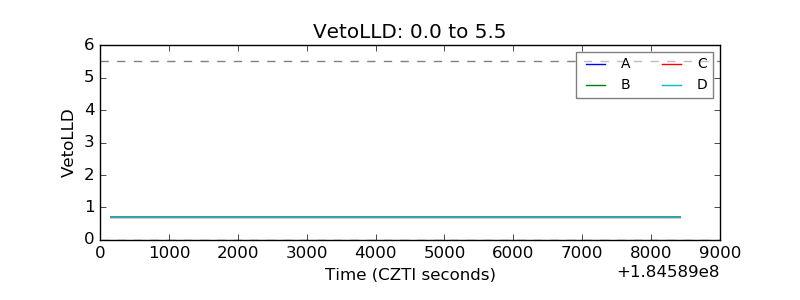 |
| Alpha Counter | 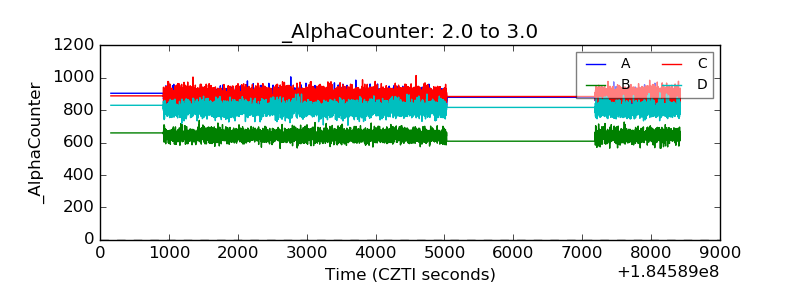 |
| _CPM_Rate | 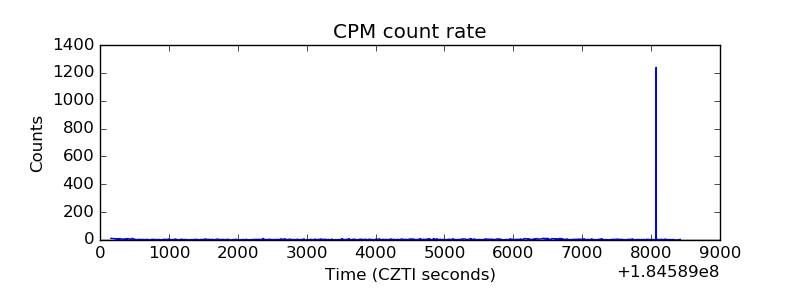 |
| CZT Counter | 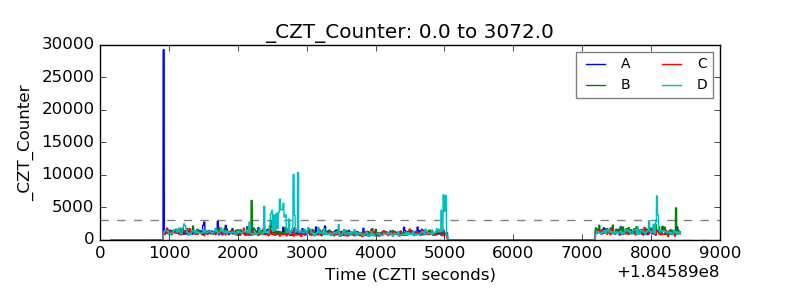 |
| +2.5 Volts monitor |  |
| +5 Volts monitor |  |
| _ROLL_ROT | 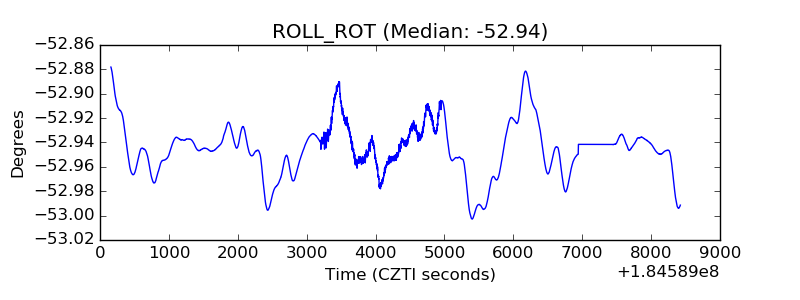 |
| _Roll_DEC | 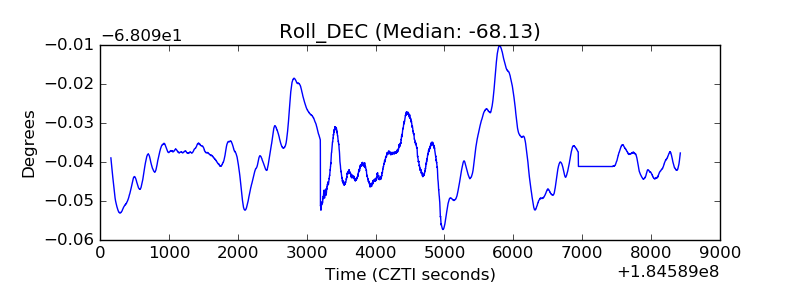 |
| _Roll_RA | 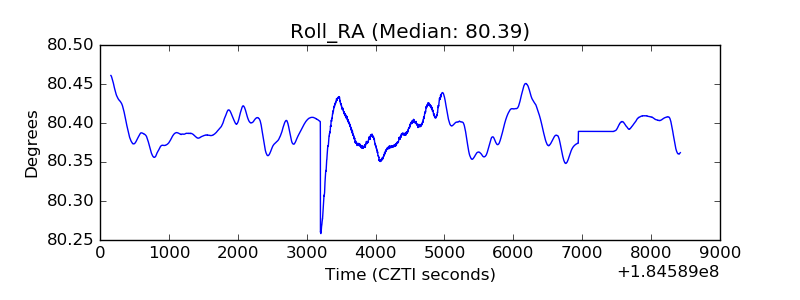 |
| Veto Counter | 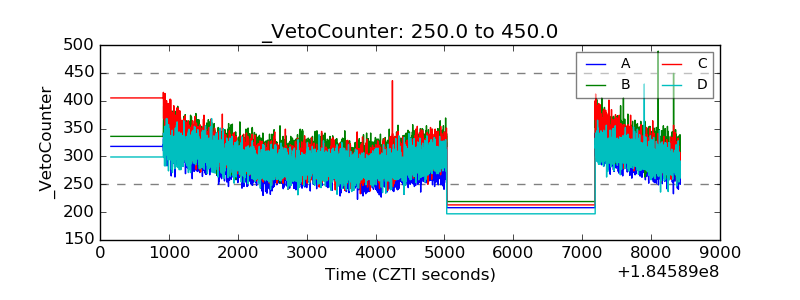 |