| Param | Original file | Final file |
|---|---|---|
| Filename | modeM0/AS1P01_126T01_9000000084_00601cztM0_level2.evt | modeM0/AS1P01_126T01_9000000084_00601cztM0_level2_quad_clean.evt |
| Size (bytes) | 732,424,320 | 57,816,000 |
| Size | 698.5 MB | 55.1 MB |
| Events in quadrant A | 7,661,556 | 351,038 |
| Events in quadrant B | 4,826,488 | 378,173 |
| Events in quadrant C | 4,754,160 | 370,529 |
| Events in quadrant D | 4,667,133 | 361,815 |
| Mode M9 | |||
|---|---|---|---|
| Quadrant | BADHDUFLAG | Total packets | Discarded packets |
| A | 0 | 12 | 0 |
| B | 0 | 12 | 0 |
| C | 0 | 12 | 0 |
| D | 0 | 12 | 0 |
| Mode M0 | |||
|---|---|---|---|
| Quadrant | BADHDUFLAG | Total packets | Discarded packets |
| A | 0 | 25729 | 1 |
| B | 0 | 17243 | 1 |
| C | 0 | 16988 | 1 |
| D | 0 | 16786 | 1 |
| Mode SS | |||
|---|---|---|---|
| Quadrant | BADHDUFLAG | Total packets | Discarded packets |
| A | 0 | 84 | 0 |
| B | 0 | 84 | 0 |
| C | 0 | 84 | 0 |
| D | 0 | 84 | 0 |
| Quadrant | Total seconds | Saturated seconds | Saturation percentage |
|---|---|---|---|
| A | 4094 | 703 | 17.171470% |
| B | 4094 | 17 | 0.415242% |
| C | 4094 | 3 | 0.073278% |
| D | 4094 | 49 | 1.196873% |
Noise dominated data is calculated using 1-second bins in cleaned event files. If a bin has >2000 counts, and if more than 50% of those come from <1% of pixels, then it is considered to be noise-dominated and hence unusable.
| Quadrant | # 1 sec bins | Bins with >0 counts | Bins with >2000 counts | High rate bins dominated by noise | Noise dominated (total time) | Noise dominated (detector-on time) | Marked lightcurve |
|---|---|---|---|---|---|---|---|
| A | 4094 | 4094 | 1555 | 1555 | 37.98% | 37.98% | 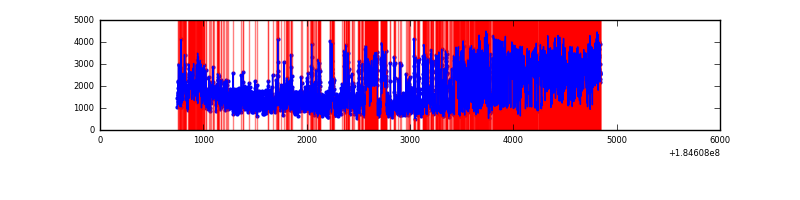 |
| B | 4094 | 4094 | 83 | 83 | 2.03% | 2.03% | 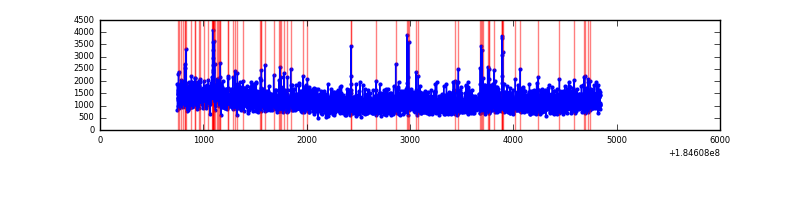 |
| C | 4094 | 4094 | 125 | 125 | 3.05% | 3.05% | 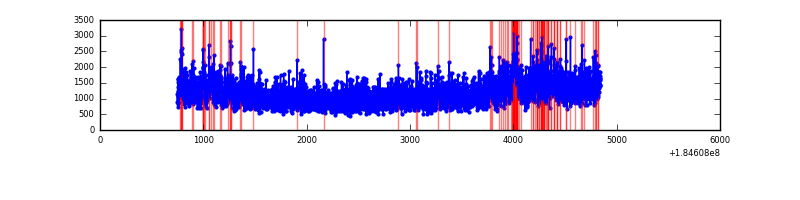 |
| D | 4094 | 4094 | 208 | 208 | 5.08% | 5.08% | 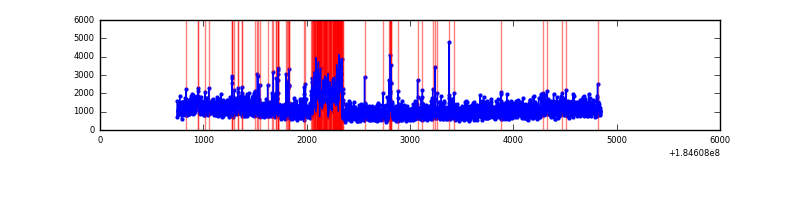 |
Top three noisy pixels from each quadrant. If the there are fewer than three noisy pixels in the level2.evt file, extra rows are filled as -1
| Pixel properties | Quadrant properties | ||||||
|---|---|---|---|---|---|---|---|
| Quadrant | DetID | PixID | Counts | Sigma | Mean | Median | Sigma |
| A | 15 | 200 | 3141709 | 12318.31 | 1143 | 1133 | 255.0 |
| A | 13 | 160 | 55274 | 212.36 | 1143 | 1133 | 255.0 |
| A | 0 | 238 | 19040 | 70.24 | 1143 | 1133 | 255.0 |
| B | 7 | 221 | 139492 | 486.6 | 1197 | 1203 | 284.2 |
| B | 5 | 191 | 44749 | 153.23 | 1197 | 1203 | 284.2 |
| B | 4 | 250 | 28245 | 95.15 | 1197 | 1203 | 284.2 |
| C | 9 | 83 | 473071 | 1560.78 | 1082 | 1122 | 302.4 |
| C | 7 | 173 | 20895 | 65.39 | 1082 | 1122 | 302.4 |
| C | 15 | 241 | 12627 | 38.05 | 1082 | 1122 | 302.4 |
| D | 12 | 237 | 394136 | 1215.24 | 1014 | 1054 | 323.5 |
| D | 1 | 4 | 138680 | 425.48 | 1014 | 1054 | 323.5 |
| D | 13 | 221 | 101401 | 310.23 | 1014 | 1054 | 323.5 |
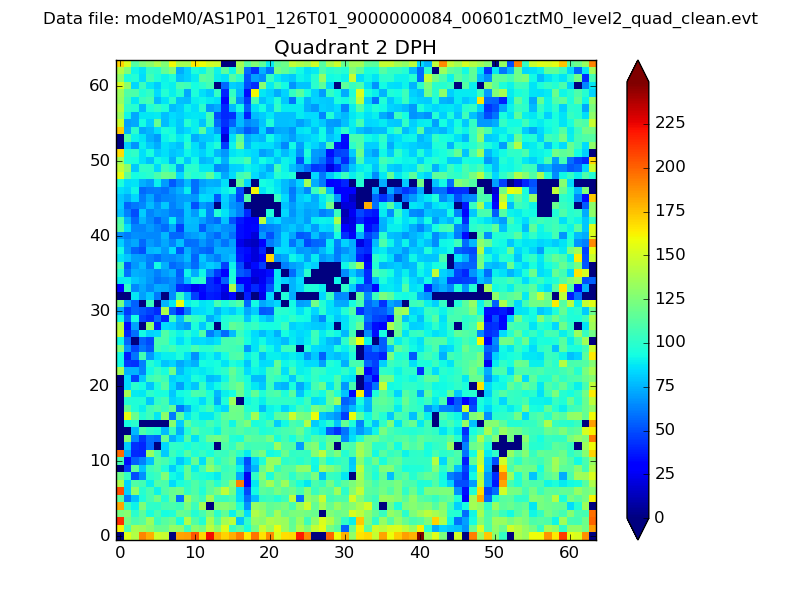
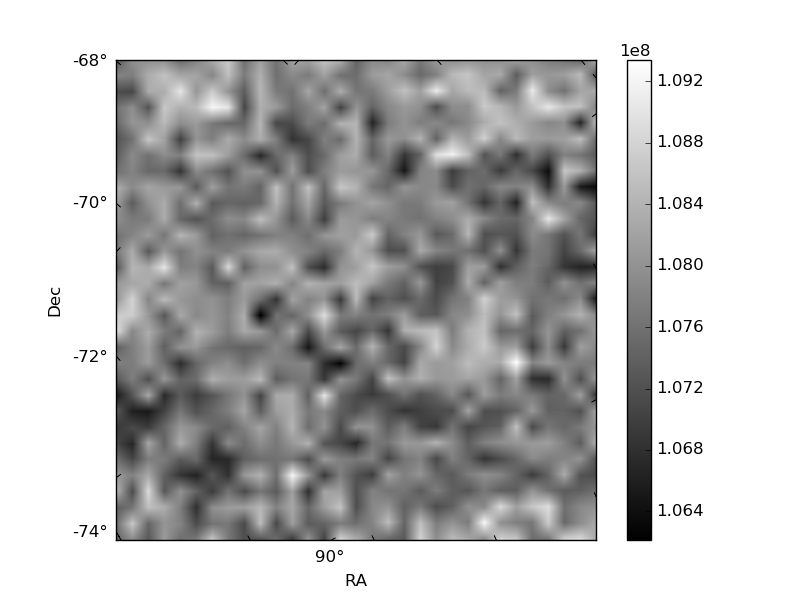
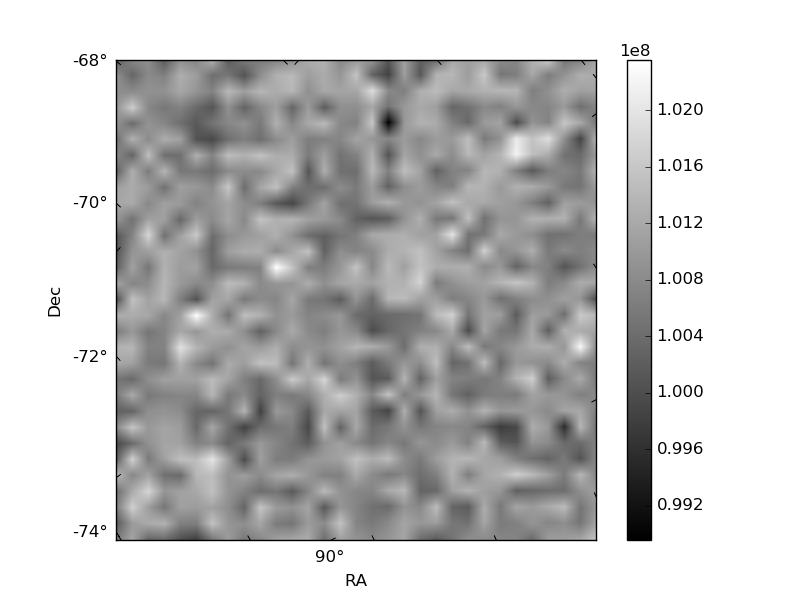
Histogram calculated using DETX and DETY for each event in the final _common_clean file
| Quadrant A | 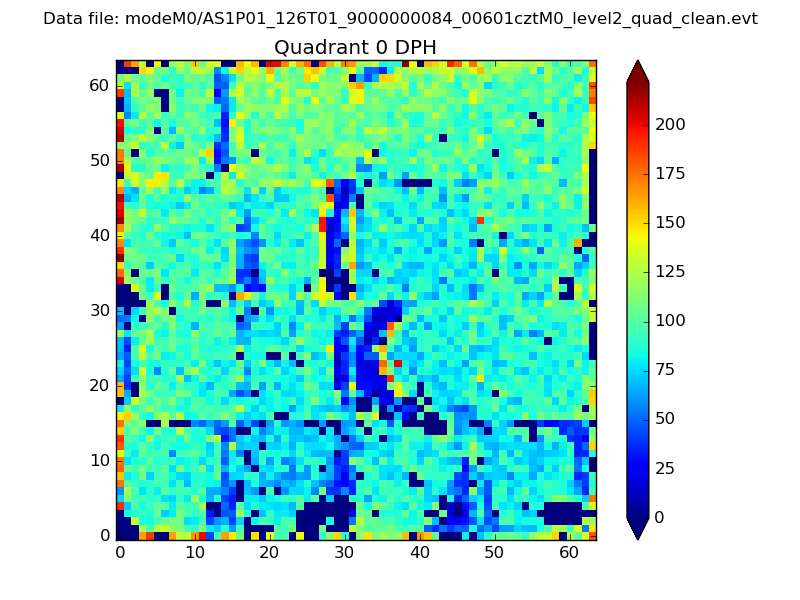 |
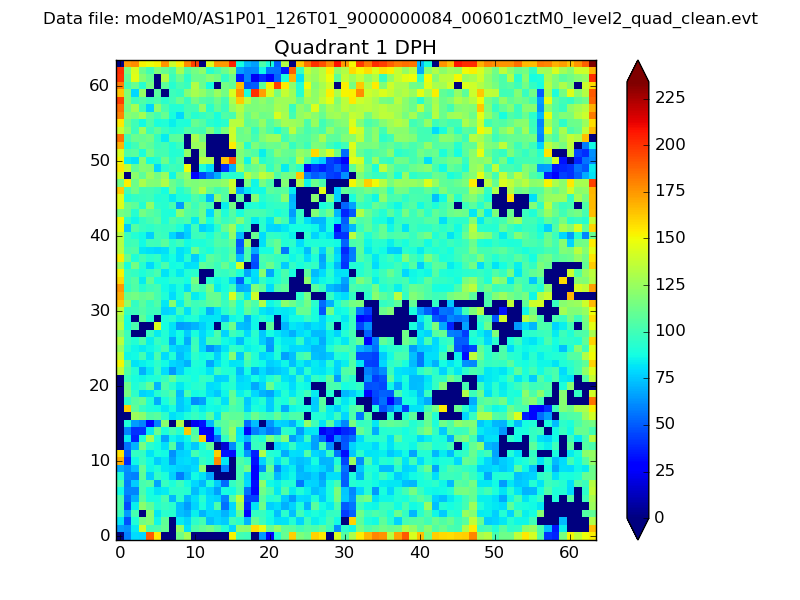 |
Quadrant B |
|---|---|---|---|
| Quadrant D | 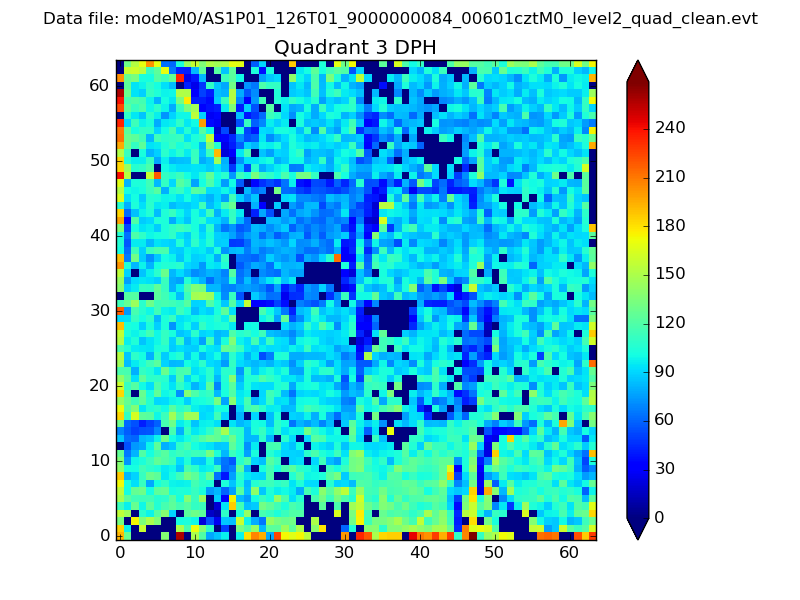 |
 |
Quadrant C |
| Plot type | Count rate plots | Images |
|---|---|---|
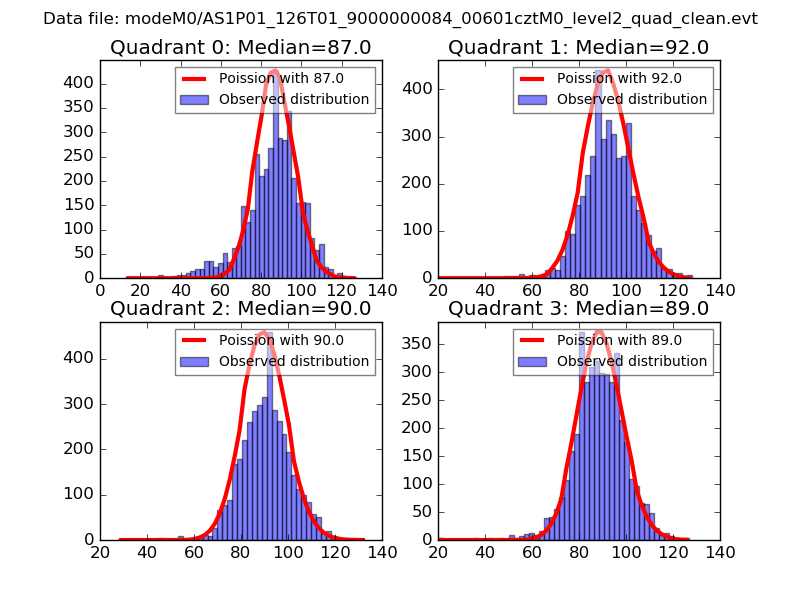
| Comparison with Poisson distribution Blue bars denote a histogram of data divided into 1 sec bins. Red curve is a Poisson curve with rate = median count rate of data. |
 |
 |
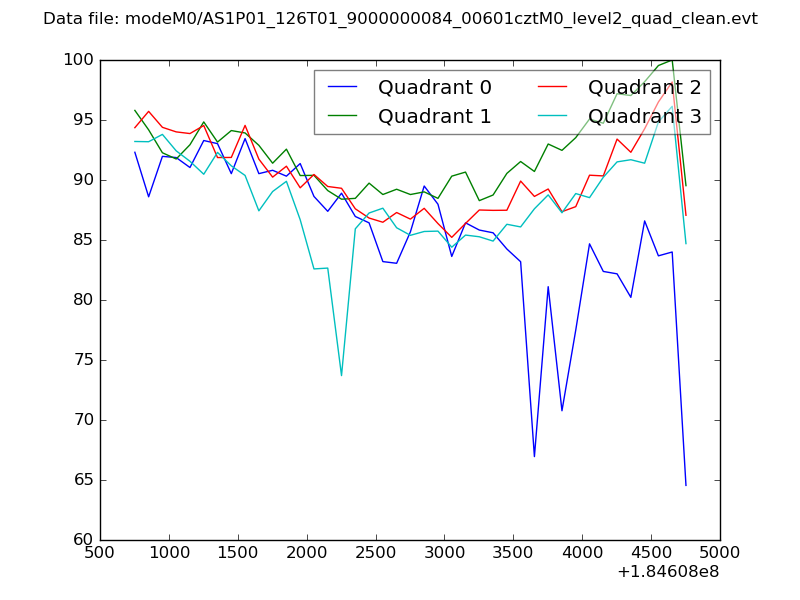
| Quadrant-wise count rates Data is divided into 100 sec bins |
 |
|
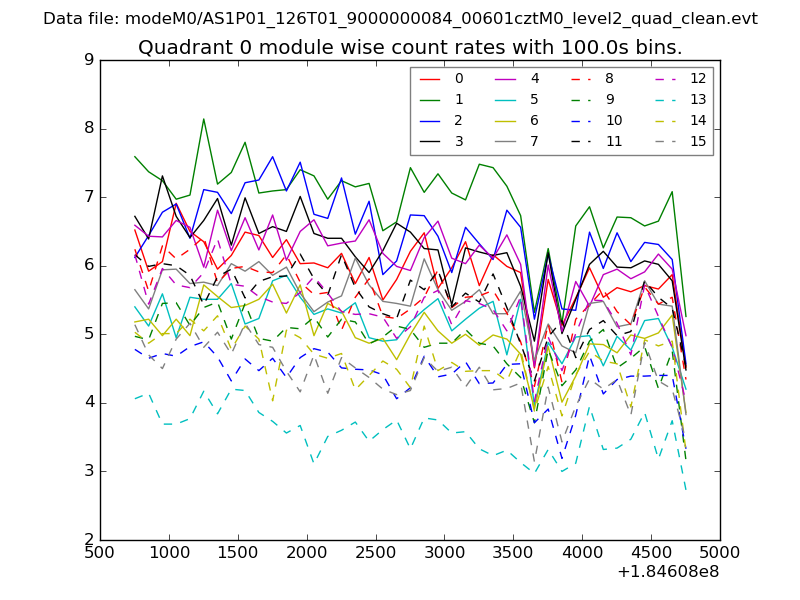
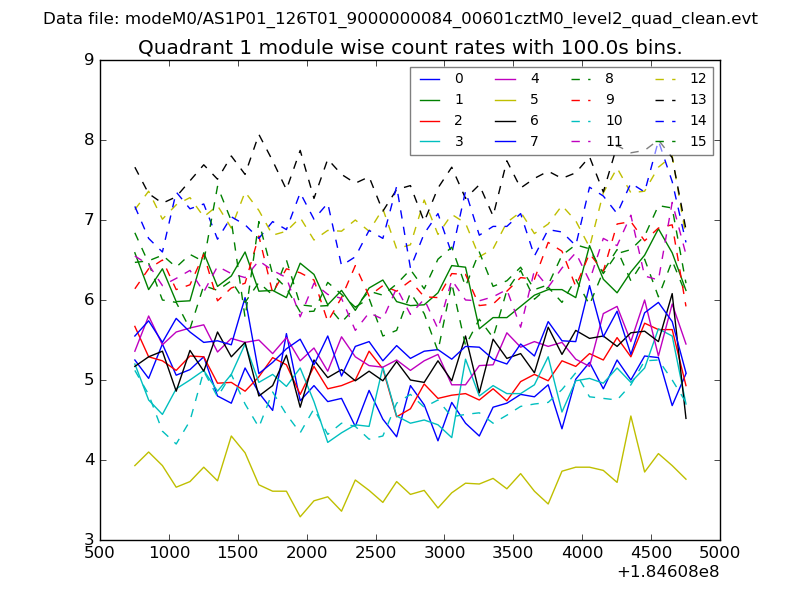
| Module-wise count rates for Quadrant A Data is divided into 100 sec bins |
 |
 |
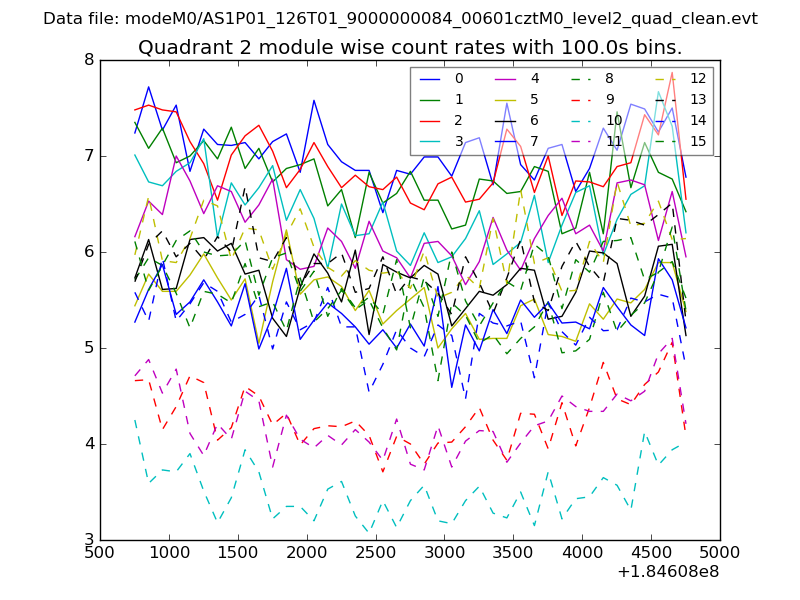
| Module-wise count rates for Quadrant B Data is divided into 100 sec bins |
 |
 |
| Module-wise count rates for Quadrant C Data is divided into 100 sec bins |
 |
 |
| Module-wise count rates for Quadrant D Data is divided into 100 sec bins |
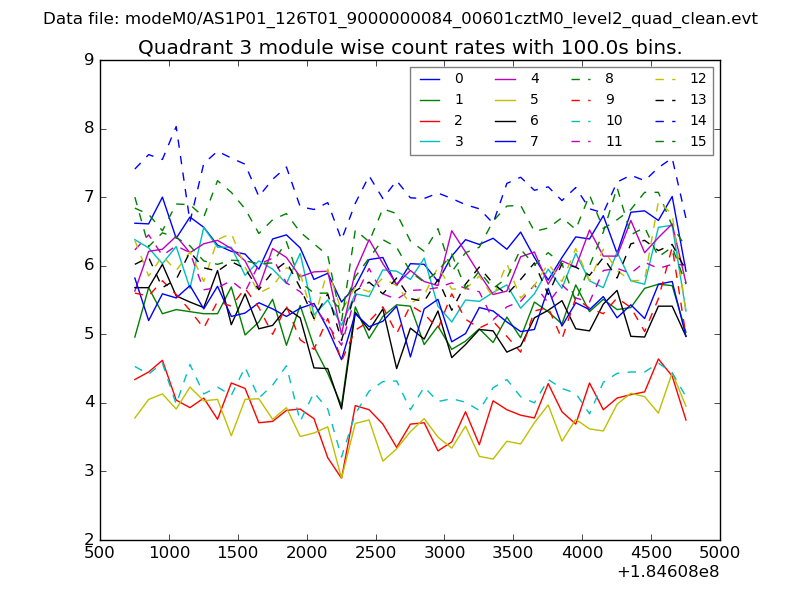 |
 |
| Parameter | Plot |
|---|---|
| CZT HV Monitor | 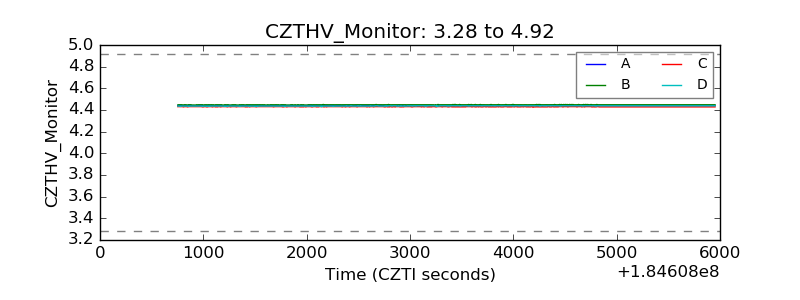 |
| D_VDD | 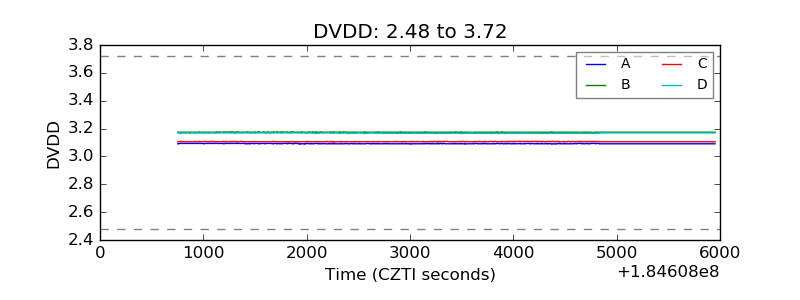 |
| Temperature 1 |  |
| Veto HV Monitor | 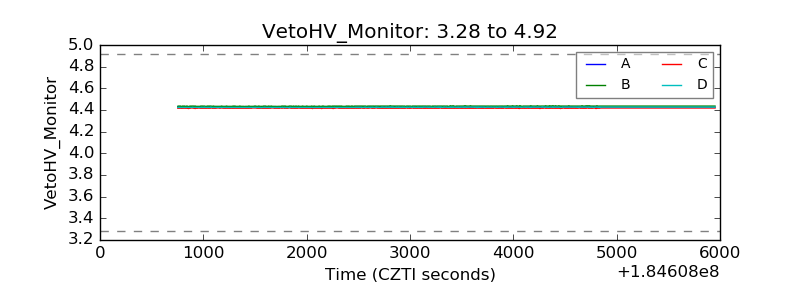 |
| Veto LLD | 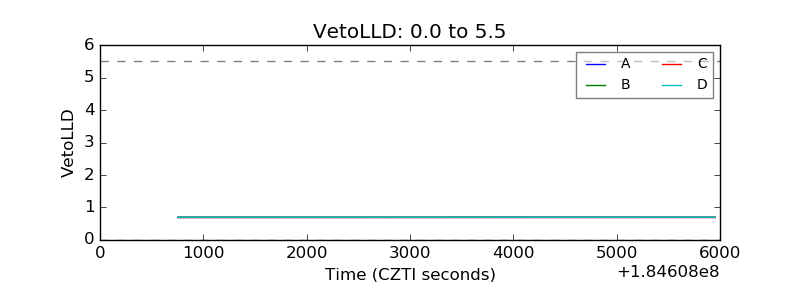 |
| Alpha Counter | 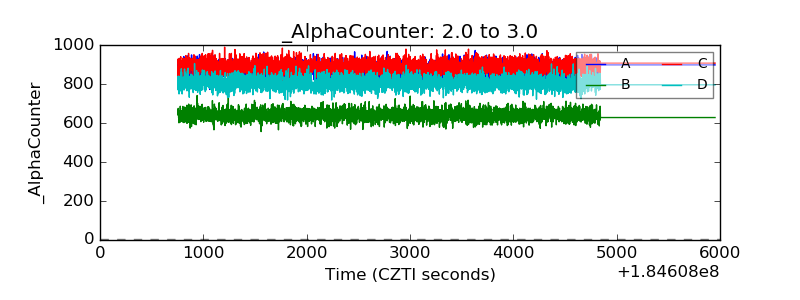 |
| _CPM_Rate | 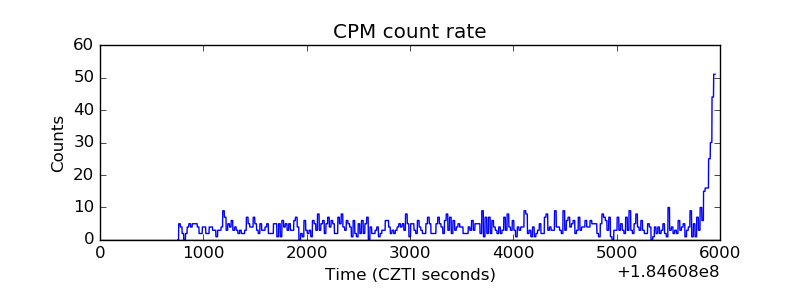 |
| CZT Counter | 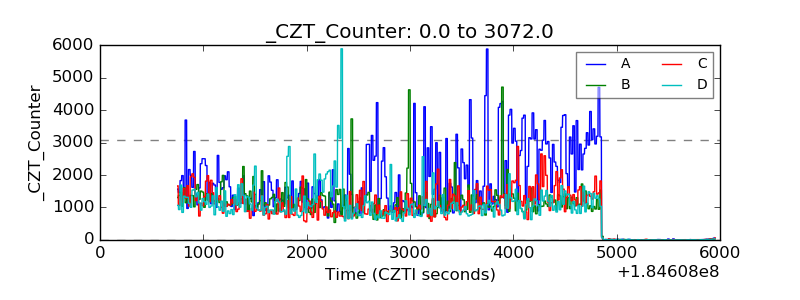 |
| +2.5 Volts monitor |  |
| +5 Volts monitor |  |
| _ROLL_ROT | 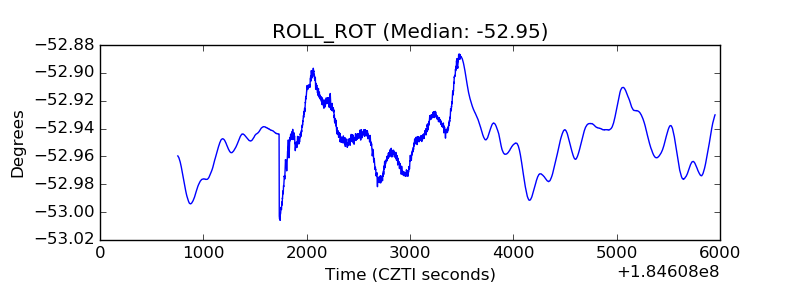 |
| _Roll_DEC | 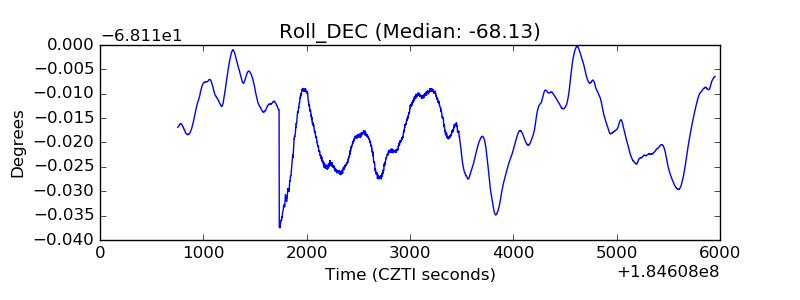 |
| _Roll_RA | 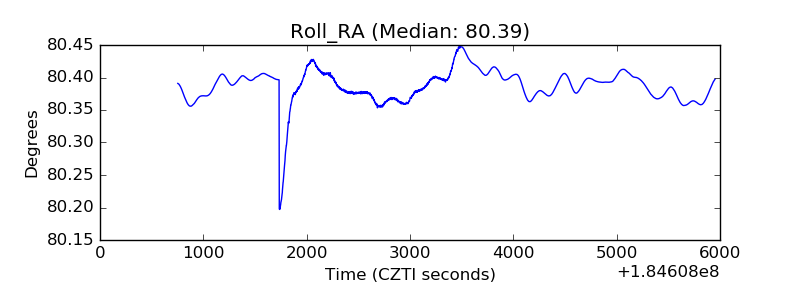 |
| Veto Counter | 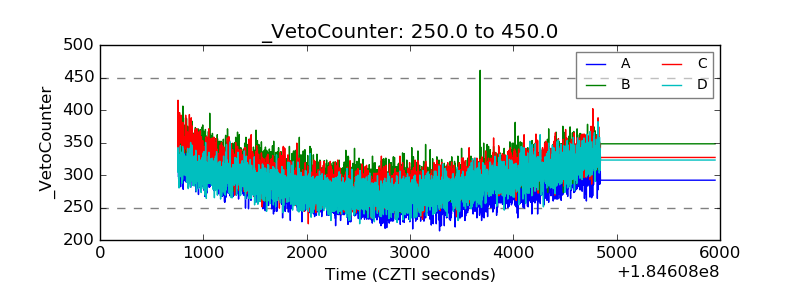 |