| Param | Original file | Final file |
|---|---|---|
| Filename | modeM0/AS1P01_126T01_9000000084_00602cztM0_level2.evt | modeM0/AS1P01_126T01_9000000084_00602cztM0_level2_quad_clean.evt |
| Size (bytes) | 757,673,280 | 70,848,000 |
| Size | 722.6 MB | 67.6 MB |
| Events in quadrant A | 5,884,148 | 452,912 |
| Events in quadrant B | 5,947,528 | 458,406 |
| Events in quadrant C | 5,313,978 | 448,164 |
| Events in quadrant D | 5,467,967 | 435,790 |
| Mode M9 | |||
|---|---|---|---|
| Quadrant | BADHDUFLAG | Total packets | Discarded packets |
| A | 0 | 26 | 0 |
| B | 0 | 26 | 0 |
| C | 0 | 26 | 0 |
| D | 0 | 27 | 0 |
| Mode M0 | |||
|---|---|---|---|
| Quadrant | BADHDUFLAG | Total packets | Discarded packets |
| A | 0 | 21082 | 3 |
| B | 0 | 21229 | 2 |
| C | 0 | 19355 | 2 |
| D | 0 | 19811 | 2 |
| Mode SS | |||
|---|---|---|---|
| Quadrant | BADHDUFLAG | Total packets | Discarded packets |
| A | 0 | 100 | 0 |
| B | 0 | 100 | 0 |
| C | 0 | 100 | 0 |
| D | 0 | 100 | 0 |
| Quadrant | Total seconds | Saturated seconds | Saturation percentage |
|---|---|---|---|
| A | 4997 | 7 | 0.140084% |
| B | 4997 | 19 | 0.380228% |
| C | 4997 | 3 | 0.060036% |
| D | 4997 | 47 | 0.940564% |
Noise dominated data is calculated using 1-second bins in cleaned event files. If a bin has >2000 counts, and if more than 50% of those come from <1% of pixels, then it is considered to be noise-dominated and hence unusable.
| Quadrant | # 1 sec bins | Bins with >0 counts | Bins with >2000 counts | High rate bins dominated by noise | Noise dominated (total time) | Noise dominated (detector-on time) | Marked lightcurve |
|---|---|---|---|---|---|---|---|
| A | 7152 | 4998 | 123 | 123 | 1.72% | 2.46% | 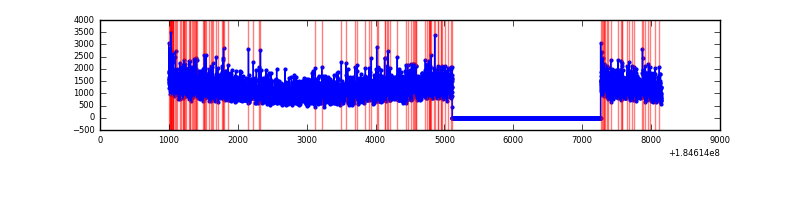 |
| B | 7152 | 4998 | 123 | 123 | 1.72% | 2.46% | 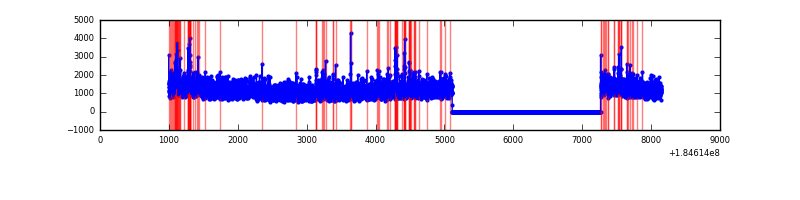 |
| C | 7152 | 4998 | 31 | 31 | 0.43% | 0.62% | 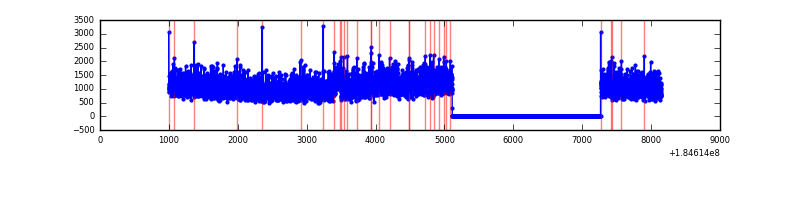 |
| D | 7152 | 4998 | 131 | 131 | 1.83% | 2.62% | 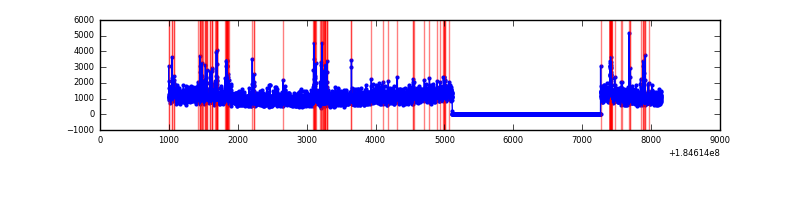 |
Top three noisy pixels from each quadrant. If the there are fewer than three noisy pixels in the level2.evt file, extra rows are filled as -1
| Pixel properties | Quadrant properties | ||||||
|---|---|---|---|---|---|---|---|
| Quadrant | DetID | PixID | Counts | Sigma | Mean | Median | Sigma |
| A | 13 | 160 | 117300 | 350.03 | 1463 | 1447 | 331.0 |
| A | 0 | 69 | 30374 | 87.4 | 1463 | 1447 | 331.0 |
| A | 0 | 238 | 26407 | 75.41 | 1463 | 1447 | 331.0 |
| B | 5 | 191 | 134551 | 382.31 | 1484 | 1492 | 348.0 |
| B | 4 | 250 | 48635 | 135.45 | 1484 | 1492 | 348.0 |
| B | 7 | 221 | 45067 | 125.2 | 1484 | 1492 | 348.0 |
| C | 9 | 54 | 43003 | 111.95 | 1332 | 1381 | 371.8 |
| C | 15 | 241 | 16585 | 40.89 | 1332 | 1381 | 371.8 |
| C | 1 | 1 | 13929 | 33.75 | 1332 | 1381 | 371.8 |
| D | 13 | 221 | 175075 | 442.61 | 1244 | 1292 | 392.6 |
| D | 12 | 237 | 171584 | 433.72 | 1244 | 1292 | 392.6 |
| D | 1 | 4 | 169942 | 429.54 | 1244 | 1292 | 392.6 |
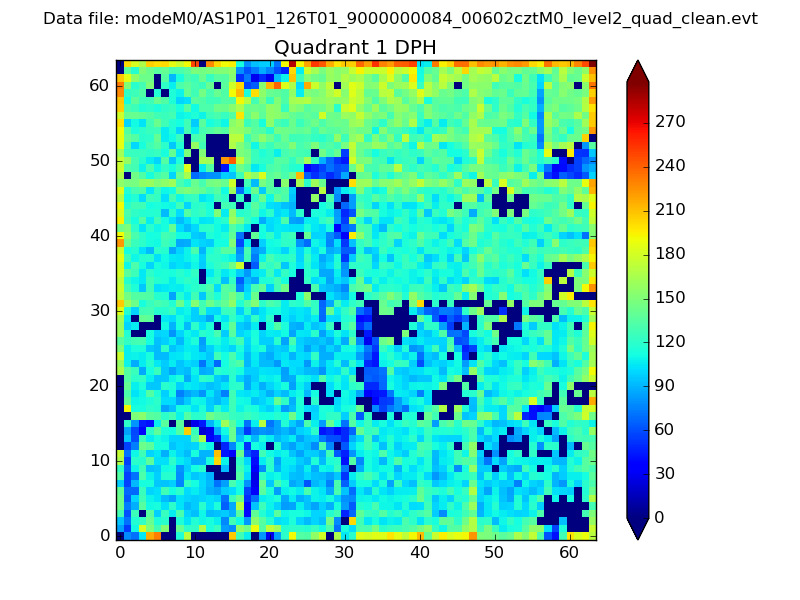
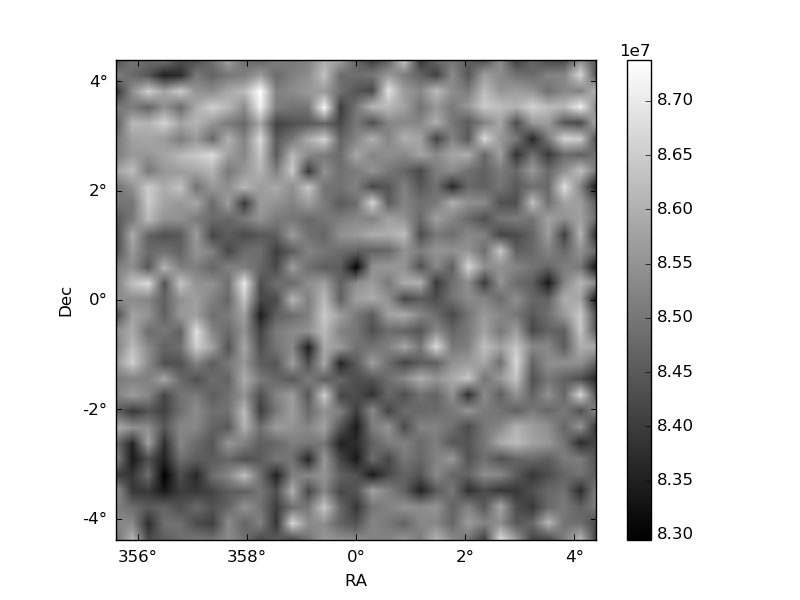
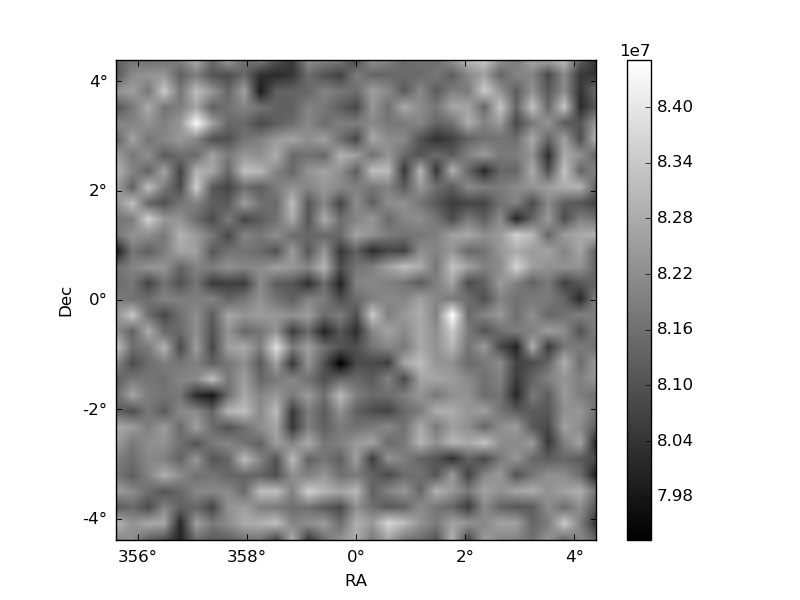
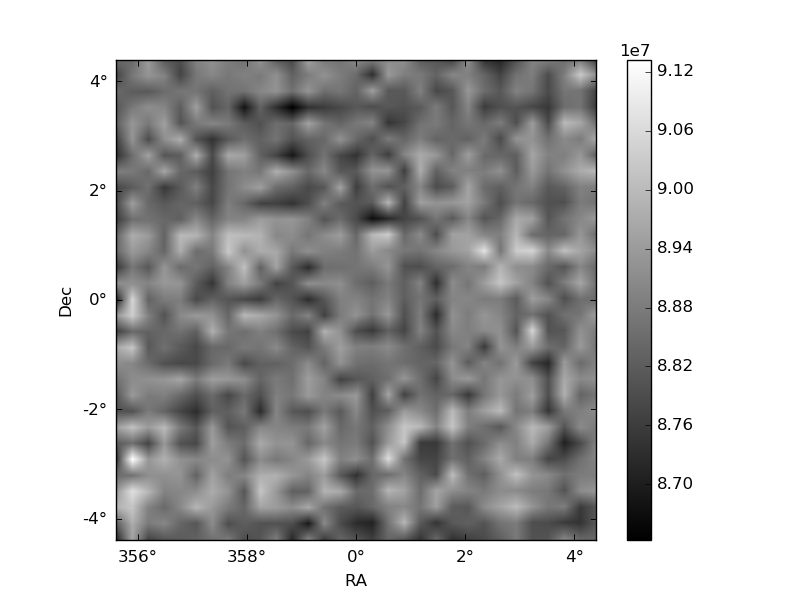
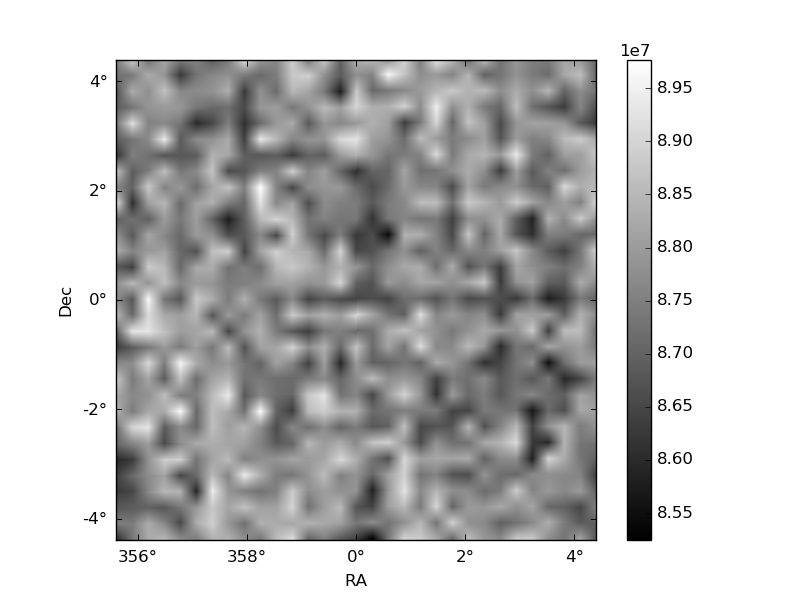
Histogram calculated using DETX and DETY for each event in the final _common_clean file
| Quadrant A |  |
 |
Quadrant B |
|---|---|---|---|
| Quadrant D | 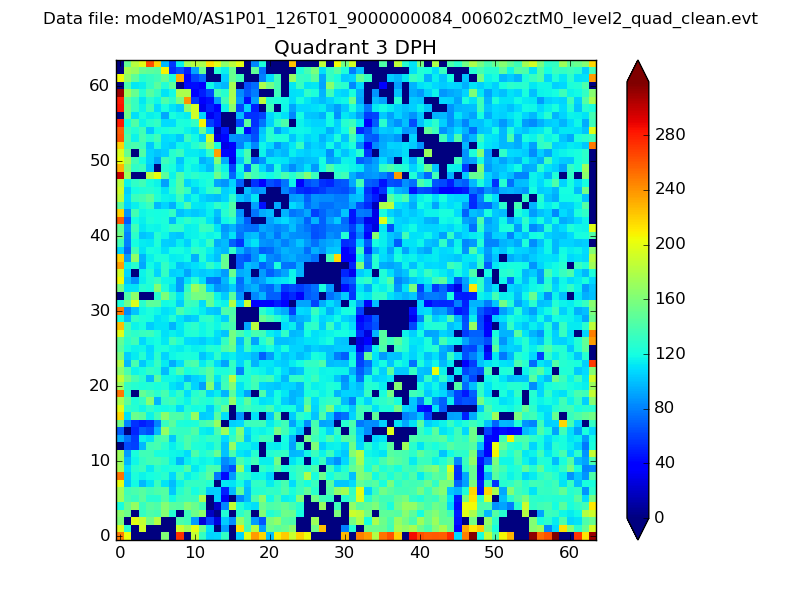 |
 |
Quadrant C |
| Plot type | Count rate plots | Images |
|---|---|---|
| Comparison with Poisson distribution Blue bars denote a histogram of data divided into 1 sec bins. Red curve is a Poisson curve with rate = median count rate of data. |
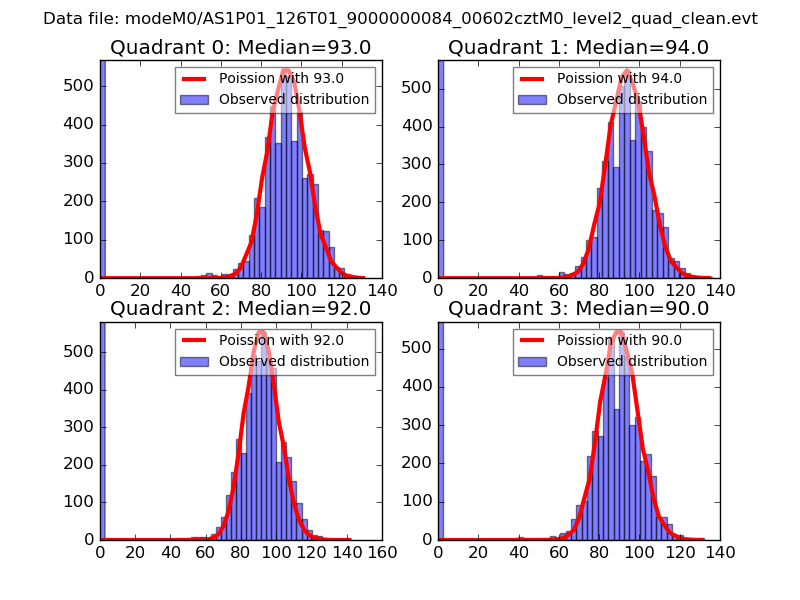 |
 |
| Quadrant-wise count rates Data is divided into 100 sec bins |
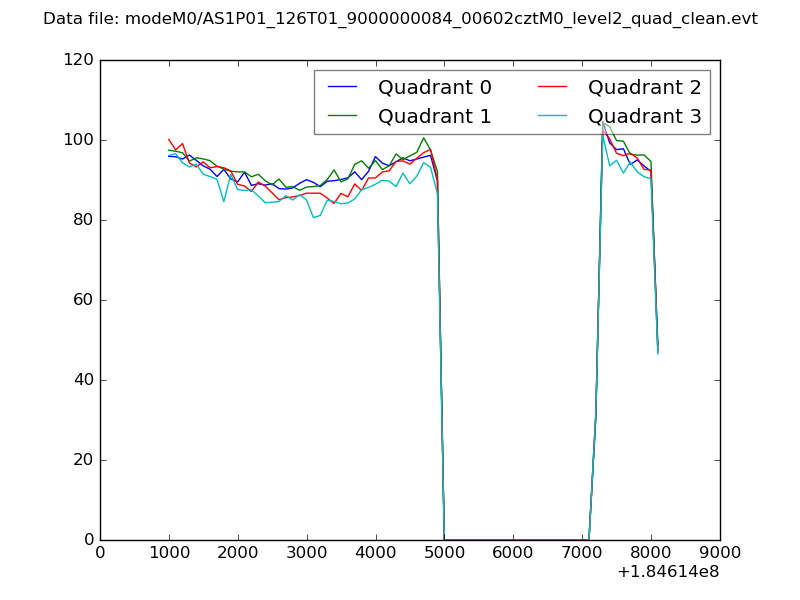 |
|
| Module-wise count rates for Quadrant A Data is divided into 100 sec bins |
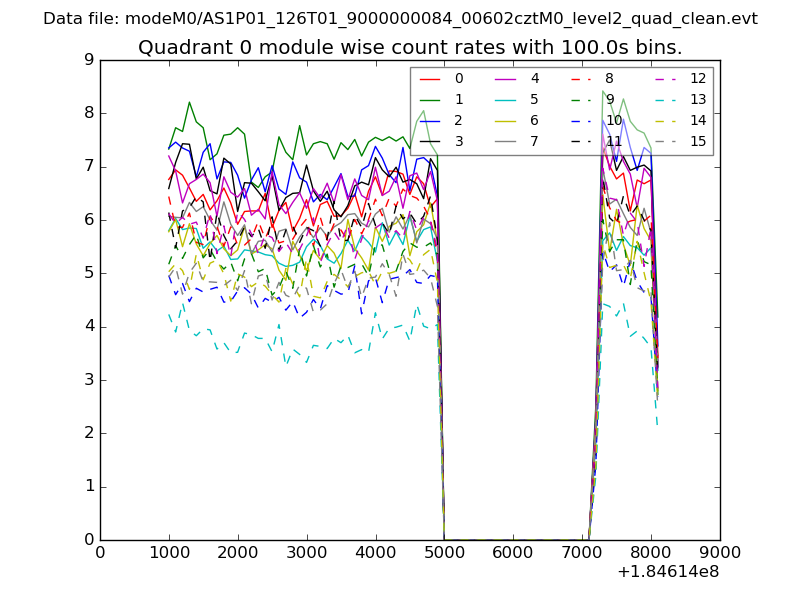 |
 |
| Module-wise count rates for Quadrant B Data is divided into 100 sec bins |
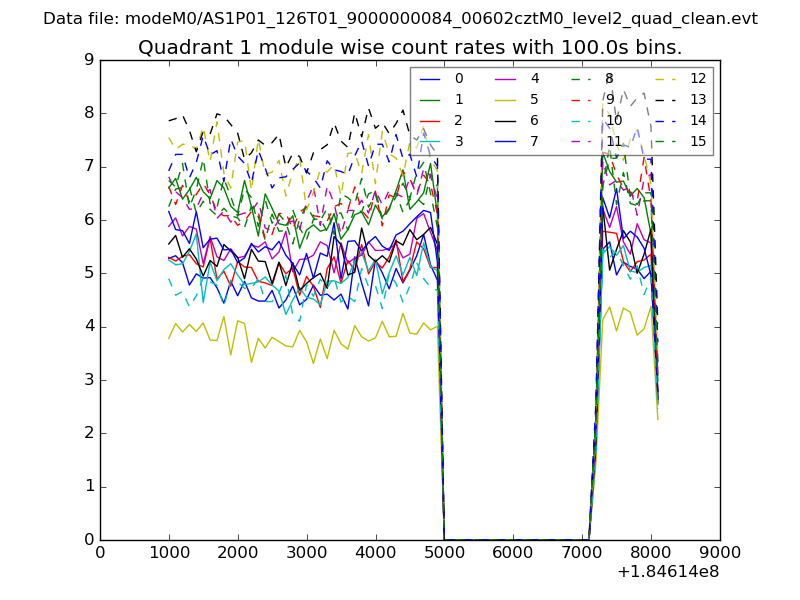 |
 |
| Module-wise count rates for Quadrant C Data is divided into 100 sec bins |
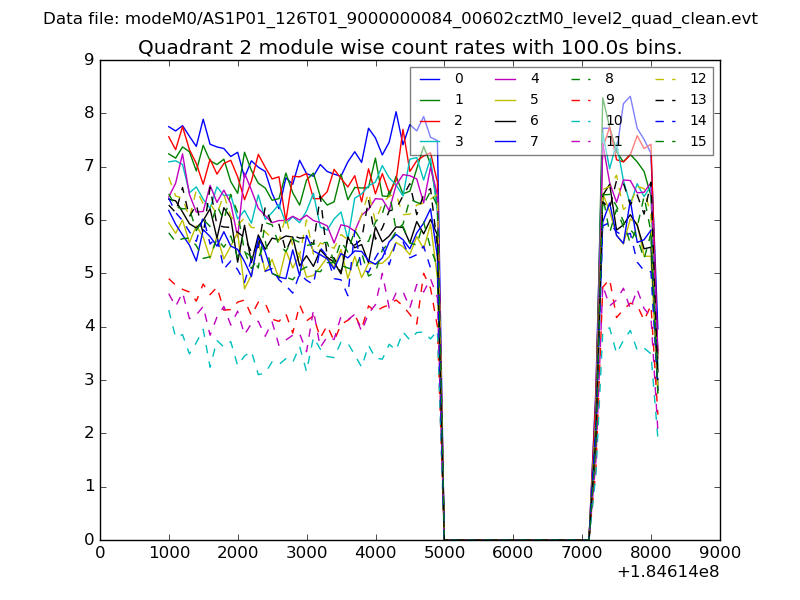 |
 |
| Module-wise count rates for Quadrant D Data is divided into 100 sec bins |
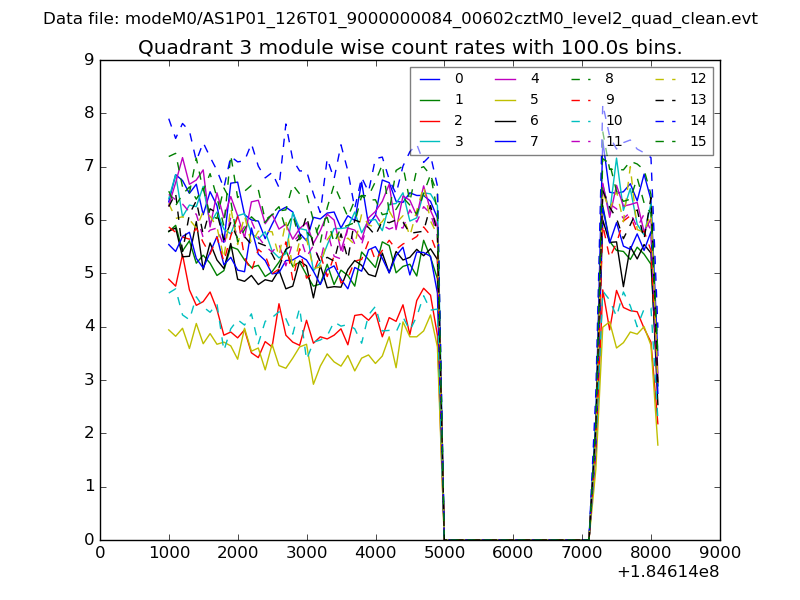 |
 |
| Parameter | Plot |
|---|---|
| CZT HV Monitor | 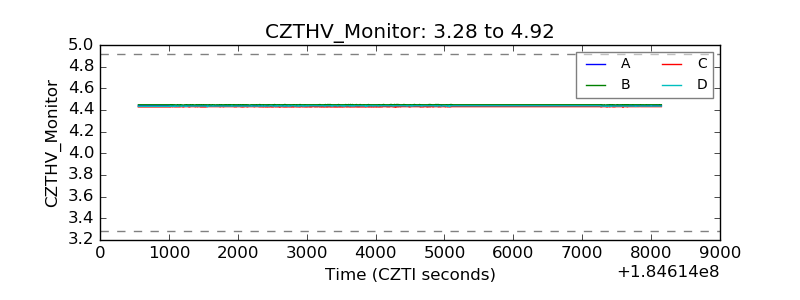 |
| D_VDD | 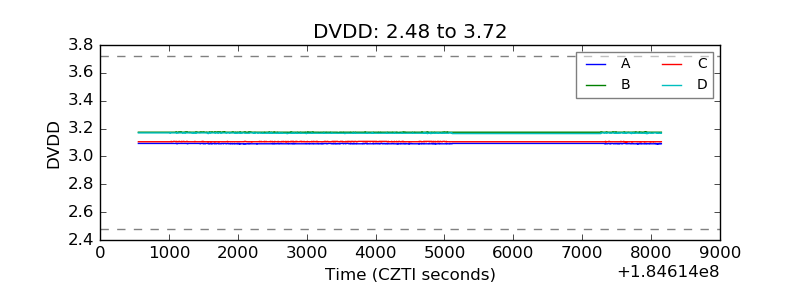 |
| Temperature 1 | 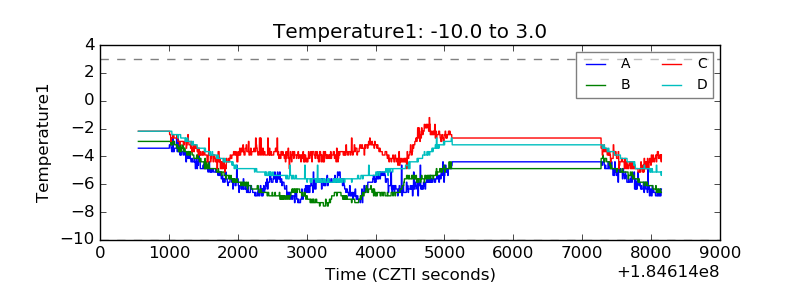 |
| Veto HV Monitor | 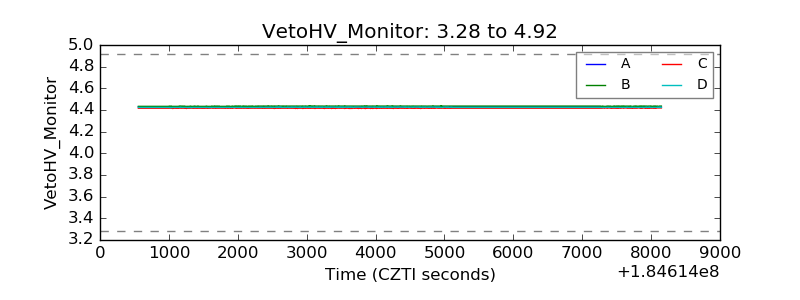 |
| Veto LLD | 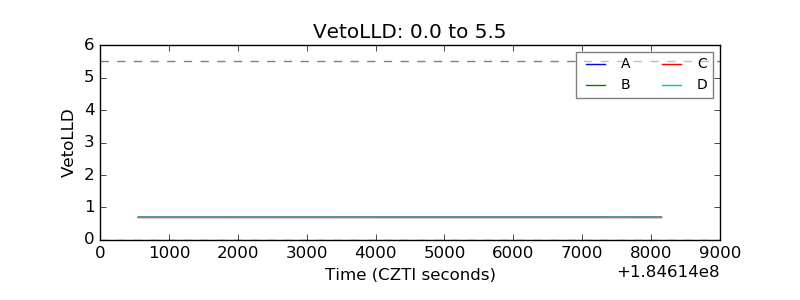 |
| Alpha Counter | 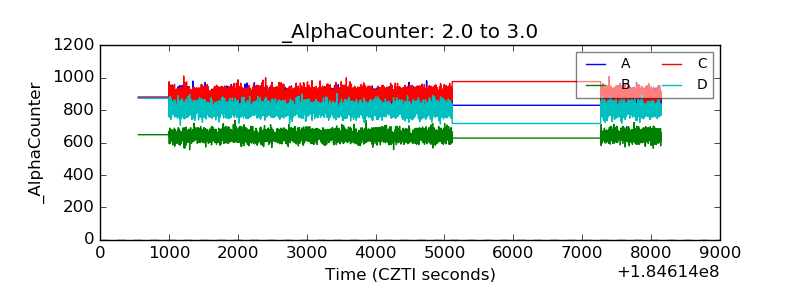 |
| _CPM_Rate | 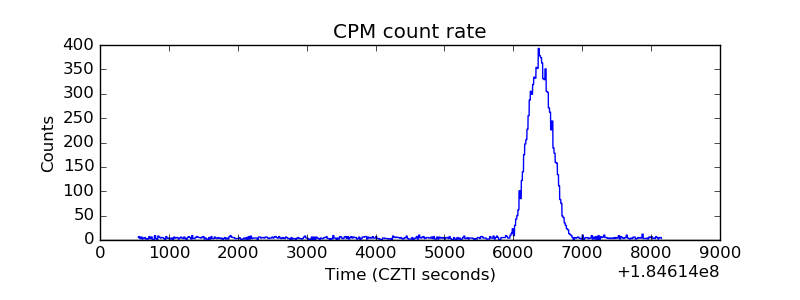 |
| CZT Counter | 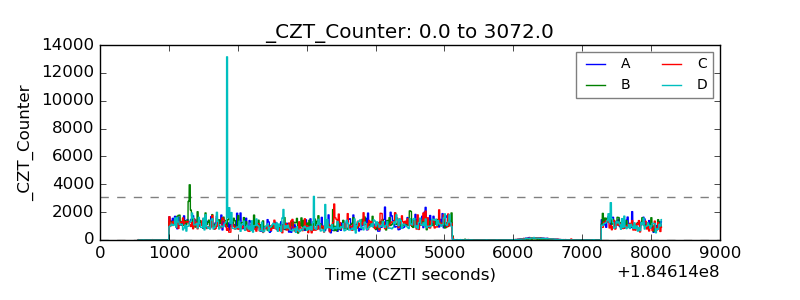 |
| +2.5 Volts monitor |  |
| +5 Volts monitor | 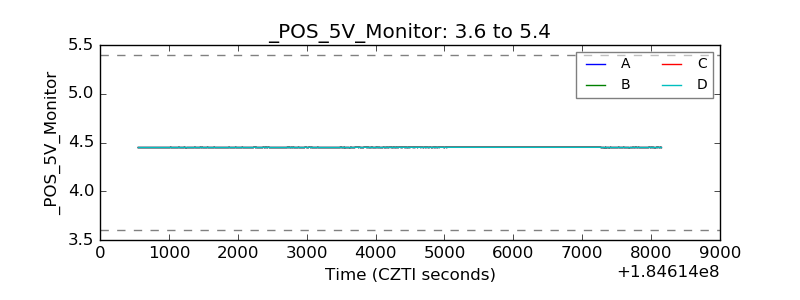 |
| _ROLL_ROT | 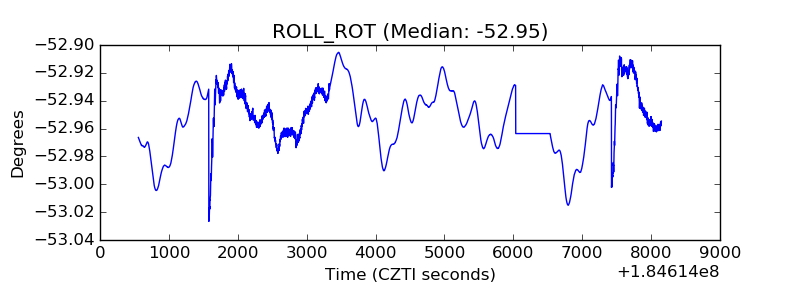 |
| _Roll_DEC | 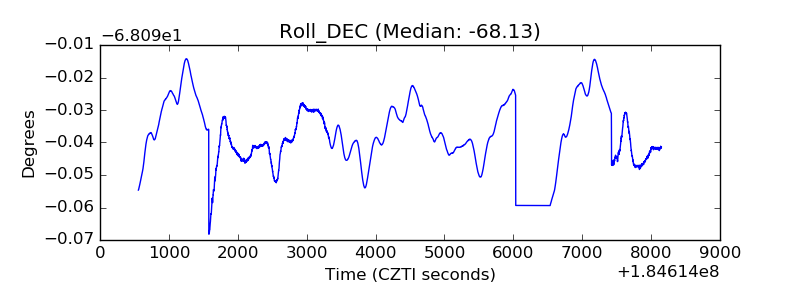 |
| _Roll_RA | 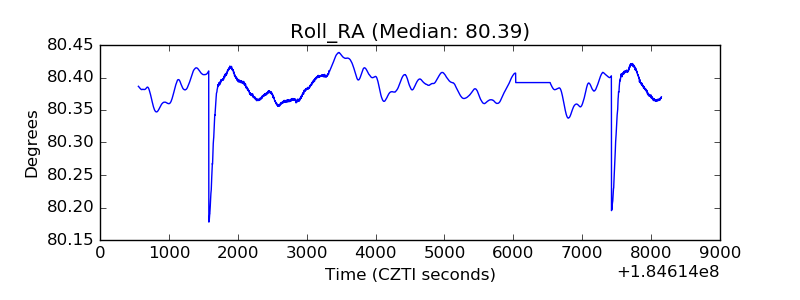 |
| Veto Counter | 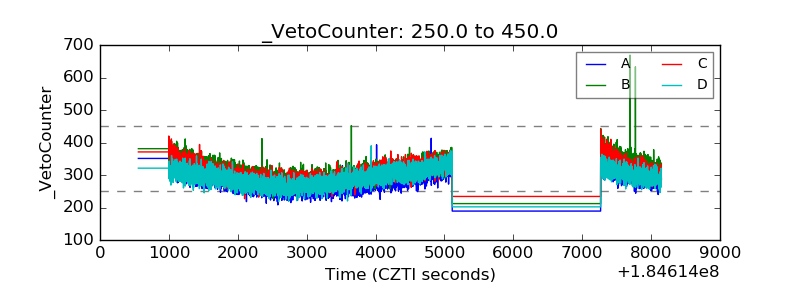 |