| Param | Original file | Final file |
|---|---|---|
| Filename | modeM0/AS1P01_126T01_9000000084_00603cztM0_level2.evt | modeM0/AS1P01_126T01_9000000084_00603cztM0_level2_quad_clean.evt |
| Size (bytes) | 792,054,720 | 69,264,000 |
| Size | 755.4 MB | 66.1 MB |
| Events in quadrant A | 6,075,301 | 438,657 |
| Events in quadrant B | 6,299,767 | 441,899 |
| Events in quadrant C | 5,611,932 | 431,545 |
| Events in quadrant D | 5,653,299 | 419,973 |
| Mode M9 | |||
|---|---|---|---|
| Quadrant | BADHDUFLAG | Total packets | Discarded packets |
| A | 0 | 28 | 0 |
| B | 0 | 28 | 0 |
| C | 0 | 28 | 0 |
| D | 0 | 29 | 0 |
| Mode M0 | |||
|---|---|---|---|
| Quadrant | BADHDUFLAG | Total packets | Discarded packets |
| A | 0 | 21741 | 3 |
| B | 0 | 22437 | 2 |
| C | 0 | 20395 | 2 |
| D | 0 | 20534 | 2 |
| Mode SS | |||
|---|---|---|---|
| Quadrant | BADHDUFLAG | Total packets | Discarded packets |
| A | 0 | 106 | 0 |
| B | 0 | 106 | 0 |
| C | 0 | 106 | 0 |
| D | 0 | 106 | 0 |
| Quadrant | Total seconds | Saturated seconds | Saturation percentage |
|---|---|---|---|
| A | 5213 | 8 | 0.153462% |
| B | 5213 | 67 | 1.285248% |
| C | 5213 | 4 | 0.076731% |
| D | 5213 | 36 | 0.690581% |
Noise dominated data is calculated using 1-second bins in cleaned event files. If a bin has >2000 counts, and if more than 50% of those come from <1% of pixels, then it is considered to be noise-dominated and hence unusable.
| Quadrant | # 1 sec bins | Bins with >0 counts | Bins with >2000 counts | High rate bins dominated by noise | Noise dominated (total time) | Noise dominated (detector-on time) | Marked lightcurve |
|---|---|---|---|---|---|---|---|
| A | 7367 | 5214 | 117 | 117 | 1.59% | 2.24% | 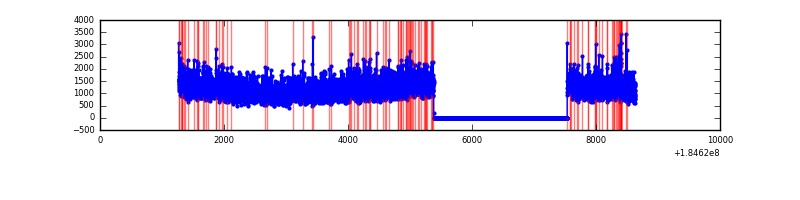 |
| B | 7367 | 5214 | 169 | 169 | 2.29% | 3.24% | 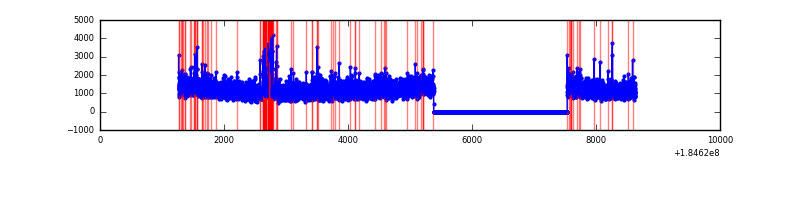 |
| C | 7367 | 5214 | 38 | 38 | 0.52% | 0.73% | 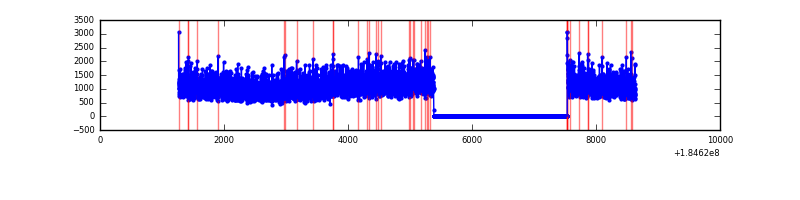 |
| D | 7367 | 5214 | 124 | 124 | 1.68% | 2.38% | 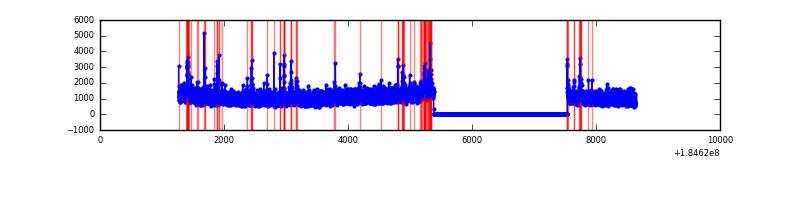 |
Top three noisy pixels from each quadrant. If the there are fewer than three noisy pixels in the level2.evt file, extra rows are filled as -1
| Pixel properties | Quadrant properties | ||||||
|---|---|---|---|---|---|---|---|
| Quadrant | DetID | PixID | Counts | Sigma | Mean | Median | Sigma |
| A | 13 | 160 | 75489 | 217.34 | 1508 | 1484 | 340.5 |
| A | 0 | 149 | 71178 | 204.68 | 1508 | 1484 | 340.5 |
| A | 0 | 69 | 44663 | 126.81 | 1508 | 1484 | 340.5 |
| B | 5 | 191 | 236224 | 654.23 | 1534 | 1547 | 358.7 |
| B | 7 | 221 | 69812 | 190.31 | 1534 | 1547 | 358.7 |
| B | 4 | 250 | 60249 | 163.65 | 1534 | 1547 | 358.7 |
| C | 15 | 241 | 81951 | 205.32 | 1400 | 1452 | 392.1 |
| C | 1 | 1 | 20700 | 49.09 | 1400 | 1452 | 392.1 |
| C | 9 | 83 | 7448 | 15.29 | 1400 | 1452 | 392.1 |
| D | 12 | 237 | 219872 | 536.63 | 1305 | 1354 | 407.2 |
| D | 1 | 4 | 163718 | 398.73 | 1305 | 1354 | 407.2 |
| D | 13 | 221 | 69209 | 166.64 | 1305 | 1354 | 407.2 |
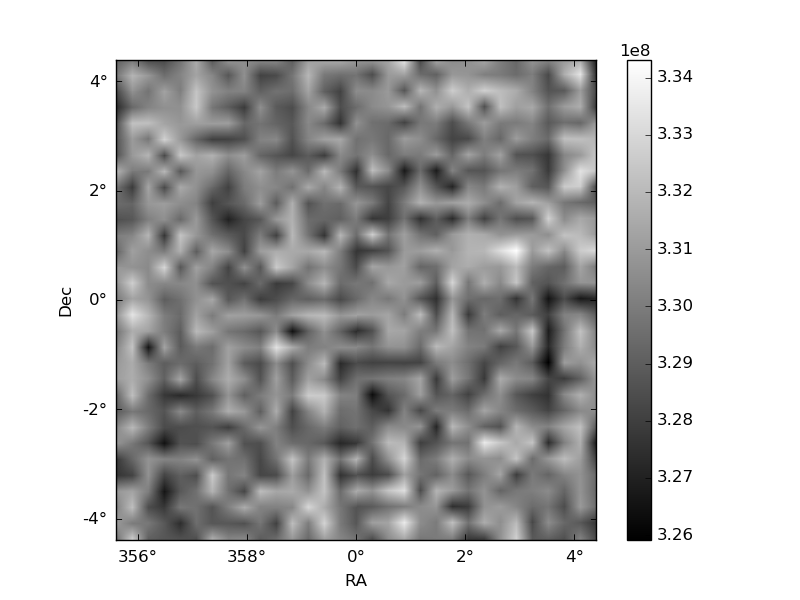
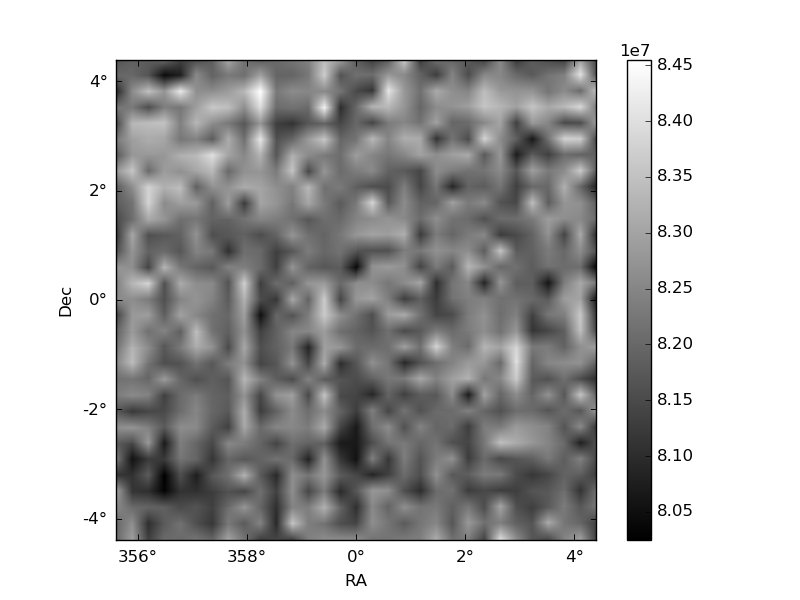
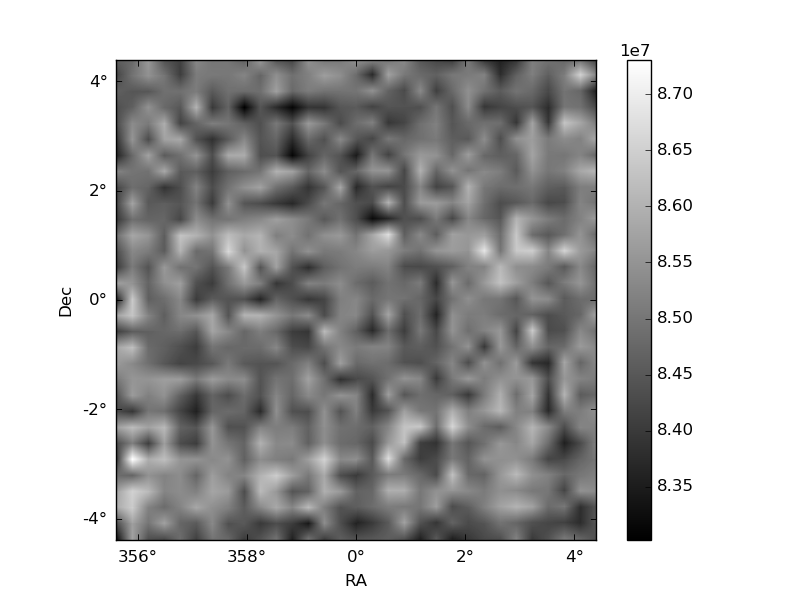
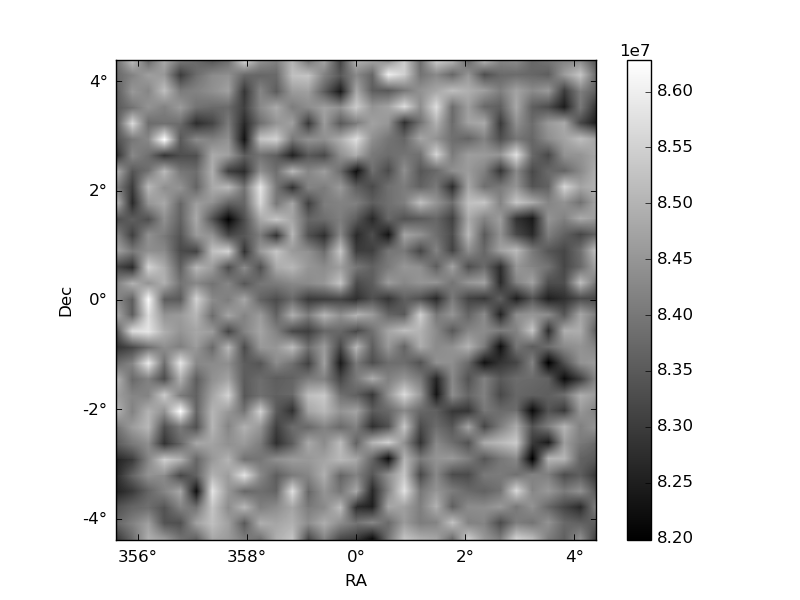
Histogram calculated using DETX and DETY for each event in the final _common_clean file
| Quadrant A | 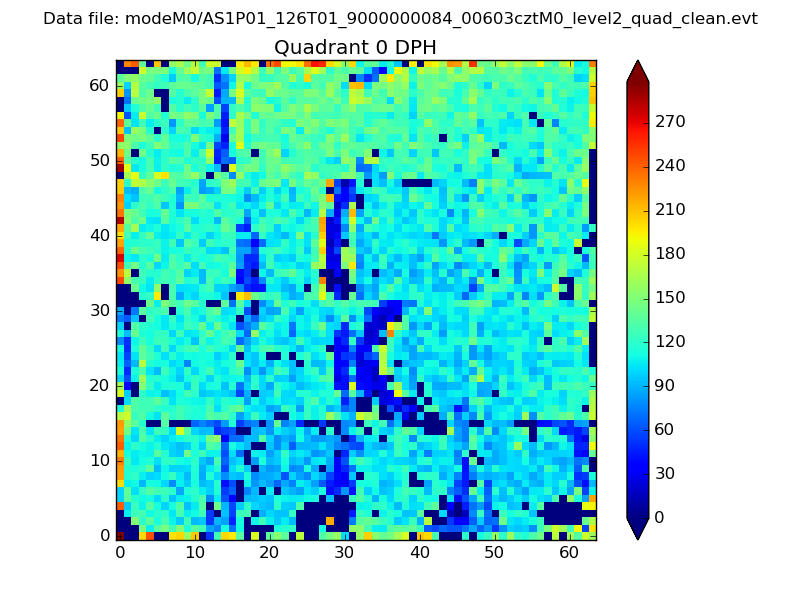 |
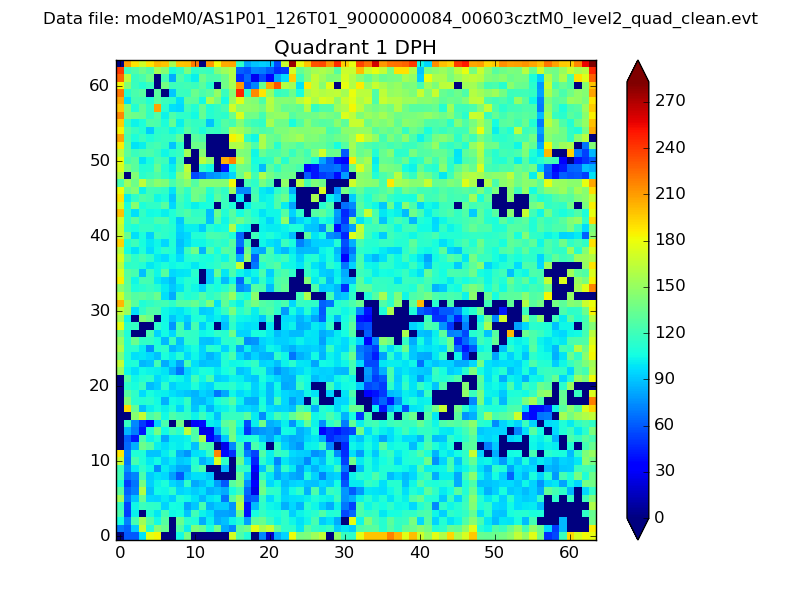 |
Quadrant B |
|---|---|---|---|
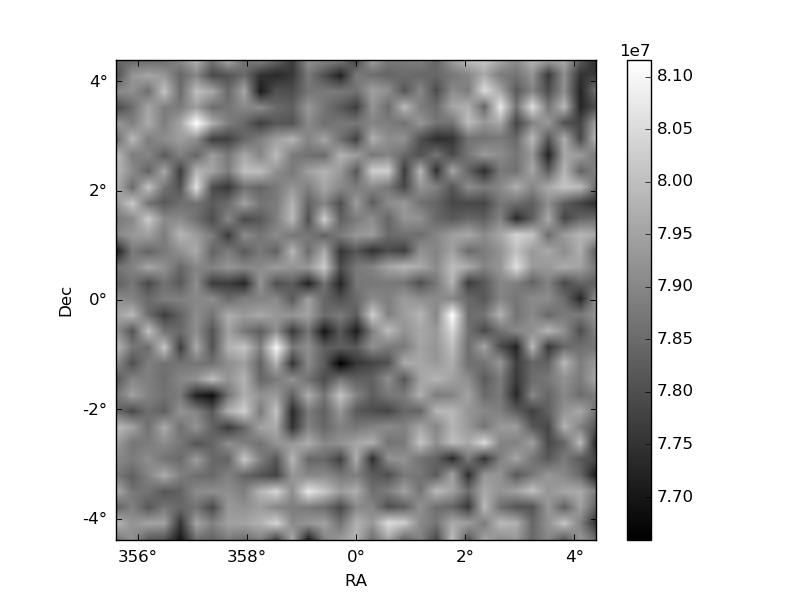
| Quadrant D | 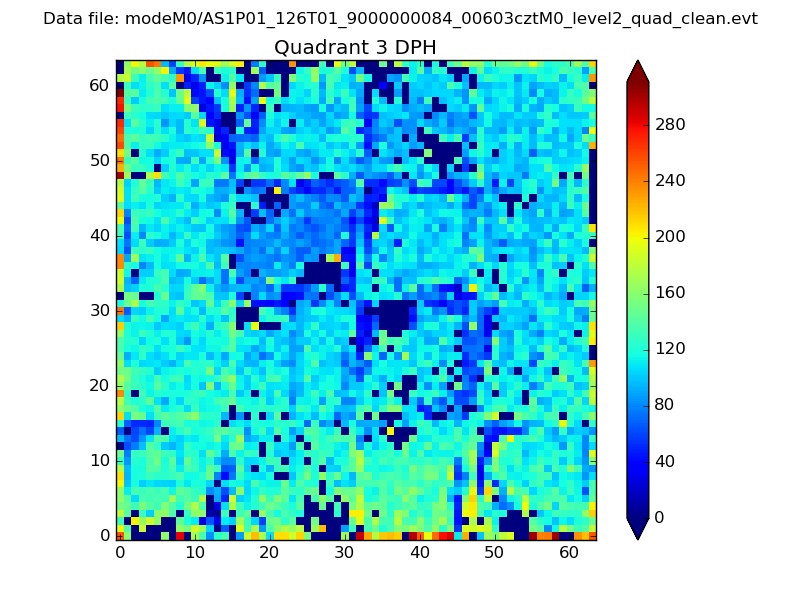 |
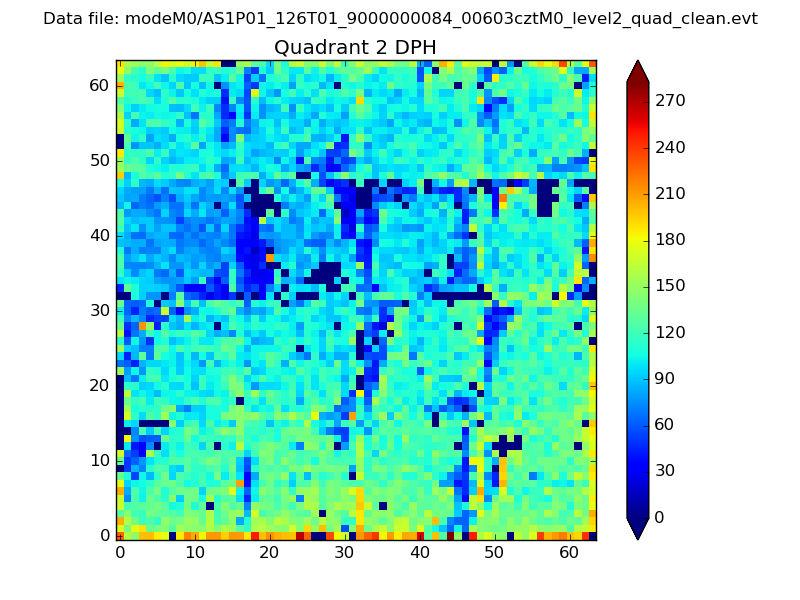 |
Quadrant C |
| Plot type | Count rate plots | Images |
|---|---|---|
| Comparison with Poisson distribution Blue bars denote a histogram of data divided into 1 sec bins. Red curve is a Poisson curve with rate = median count rate of data. |
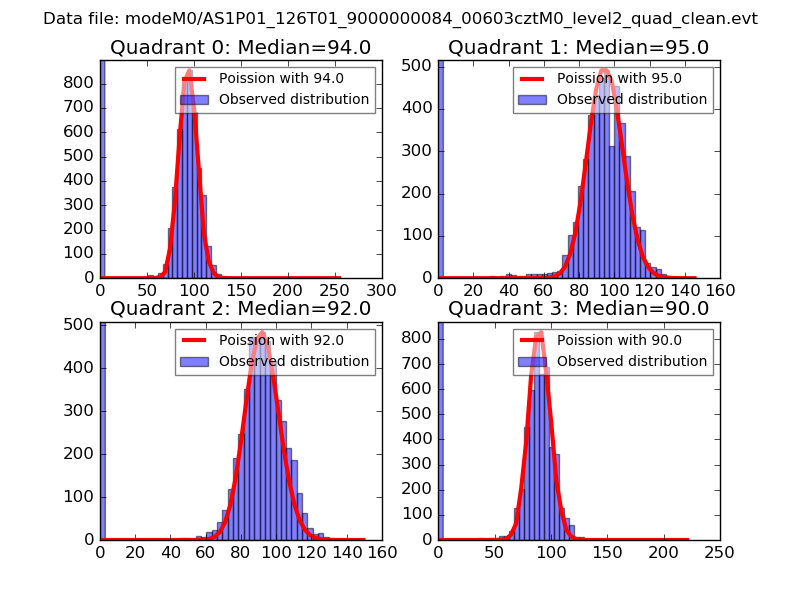 |
 |
| Quadrant-wise count rates Data is divided into 100 sec bins |
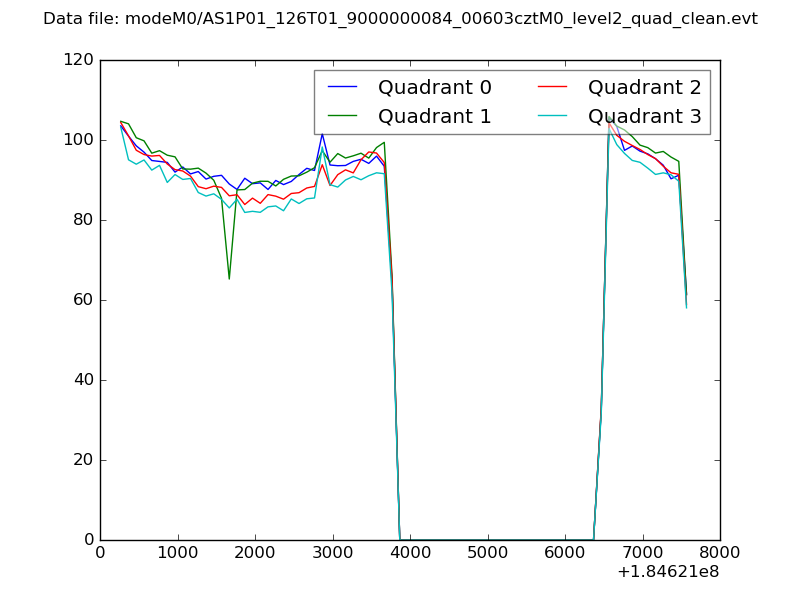 |
|
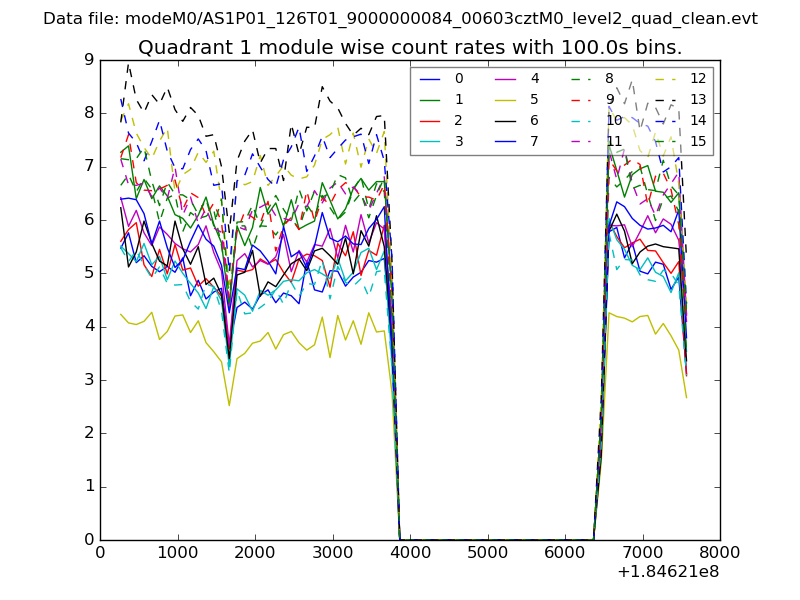
| Module-wise count rates for Quadrant A Data is divided into 100 sec bins |
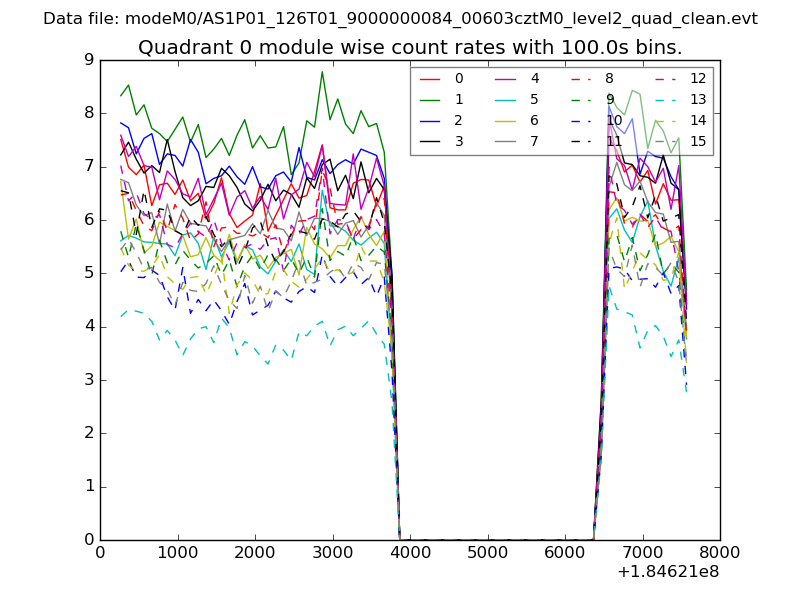 |
 |
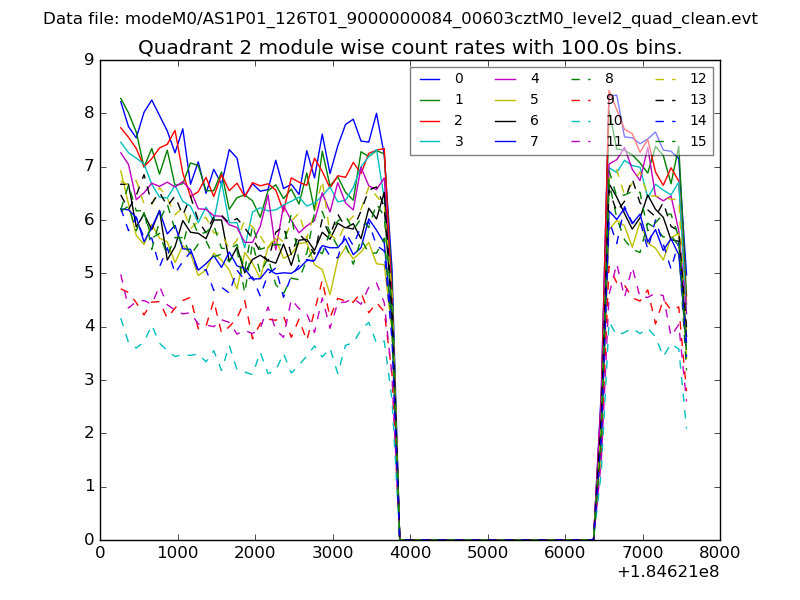
| Module-wise count rates for Quadrant B Data is divided into 100 sec bins |
 |
 |
| Module-wise count rates for Quadrant C Data is divided into 100 sec bins |
 |
 |
| Module-wise count rates for Quadrant D Data is divided into 100 sec bins |
 |
 |
| Parameter | Plot |
|---|---|
| CZT HV Monitor | 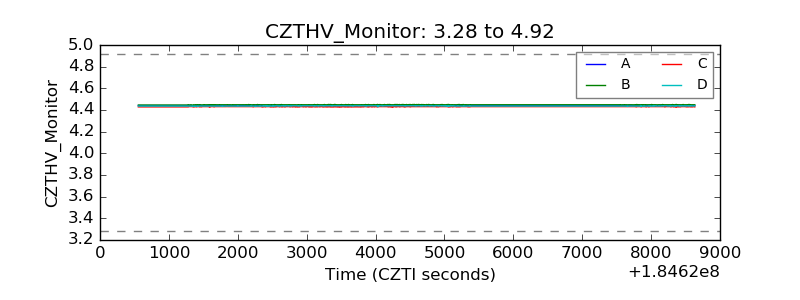 |
| D_VDD | 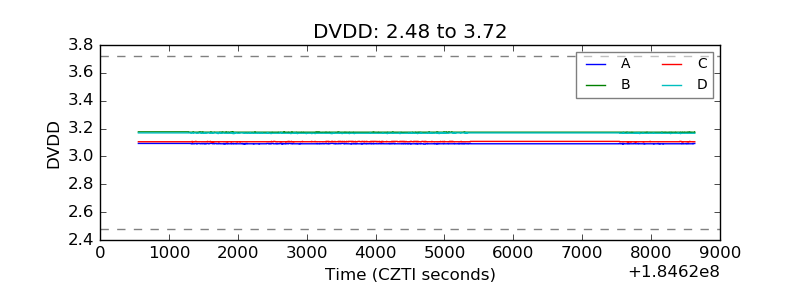 |
| Temperature 1 |  |
| Veto HV Monitor | 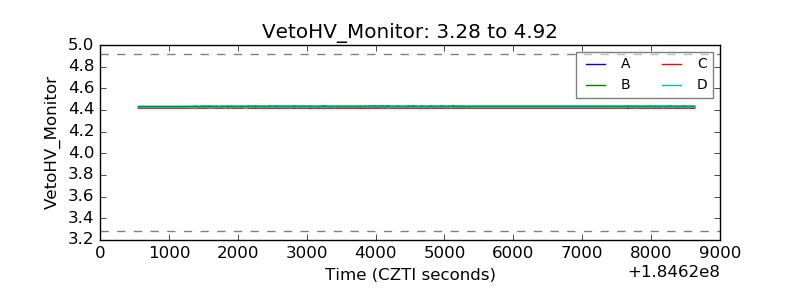 |
| Veto LLD | 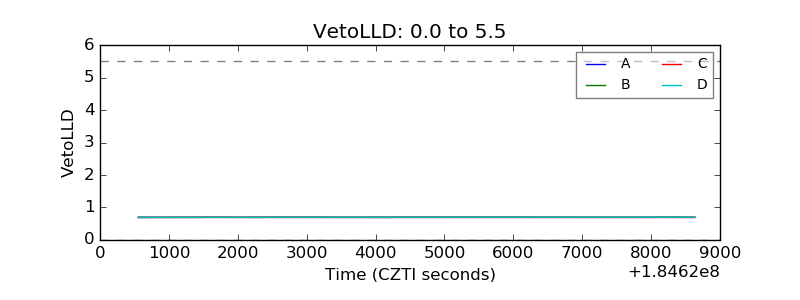 |
| Alpha Counter | 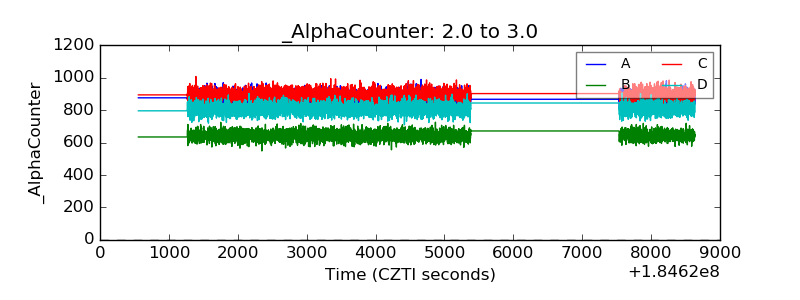 |
| _CPM_Rate | 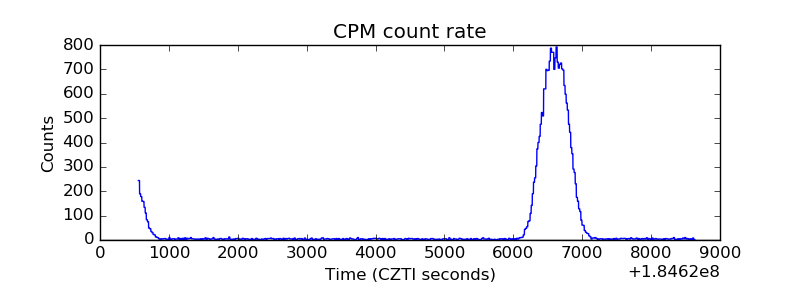 |
| CZT Counter | 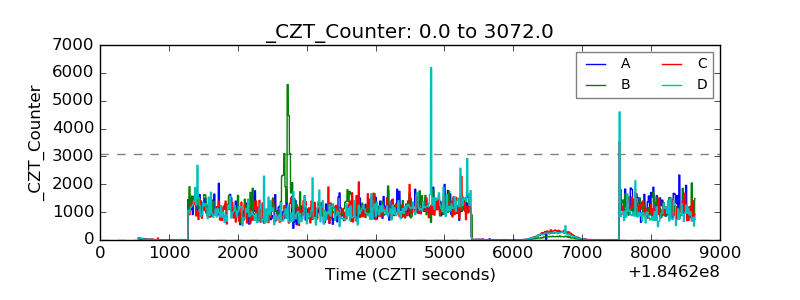 |
| +2.5 Volts monitor |  |
| +5 Volts monitor | 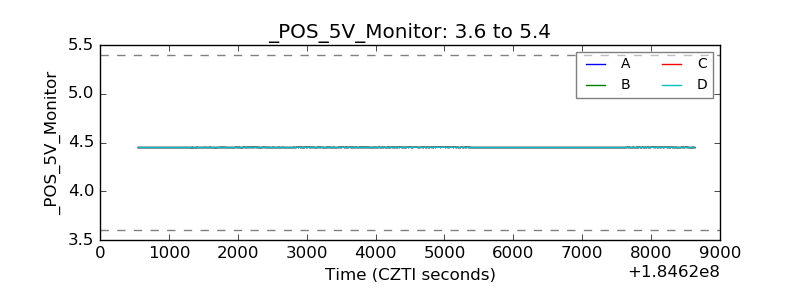 |
| _ROLL_ROT | 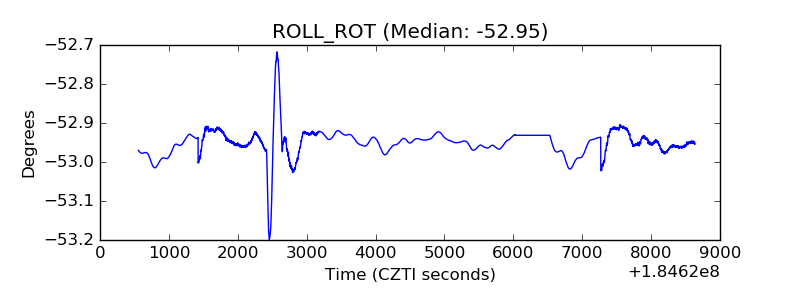 |
| _Roll_DEC | 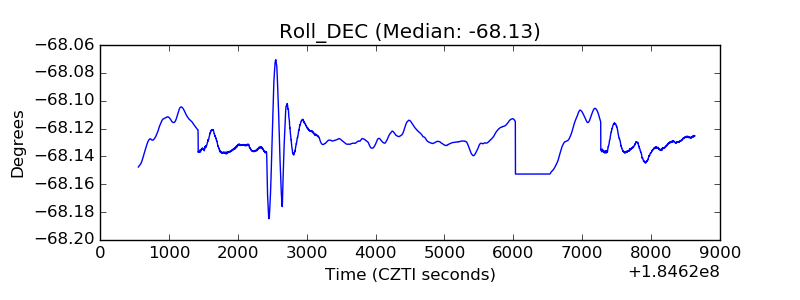 |
| _Roll_RA | 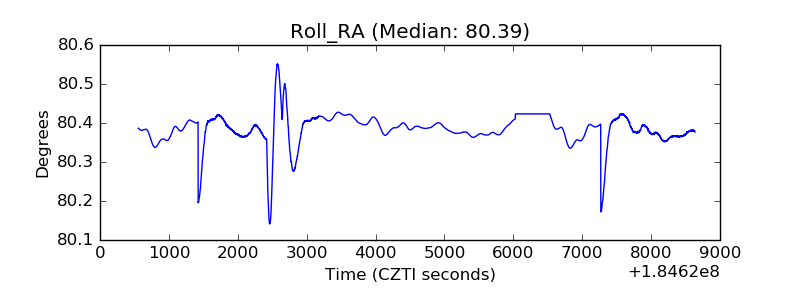 |
| Veto Counter |  |