| Param | Original file | Final file |
|---|---|---|
| Filename | modeM0/AS1P01_126T01_9000000084_00605cztM0_level2.evt | modeM0/AS1P01_126T01_9000000084_00605cztM0_level2_quad_clean.evt |
| Size (bytes) | 799,773,120 | 65,908,800 |
| Size | 762.7 MB | 62.9 MB |
| Events in quadrant A | 6,103,269 | 410,064 |
| Events in quadrant B | 6,280,761 | 418,087 |
| Events in quadrant C | 5,899,930 | 405,759 |
| Events in quadrant D | 5,587,238 | 393,631 |
| Mode M9 | |||
|---|---|---|---|
| Quadrant | BADHDUFLAG | Total packets | Discarded packets |
| A | 0 | 31 | 0 |
| B | 0 | 31 | 0 |
| C | 0 | 31 | 0 |
| D | 0 | 32 | 0 |
| Mode M0 | |||
|---|---|---|---|
| Quadrant | BADHDUFLAG | Total packets | Discarded packets |
| A | 0 | 21849 | 3 |
| B | 0 | 22390 | 2 |
| C | 0 | 21288 | 2 |
| D | 0 | 20380 | 2 |
| Mode SS | |||
|---|---|---|---|
| Quadrant | BADHDUFLAG | Total packets | Discarded packets |
| A | 0 | 106 | 0 |
| B | 0 | 106 | 0 |
| C | 0 | 106 | 0 |
| D | 0 | 106 | 0 |
| Quadrant | Total seconds | Saturated seconds | Saturation percentage |
|---|---|---|---|
| A | 5259 | 7 | 0.133105% |
| B | 5259 | 35 | 0.665526% |
| C | 5259 | 4 | 0.076060% |
| D | 5259 | 16 | 0.304240% |
Noise dominated data is calculated using 1-second bins in cleaned event files. If a bin has >2000 counts, and if more than 50% of those come from <1% of pixels, then it is considered to be noise-dominated and hence unusable.
| Quadrant | # 1 sec bins | Bins with >0 counts | Bins with >2000 counts | High rate bins dominated by noise | Noise dominated (total time) | Noise dominated (detector-on time) | Marked lightcurve |
|---|---|---|---|---|---|---|---|
| A | 7414 | 5260 | 105 | 105 | 1.42% | 2.00% | 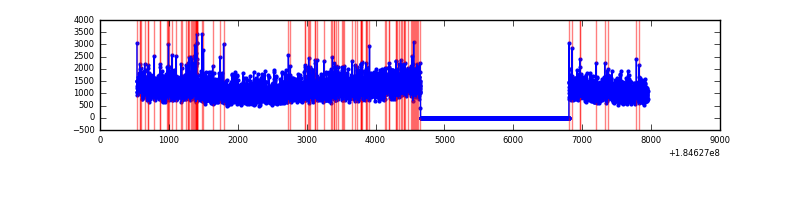 |
| B | 7414 | 5260 | 112 | 112 | 1.51% | 2.13% | 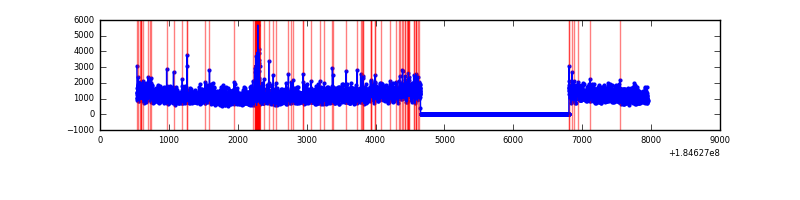 |
| C | 7414 | 5260 | 43 | 43 | 0.58% | 0.82% | 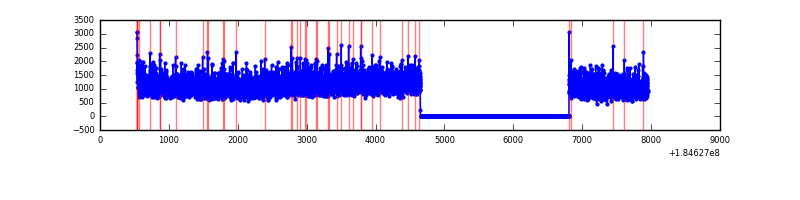 |
| D | 7414 | 5260 | 70 | 70 | 0.94% | 1.33% |  |
Top three noisy pixels from each quadrant. If the there are fewer than three noisy pixels in the level2.evt file, extra rows are filled as -1
| Pixel properties | Quadrant properties | ||||||
|---|---|---|---|---|---|---|---|
| Quadrant | DetID | PixID | Counts | Sigma | Mean | Median | Sigma |
| A | 13 | 160 | 82173 | 238.69 | 1516 | 1491 | 338.0 |
| A | 0 | 69 | 50549 | 145.13 | 1516 | 1491 | 338.0 |
| A | 0 | 149 | 50444 | 144.82 | 1516 | 1491 | 338.0 |
| B | 5 | 191 | 149880 | 414.03 | 1549 | 1560 | 358.2 |
| B | 7 | 221 | 103431 | 284.37 | 1549 | 1560 | 358.2 |
| B | 4 | 250 | 34663 | 92.41 | 1549 | 1560 | 358.2 |
| C | 15 | 241 | 191380 | 476.1 | 1436 | 1491 | 398.8 |
| C | 9 | 83 | 39307 | 94.81 | 1436 | 1491 | 398.8 |
| C | 1 | 1 | 26437 | 62.55 | 1436 | 1491 | 398.8 |
| D | 1 | 4 | 137336 | 324.4 | 1347 | 1399 | 419.0 |
| D | 13 | 221 | 89305 | 209.78 | 1347 | 1399 | 419.0 |
| D | 1 | 5 | 31752 | 72.43 | 1347 | 1399 | 419.0 |
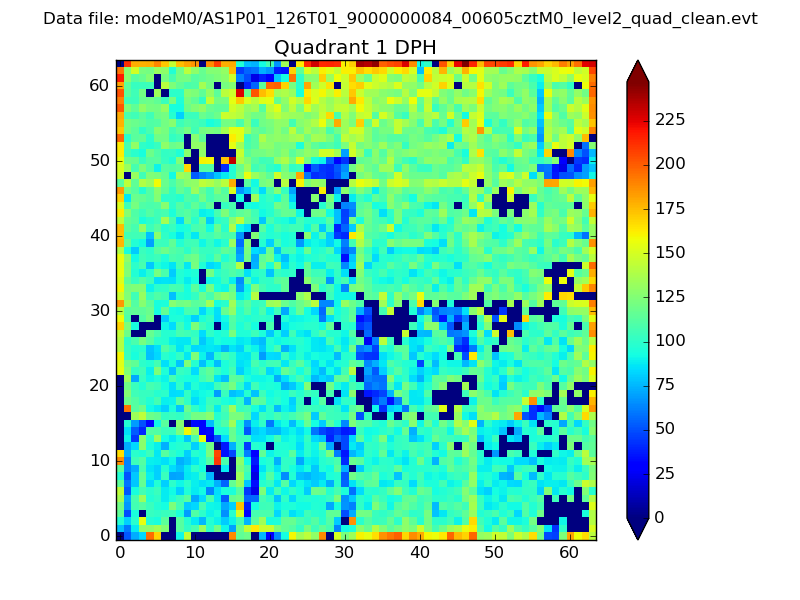
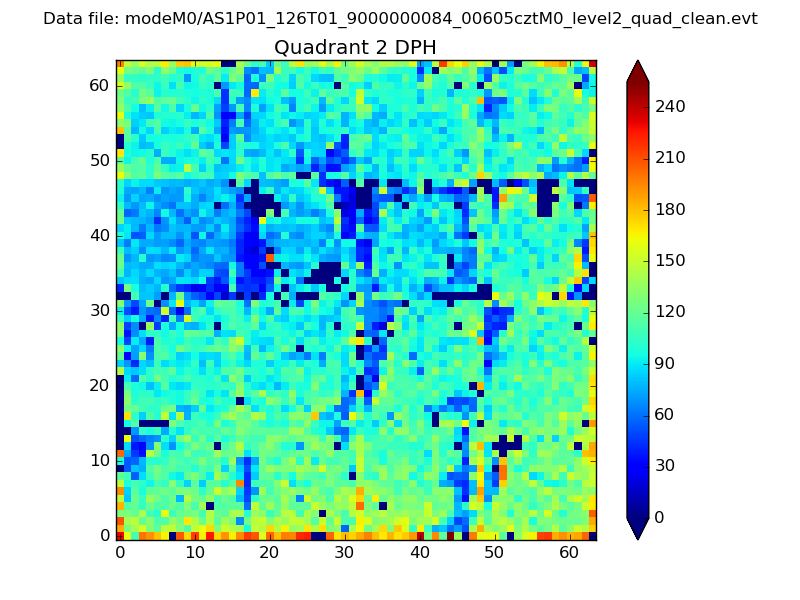
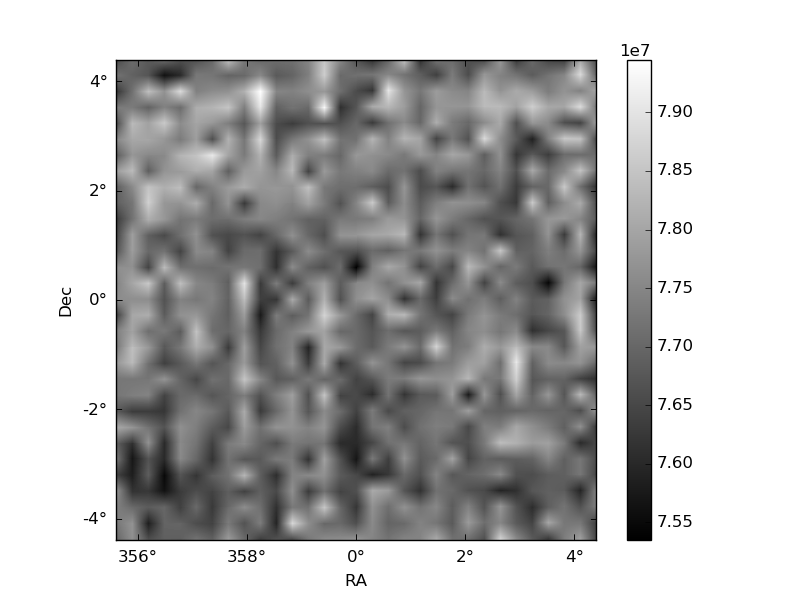
Histogram calculated using DETX and DETY for each event in the final _common_clean file
| Quadrant A | 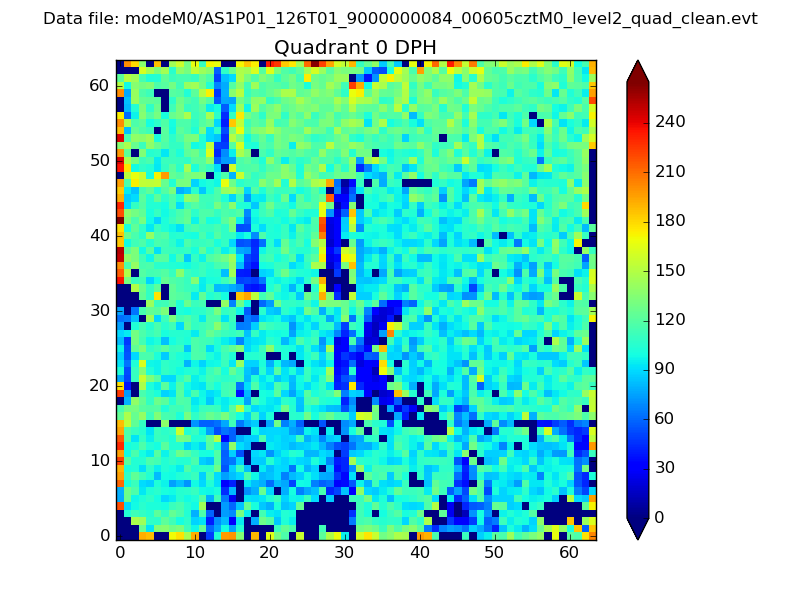 |
 |
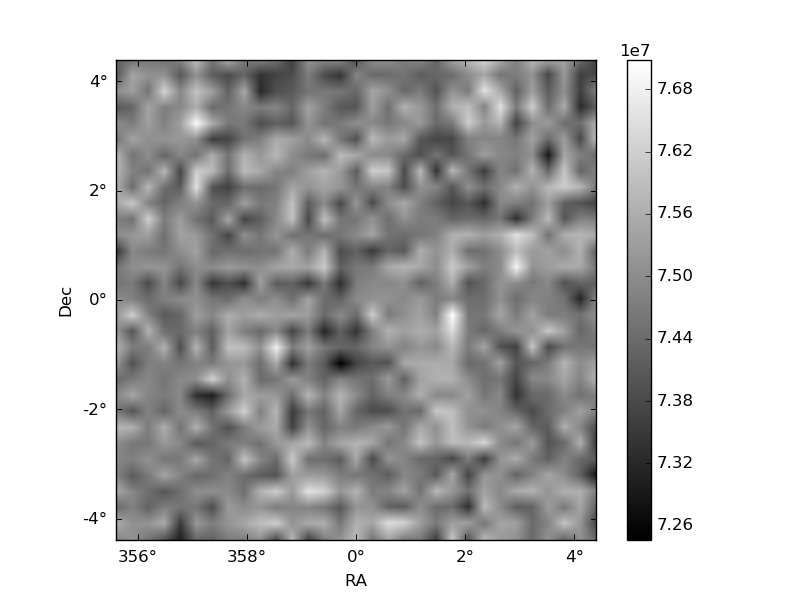
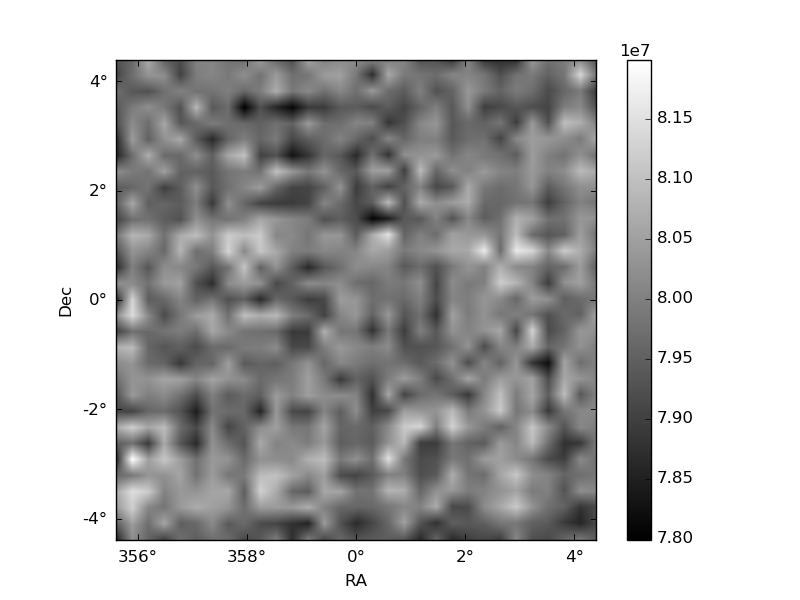
Quadrant B |
|---|---|---|---|
| Quadrant D | 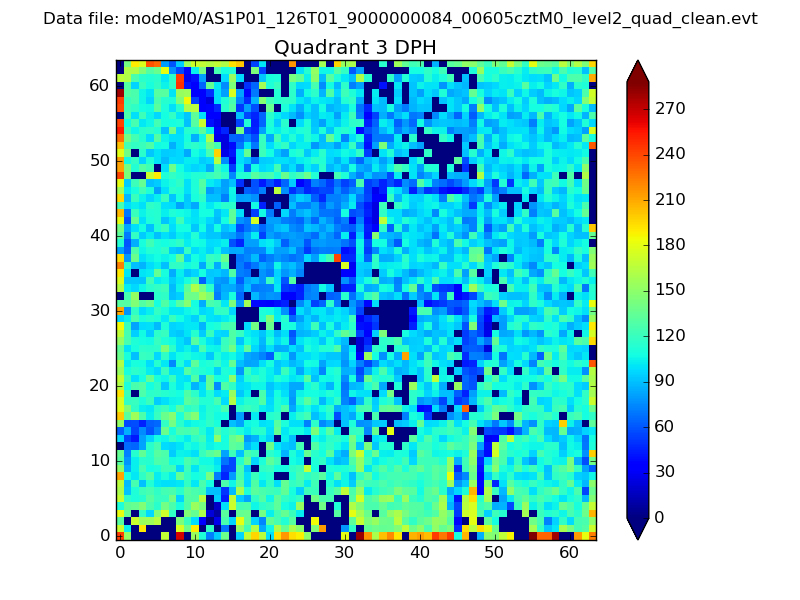 |
 |
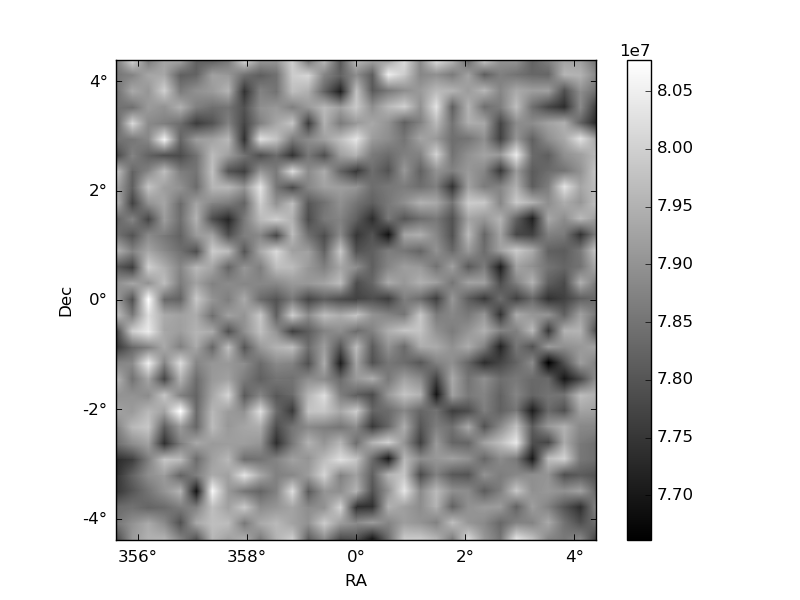
Quadrant C |
| Plot type | Count rate plots | Images |
|---|---|---|
| Comparison with Poisson distribution Blue bars denote a histogram of data divided into 1 sec bins. Red curve is a Poisson curve with rate = median count rate of data. |
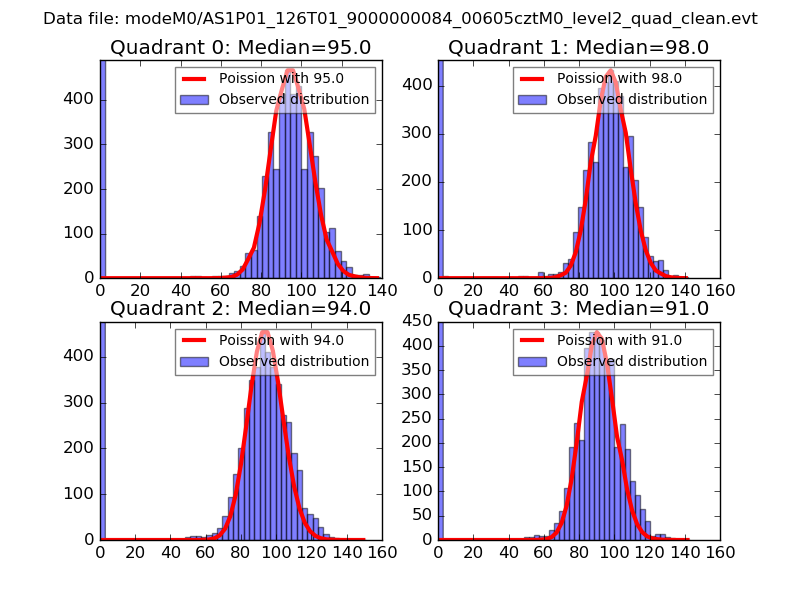 |
 |
| Quadrant-wise count rates Data is divided into 100 sec bins |
 |
|
| Module-wise count rates for Quadrant A Data is divided into 100 sec bins |
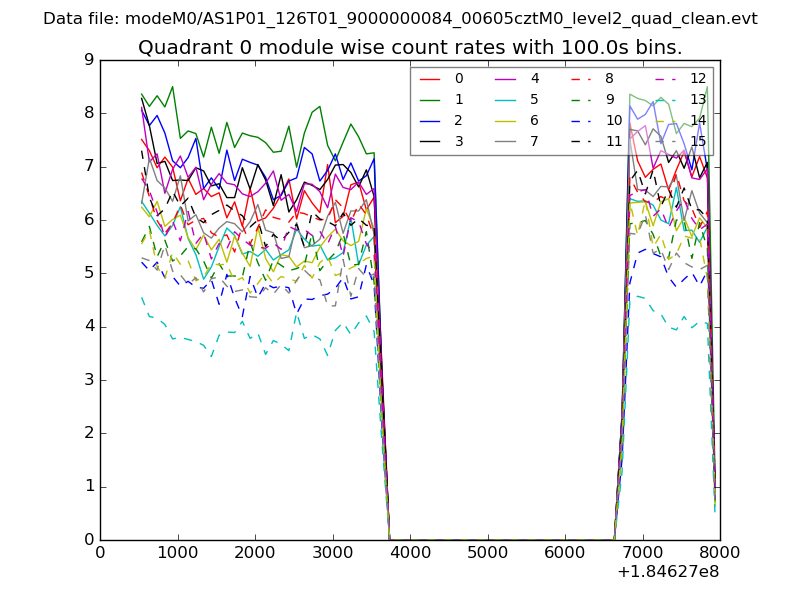 |
 |
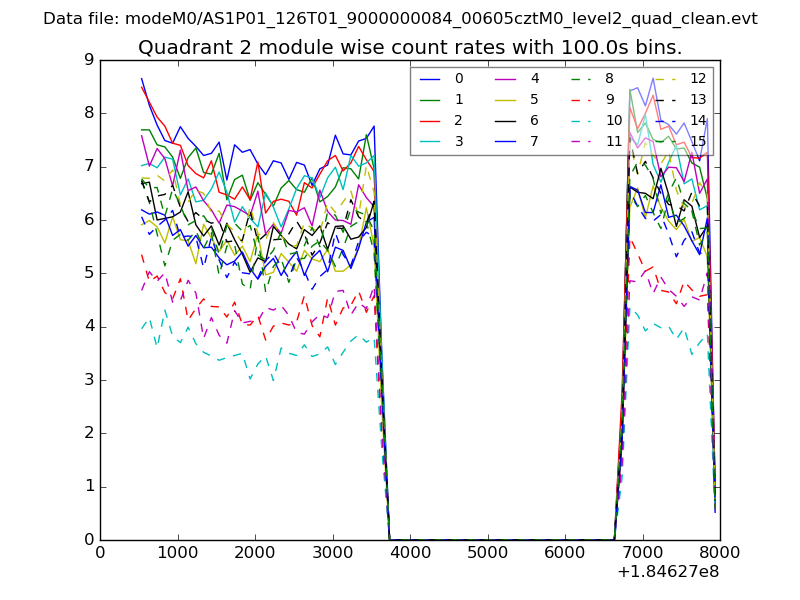
| Module-wise count rates for Quadrant B Data is divided into 100 sec bins |
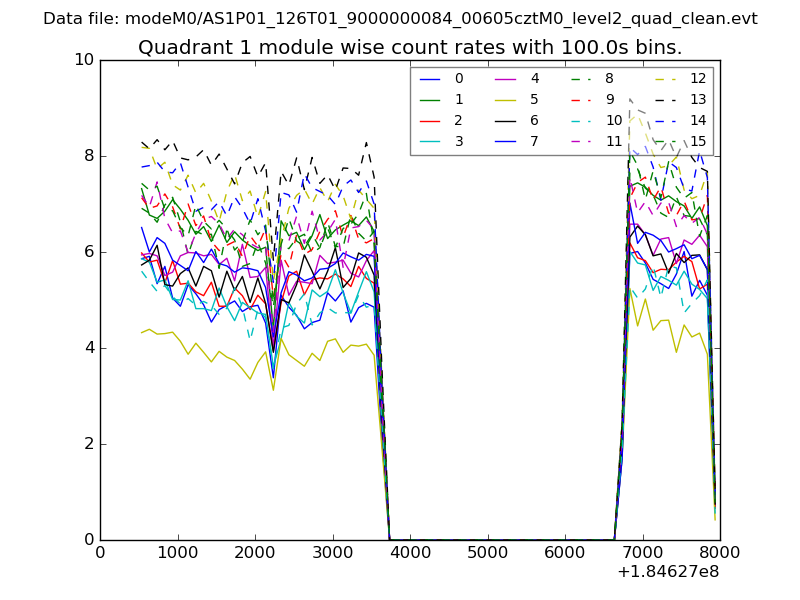 |
 |
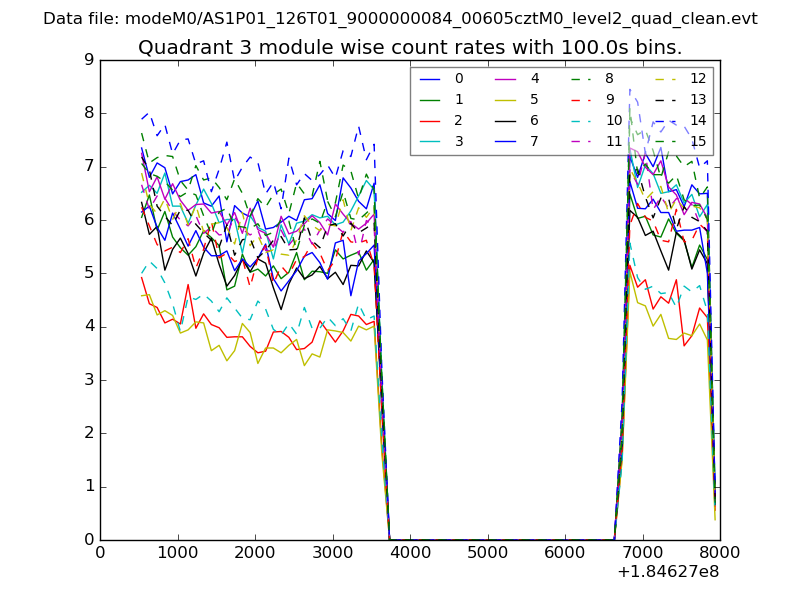
| Module-wise count rates for Quadrant C Data is divided into 100 sec bins |
 |
 |
| Module-wise count rates for Quadrant D Data is divided into 100 sec bins |
 |
 |
| Parameter | Plot |
|---|---|
| CZT HV Monitor | 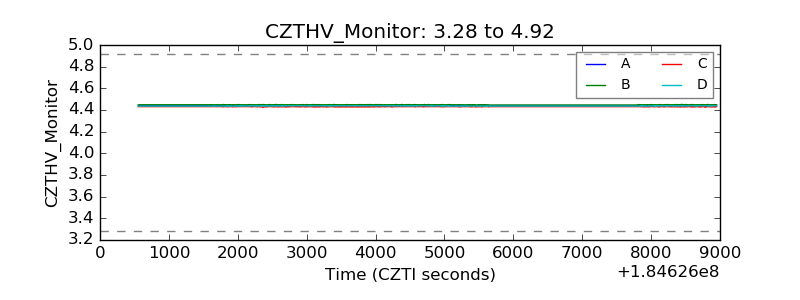 |
| D_VDD | 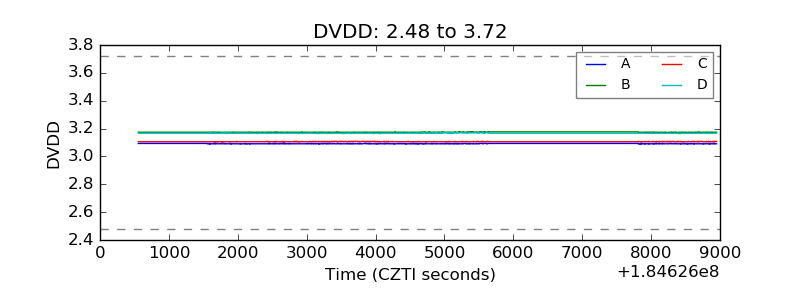 |
| Temperature 1 | 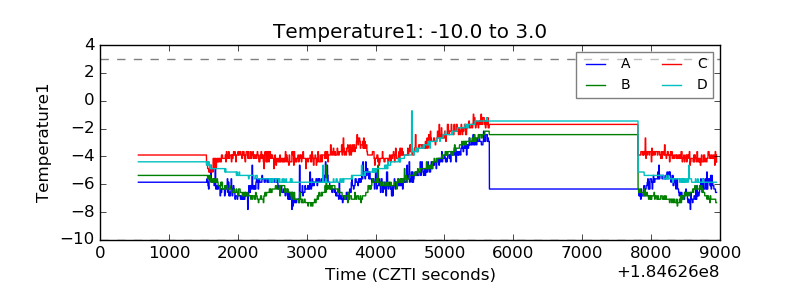 |
| Veto HV Monitor | 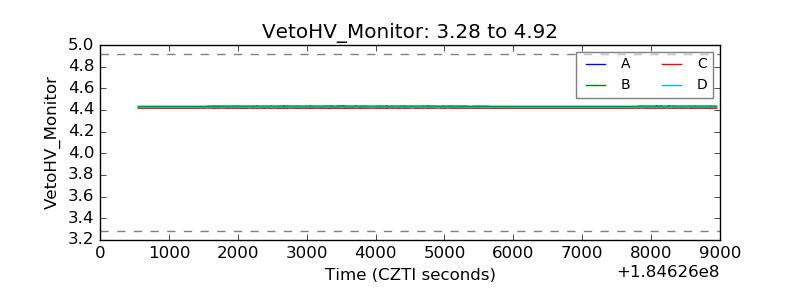 |
| Veto LLD | 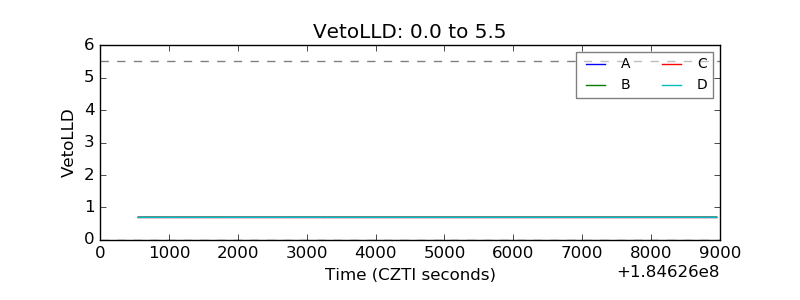 |
| Alpha Counter | 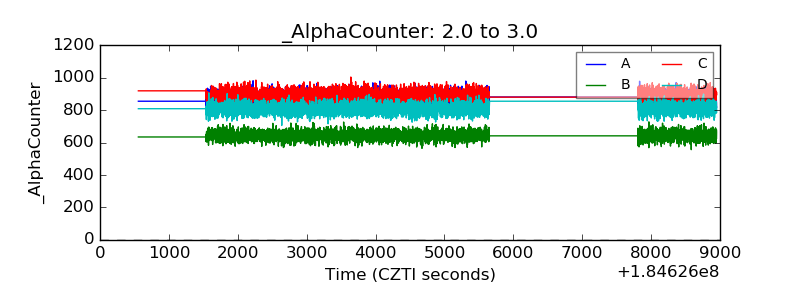 |
| _CPM_Rate | 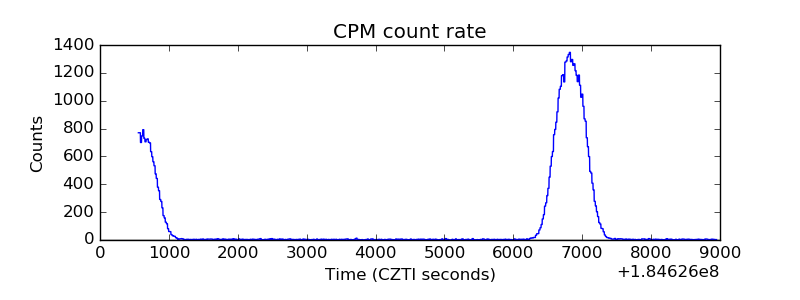 |
| CZT Counter | 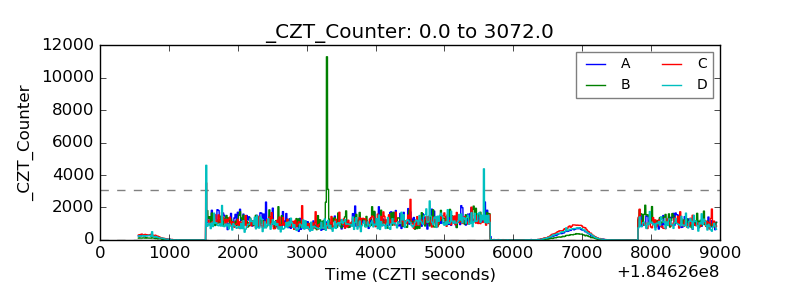 |
| +2.5 Volts monitor |  |
| +5 Volts monitor |  |
| _ROLL_ROT | 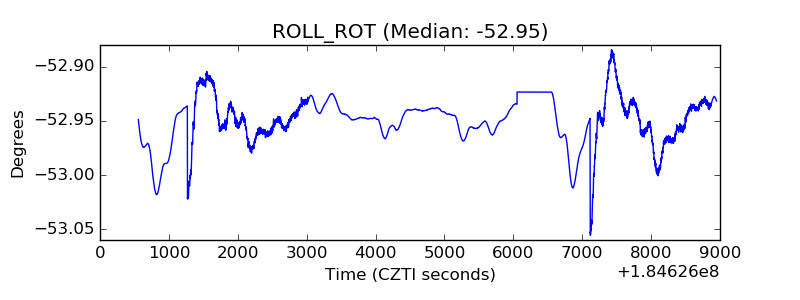 |
| _Roll_DEC | 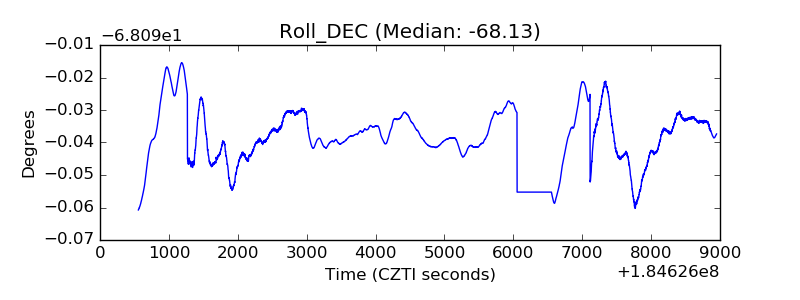 |
| _Roll_RA |  |
| Veto Counter | 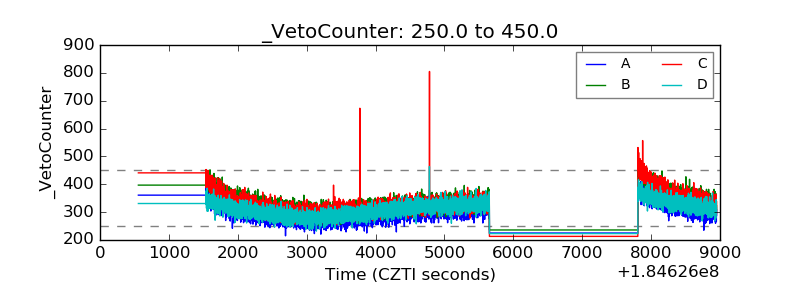 |