| Param | Original file | Final file |
|---|---|---|
| Filename | modeM0/AS1P01_126T01_9000000084_00606cztM0_level2.evt | modeM0/AS1P01_126T01_9000000084_00606cztM0_level2_quad_clean.evt |
| Size (bytes) | 822,090,240 | 65,753,280 |
| Size | 784.0 MB | 62.7 MB |
| Events in quadrant A | 6,281,903 | 408,190 |
| Events in quadrant B | 6,510,892 | 420,614 |
| Events in quadrant C | 5,921,139 | 405,675 |
| Events in quadrant D | 5,833,242 | 387,954 |
| Mode M9 | |||
|---|---|---|---|
| Quadrant | BADHDUFLAG | Total packets | Discarded packets |
| A | 0 | 34 | 0 |
| B | 0 | 34 | 0 |
| C | 0 | 34 | 0 |
| D | 0 | 35 | 0 |
| Mode M0 | |||
|---|---|---|---|
| Quadrant | BADHDUFLAG | Total packets | Discarded packets |
| A | 0 | 22409 | 3 |
| B | 0 | 23042 | 2 |
| C | 0 | 21308 | 2 |
| D | 0 | 21104 | 2 |
| Mode SS | |||
|---|---|---|---|
| Quadrant | BADHDUFLAG | Total packets | Discarded packets |
| A | 0 | 106 | 0 |
| B | 0 | 106 | 0 |
| C | 0 | 106 | 0 |
| D | 0 | 106 | 0 |
| Quadrant | Total seconds | Saturated seconds | Saturation percentage |
|---|---|---|---|
| A | 5264 | 47 | 0.892857% |
| B | 5264 | 11 | 0.208967% |
| C | 5264 | 4 | 0.075988% |
| D | 5264 | 48 | 0.911854% |
Noise dominated data is calculated using 1-second bins in cleaned event files. If a bin has >2000 counts, and if more than 50% of those come from <1% of pixels, then it is considered to be noise-dominated and hence unusable.
| Quadrant | # 1 sec bins | Bins with >0 counts | Bins with >2000 counts | High rate bins dominated by noise | Noise dominated (total time) | Noise dominated (detector-on time) | Marked lightcurve |
|---|---|---|---|---|---|---|---|
| A | 7419 | 5265 | 183 | 183 | 2.47% | 3.48% | 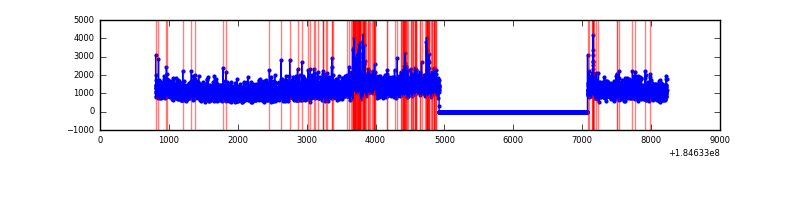 |
| B | 7419 | 5265 | 147 | 147 | 1.98% | 2.79% | 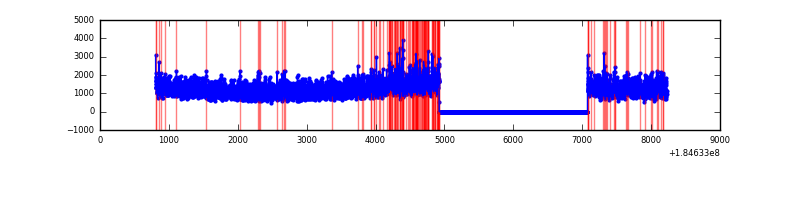 |
| C | 7419 | 5265 | 63 | 63 | 0.85% | 1.20% | 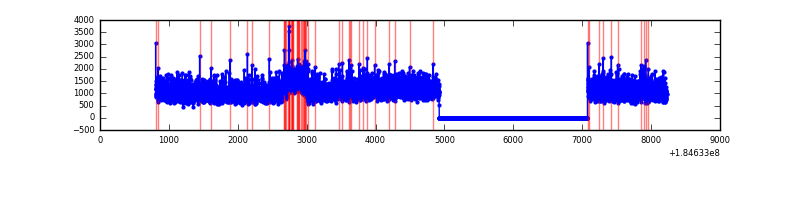 |
| D | 7419 | 5265 | 111 | 111 | 1.50% | 2.11% | 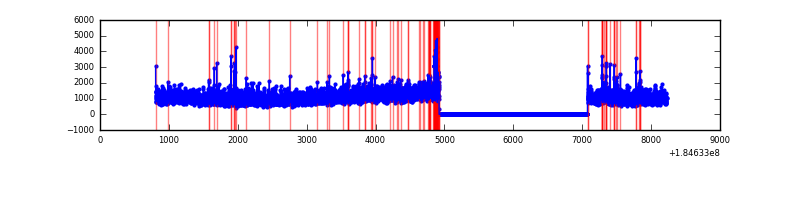 |
Top three noisy pixels from each quadrant. If the there are fewer than three noisy pixels in the level2.evt file, extra rows are filled as -1
| Pixel properties | Quadrant properties | ||||||
|---|---|---|---|---|---|---|---|
| Quadrant | DetID | PixID | Counts | Sigma | Mean | Median | Sigma |
| A | 15 | 171 | 176866 | 510.78 | 1543 | 1520 | 343.3 |
| A | 0 | 238 | 58128 | 164.9 | 1543 | 1520 | 343.3 |
| A | 0 | 149 | 51717 | 146.22 | 1543 | 1520 | 343.3 |
| B | 7 | 221 | 199892 | 541.64 | 1577 | 1582 | 366.1 |
| B | 4 | 250 | 117867 | 317.61 | 1577 | 1582 | 366.1 |
| B | 0 | 220 | 67649 | 180.45 | 1577 | 1582 | 366.1 |
| C | 7 | 190 | 134341 | 328.19 | 1460 | 1515 | 404.7 |
| C | 3 | 159 | 19704 | 44.94 | 1460 | 1515 | 404.7 |
| C | 1 | 1 | 10349 | 21.83 | 1460 | 1515 | 404.7 |
| D | 1 | 4 | 194177 | 445.01 | 1383 | 1438 | 433.1 |
| D | 13 | 221 | 192381 | 440.87 | 1383 | 1438 | 433.1 |
| D | 10 | 141 | 30336 | 66.72 | 1383 | 1438 | 433.1 |
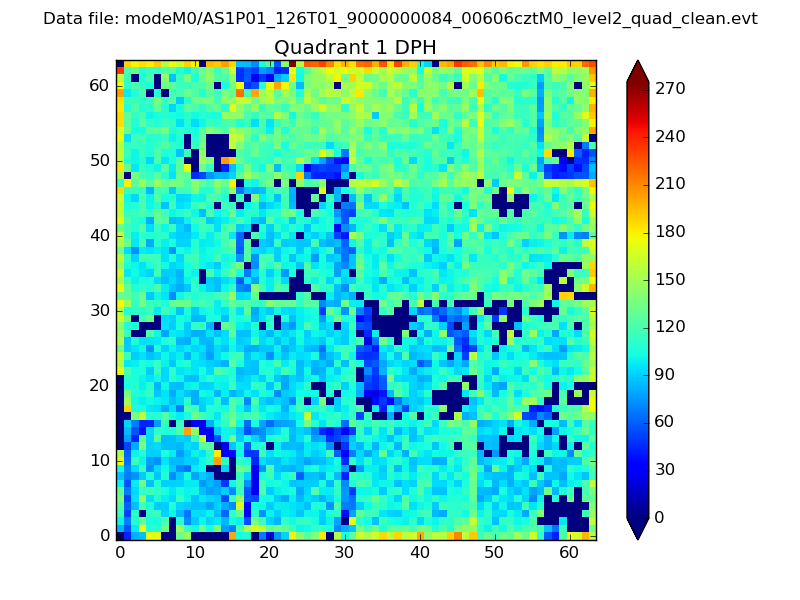
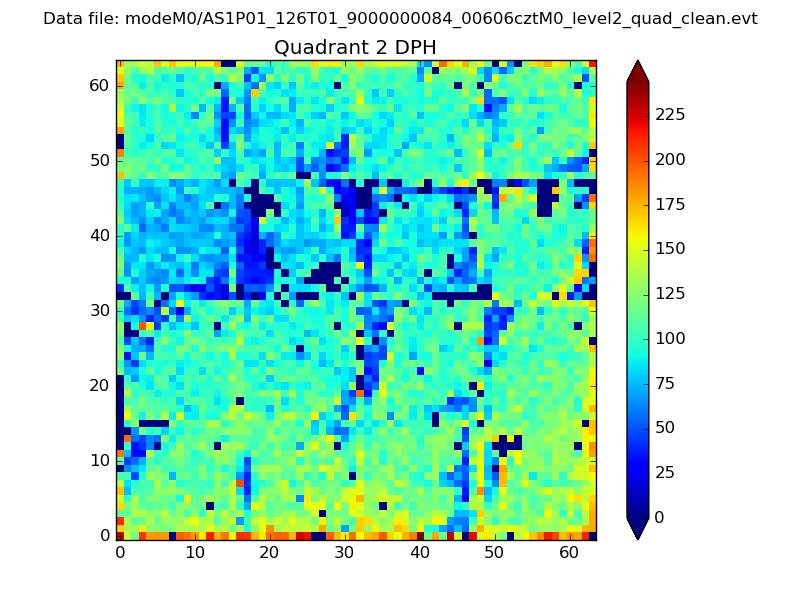
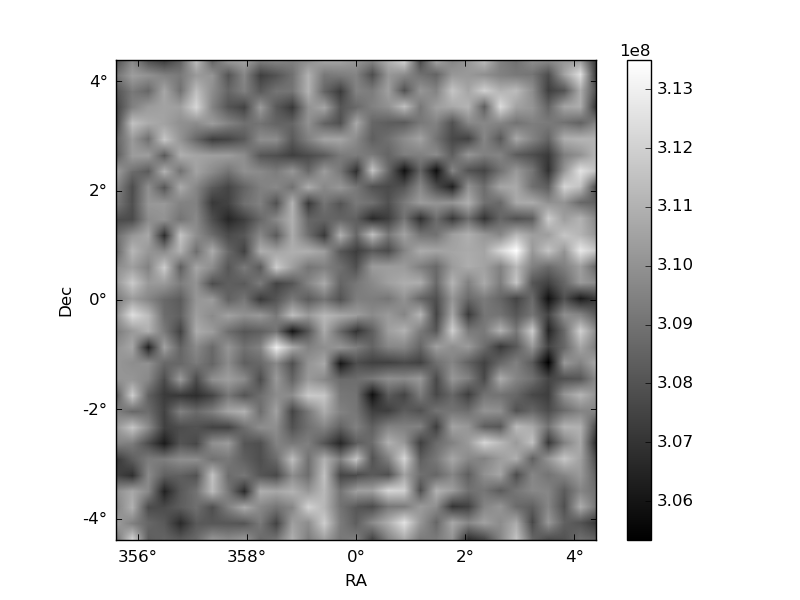
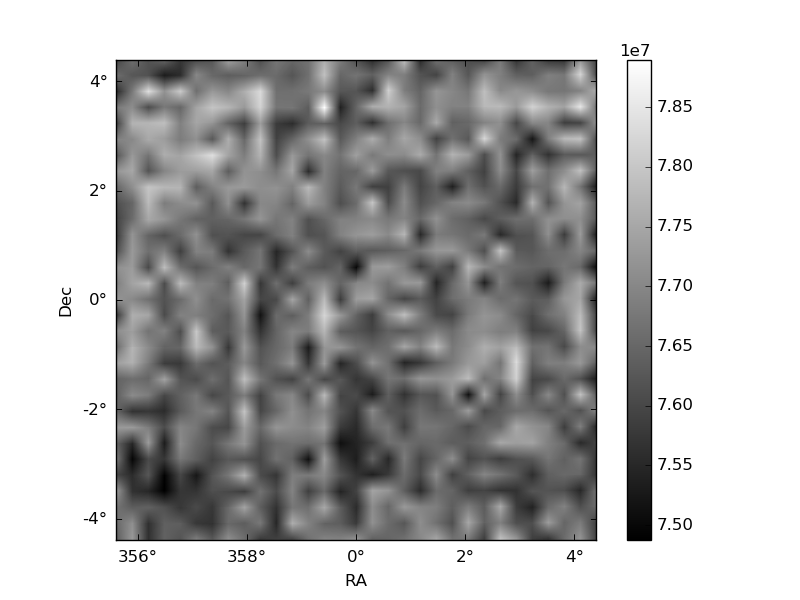
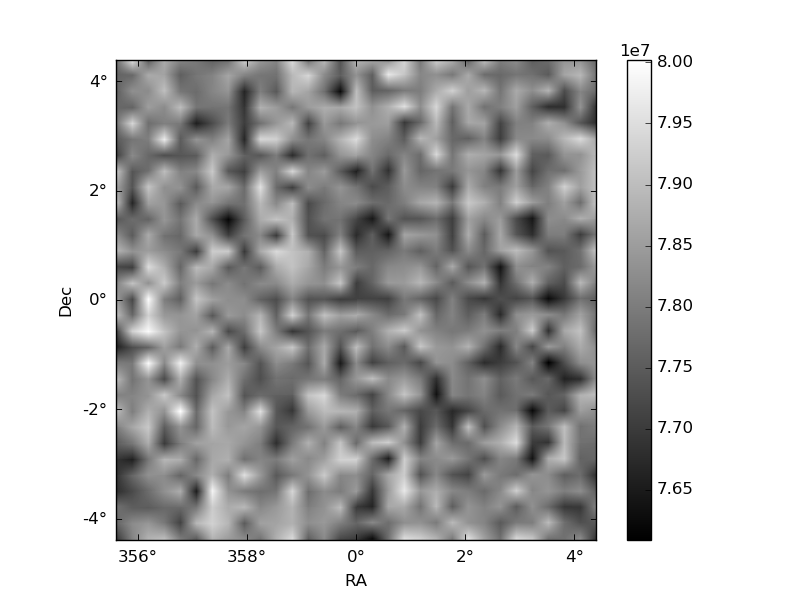
Histogram calculated using DETX and DETY for each event in the final _common_clean file
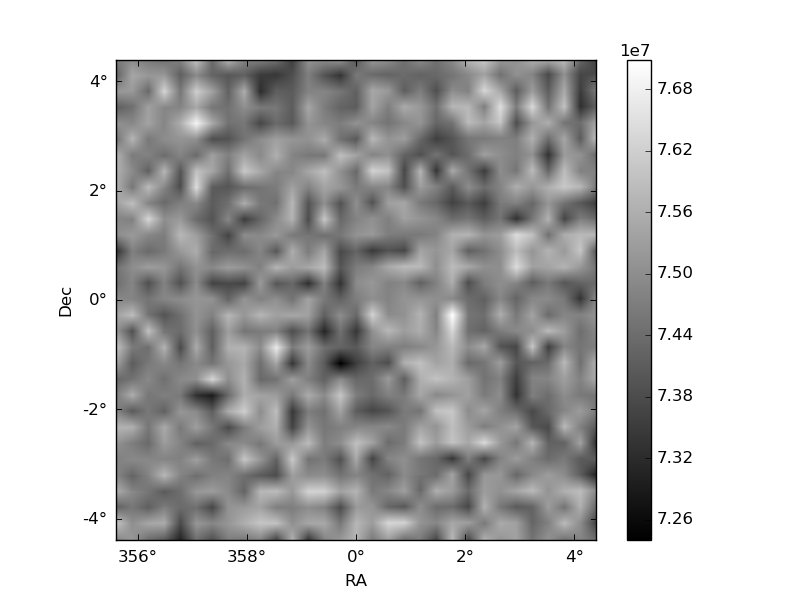
| Quadrant A |  |
 |
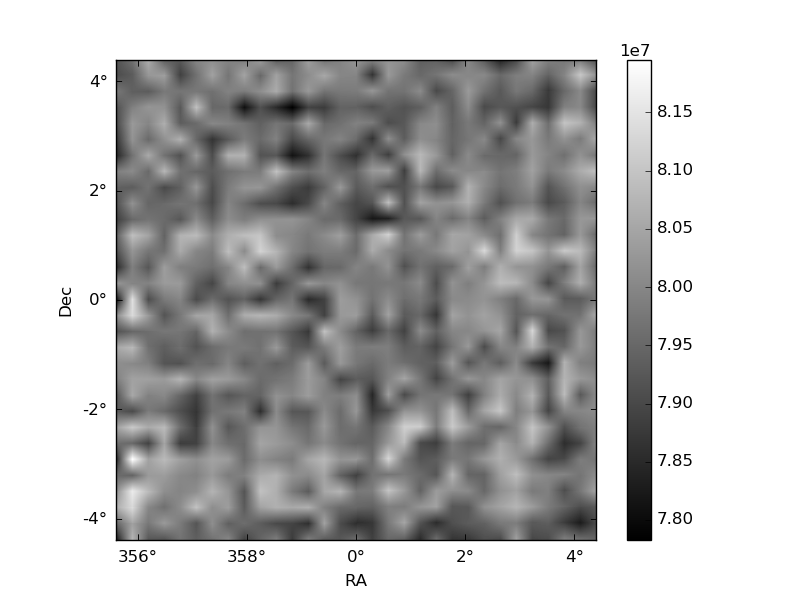
Quadrant B |
|---|---|---|---|
| Quadrant D | 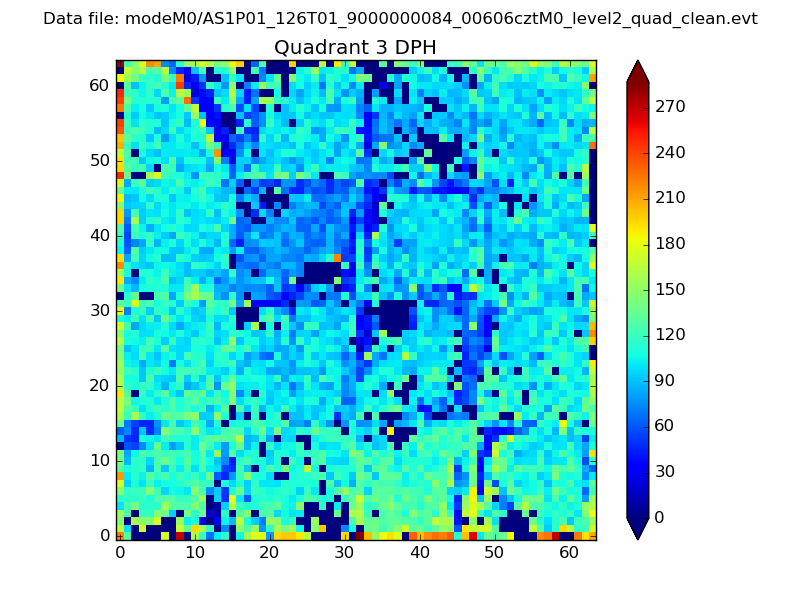 |
 |
Quadrant C |
| Plot type | Count rate plots | Images |
|---|---|---|
| Comparison with Poisson distribution Blue bars denote a histogram of data divided into 1 sec bins. Red curve is a Poisson curve with rate = median count rate of data. |
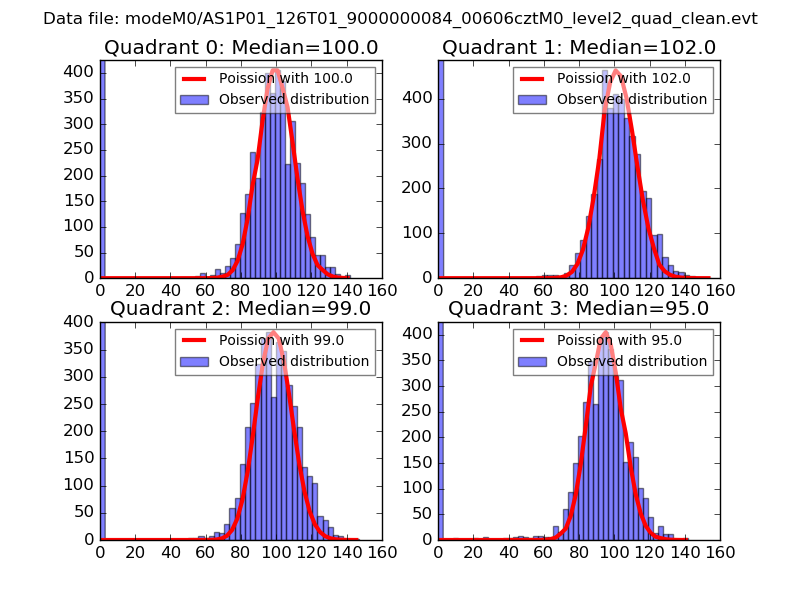 |
 |
| Quadrant-wise count rates Data is divided into 100 sec bins |
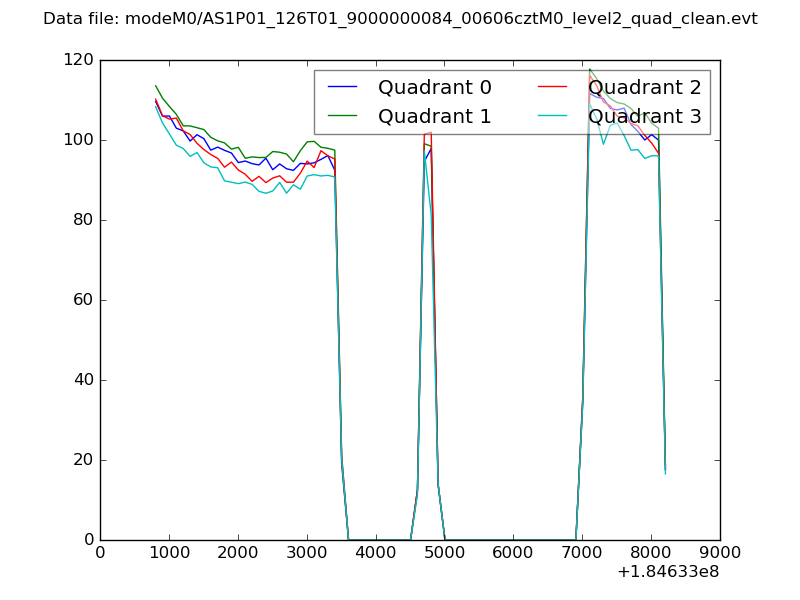 |
|
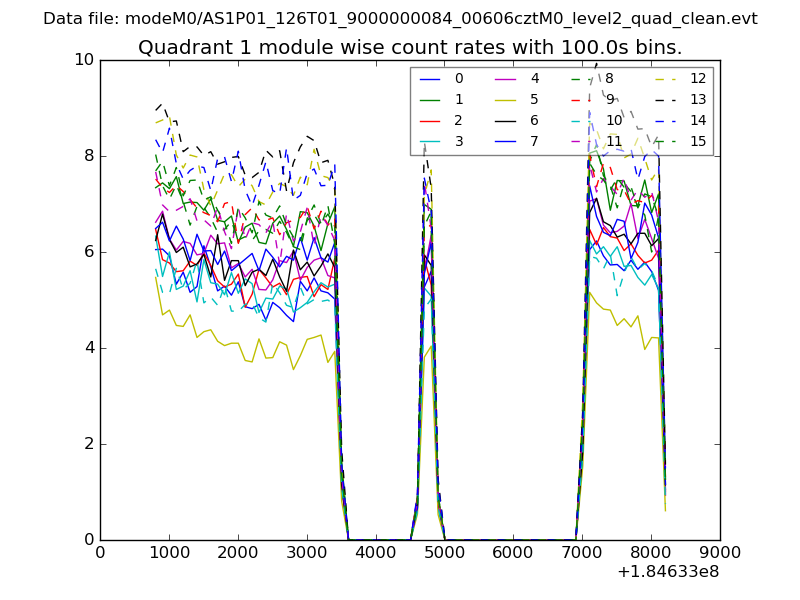
| Module-wise count rates for Quadrant A Data is divided into 100 sec bins |
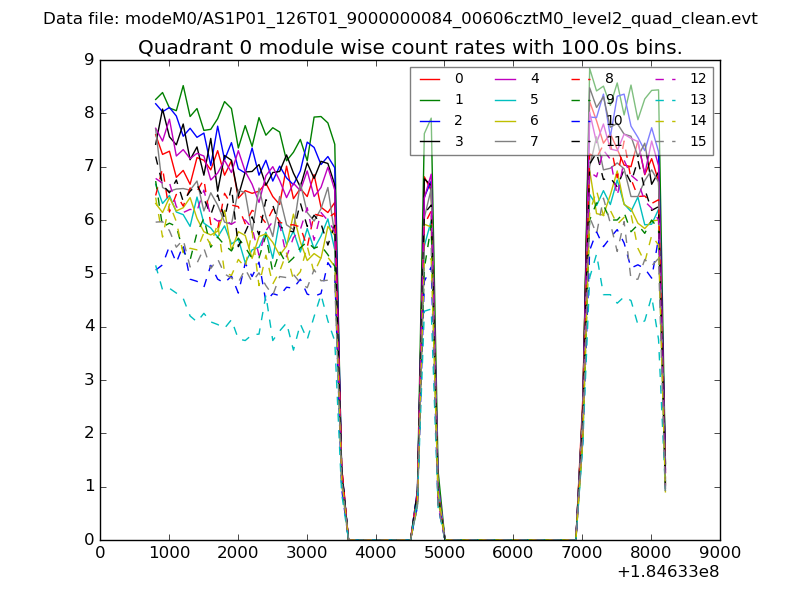 |
 |
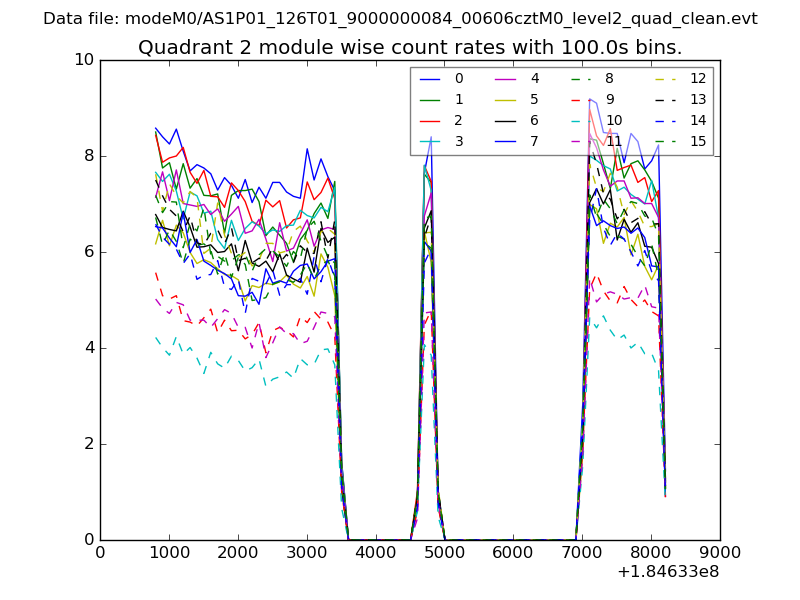
| Module-wise count rates for Quadrant B Data is divided into 100 sec bins |
 |
 |
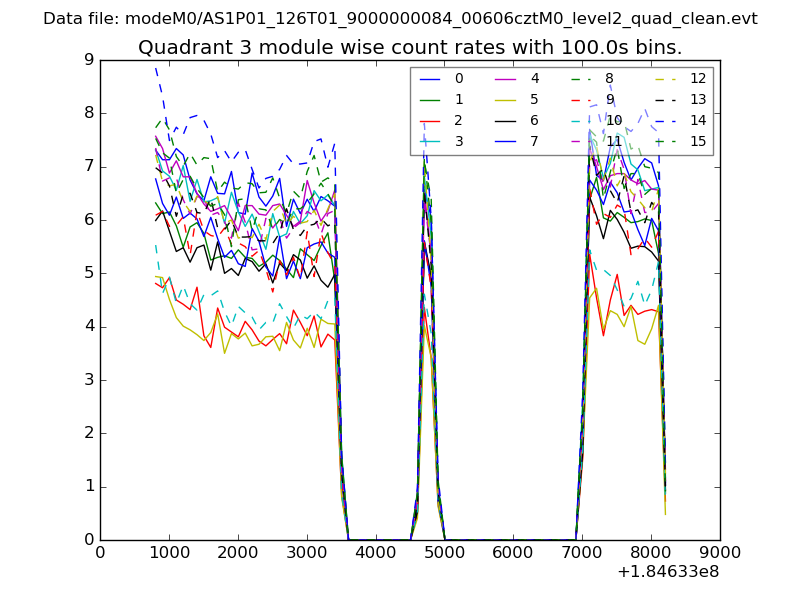
| Module-wise count rates for Quadrant C Data is divided into 100 sec bins |
 |
 |
| Module-wise count rates for Quadrant D Data is divided into 100 sec bins |
 |
 |
| Parameter | Plot |
|---|---|
| CZT HV Monitor | 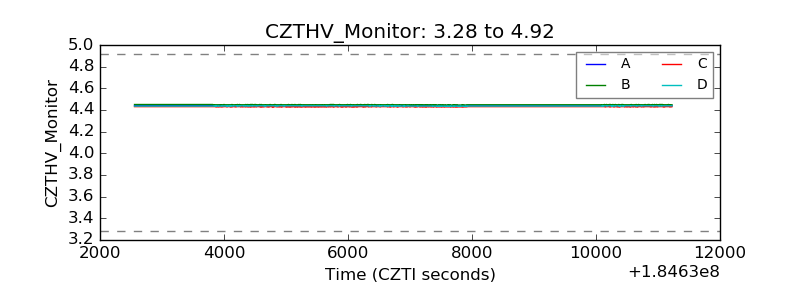 |
| D_VDD | 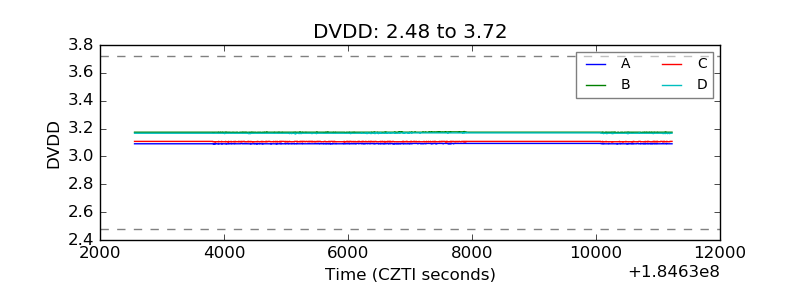 |
| Temperature 1 | 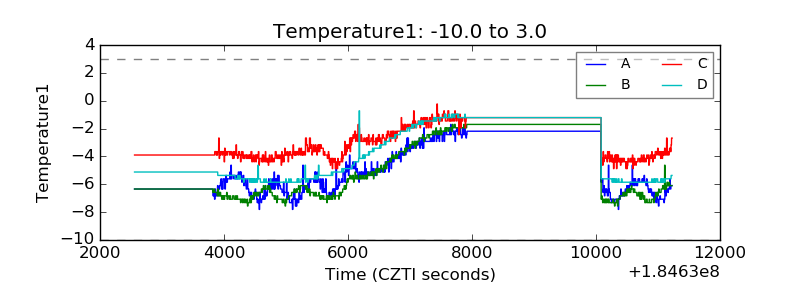 |
| Veto HV Monitor | 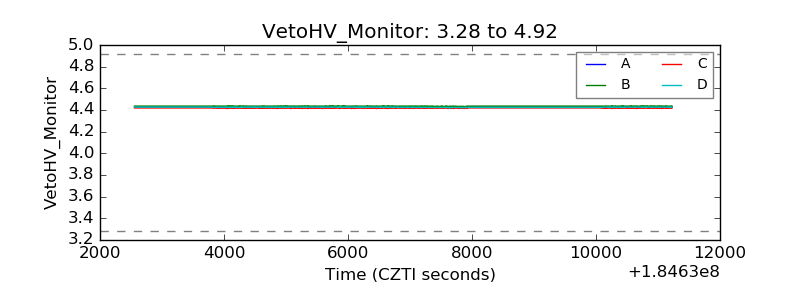 |
| Veto LLD | 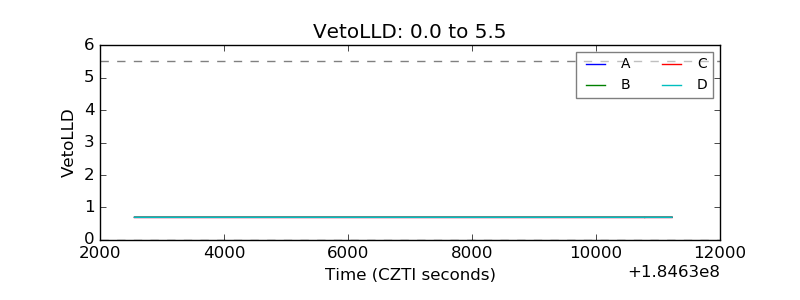 |
| Alpha Counter | 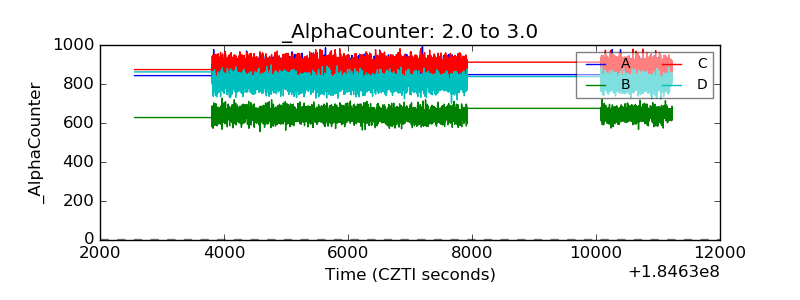 |
| _CPM_Rate | 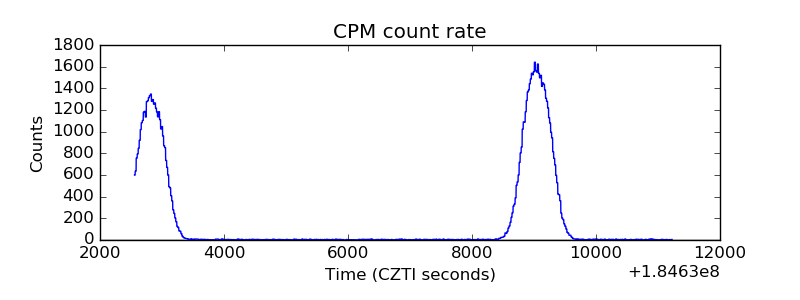 |
| CZT Counter | 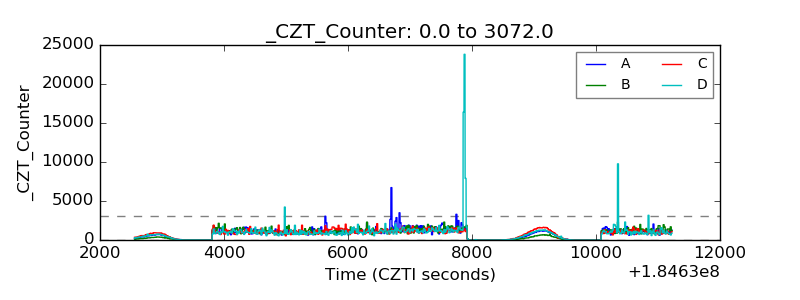 |
| +2.5 Volts monitor |  |
| +5 Volts monitor |  |
| _ROLL_ROT | 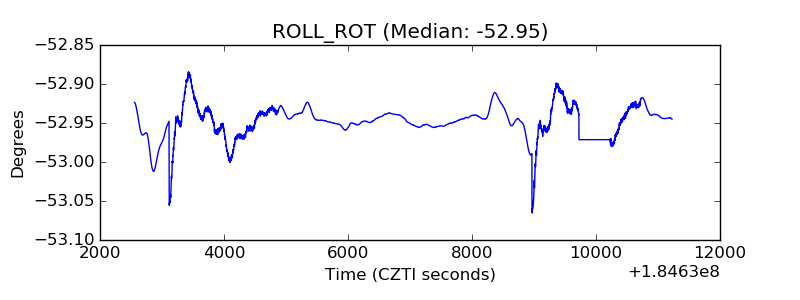 |
| _Roll_DEC | 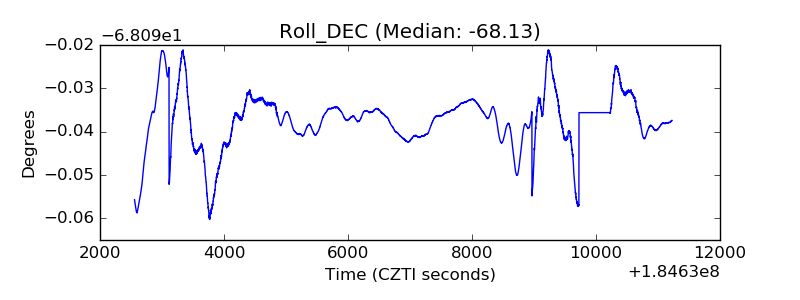 |
| _Roll_RA |  |
| Veto Counter | 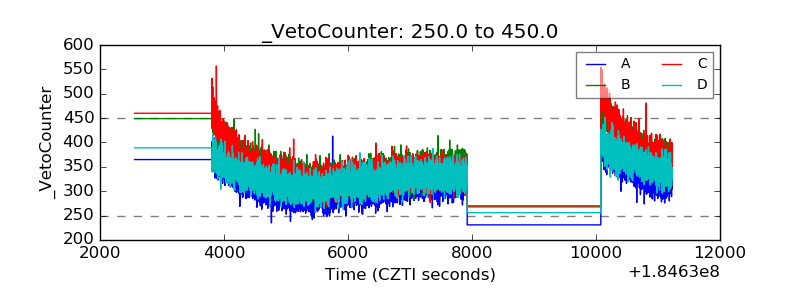 |