| Param | Original file | Final file |
|---|---|---|
| Filename | modeM0/AS1P01_126T01_9000000084_00607cztM0_level2.evt | modeM0/AS1P01_126T01_9000000084_00607cztM0_level2_quad_clean.evt |
| Size (bytes) | 824,186,880 | 64,215,360 |
| Size | 786.0 MB | 61.2 MB |
| Events in quadrant A | 6,380,209 | 397,086 |
| Events in quadrant B | 6,455,171 | 408,875 |
| Events in quadrant C | 5,682,248 | 400,425 |
| Events in quadrant D | 6,105,890 | 382,276 |
| Mode M9 | |||
|---|---|---|---|
| Quadrant | BADHDUFLAG | Total packets | Discarded packets |
| A | 0 | 21 | 0 |
| B | 0 | 21 | 0 |
| C | 0 | 21 | 0 |
| D | 0 | 21 | 0 |
| Mode M0 | |||
|---|---|---|---|
| Quadrant | BADHDUFLAG | Total packets | Discarded packets |
| A | 0 | 22558 | 2 |
| B | 0 | 22776 | 1 |
| C | 0 | 20479 | 1 |
| D | 0 | 21748 | 1 |
| Mode SS | |||
|---|---|---|---|
| Quadrant | BADHDUFLAG | Total packets | Discarded packets |
| A | 0 | 104 | 0 |
| B | 0 | 104 | 0 |
| C | 0 | 104 | 0 |
| D | 0 | 104 | 0 |
| Quadrant | Total seconds | Saturated seconds | Saturation percentage |
|---|---|---|---|
| A | 5070 | 7 | 0.138067% |
| B | 5070 | 33 | 0.650888% |
| C | 5070 | 6 | 0.118343% |
| D | 5070 | 67 | 1.321499% |
Noise dominated data is calculated using 1-second bins in cleaned event files. If a bin has >2000 counts, and if more than 50% of those come from <1% of pixels, then it is considered to be noise-dominated and hence unusable.
| Quadrant | # 1 sec bins | Bins with >0 counts | Bins with >2000 counts | High rate bins dominated by noise | Noise dominated (total time) | Noise dominated (detector-on time) | Marked lightcurve |
|---|---|---|---|---|---|---|---|
| A | 7224 | 5071 | 201 | 201 | 2.78% | 3.96% | 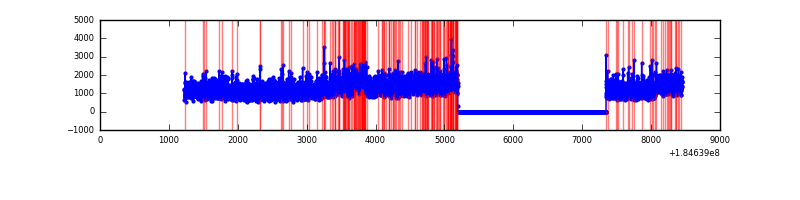 |
| B | 7224 | 5071 | 201 | 201 | 2.78% | 3.96% | 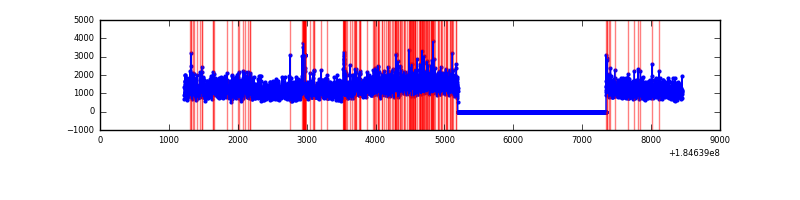 |
| C | 7224 | 5071 | 44 | 44 | 0.61% | 0.87% | 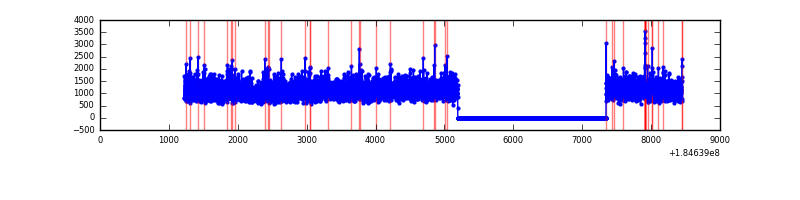 |
| D | 7224 | 5071 | 223 | 223 | 3.09% | 4.40% | 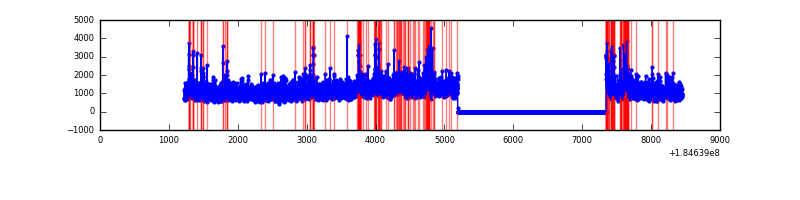 |
Top three noisy pixels from each quadrant. If the there are fewer than three noisy pixels in the level2.evt file, extra rows are filled as -1
| Pixel properties | Quadrant properties | ||||||
|---|---|---|---|---|---|---|---|
| Quadrant | DetID | PixID | Counts | Sigma | Mean | Median | Sigma |
| A | 15 | 171 | 148428 | 439.95 | 1519 | 1500 | 334.0 |
| A | 0 | 69 | 112292 | 331.75 | 1519 | 1500 | 334.0 |
| A | 0 | 149 | 108182 | 319.44 | 1519 | 1500 | 334.0 |
| B | 7 | 221 | 366460 | 1032.27 | 1527 | 1535 | 353.5 |
| B | 4 | 250 | 161336 | 452.03 | 1527 | 1535 | 353.5 |
| B | 8 | 54 | 17821 | 46.07 | 1527 | 1535 | 353.5 |
| C | 7 | 190 | 18190 | 42.09 | 1429 | 1483 | 396.9 |
| C | 7 | 221 | 13251 | 29.65 | 1429 | 1483 | 396.9 |
| C | 3 | 159 | 11571 | 25.42 | 1429 | 1483 | 396.9 |
| D | 1 | 4 | 306763 | 714.68 | 1371 | 1423 | 427.2 |
| D | 7 | 143 | 179783 | 417.47 | 1371 | 1423 | 427.2 |
| D | 13 | 221 | 78923 | 181.4 | 1371 | 1423 | 427.2 |
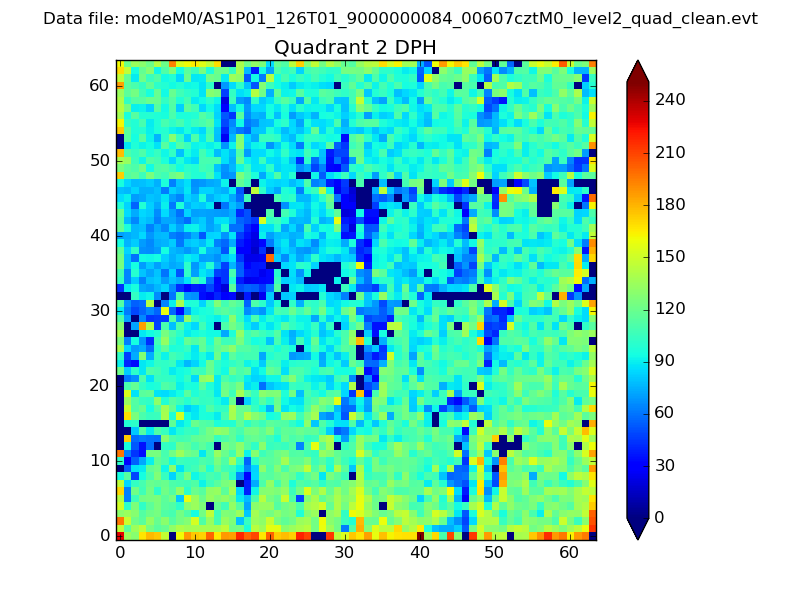
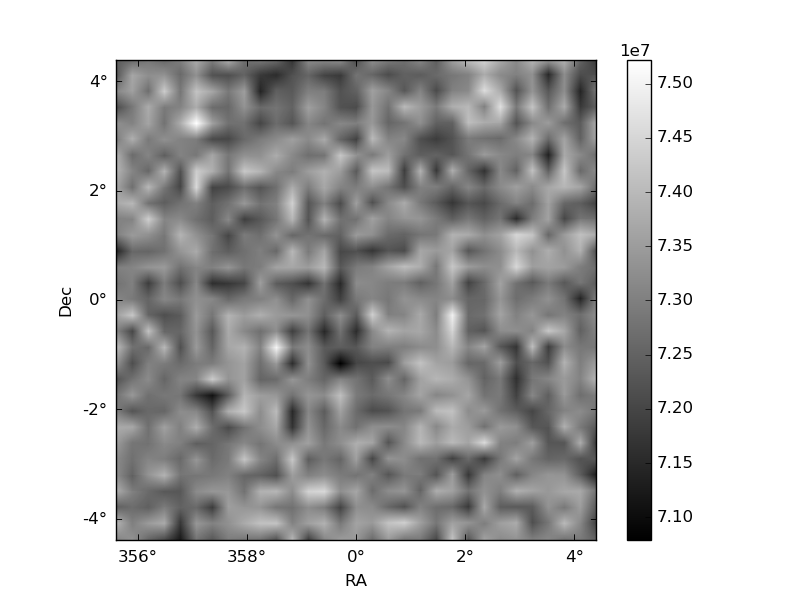
Histogram calculated using DETX and DETY for each event in the final _common_clean file
| Quadrant A | 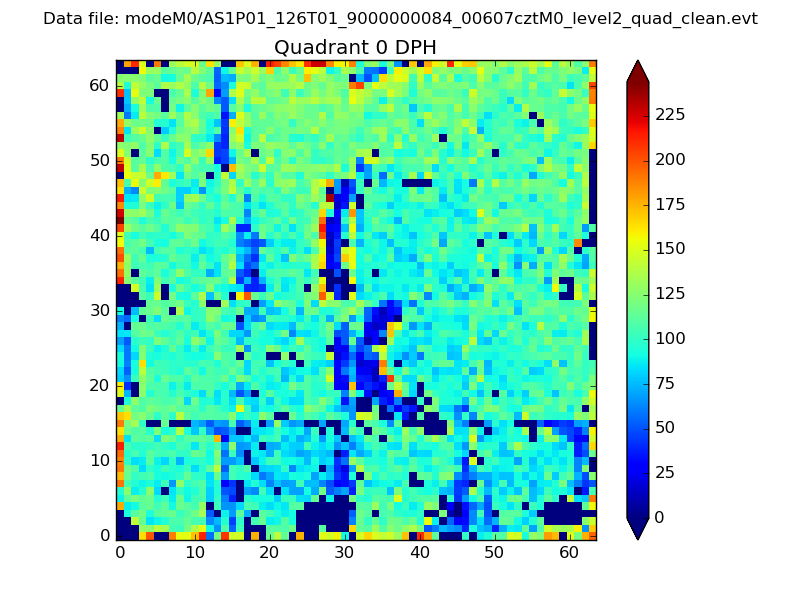 |
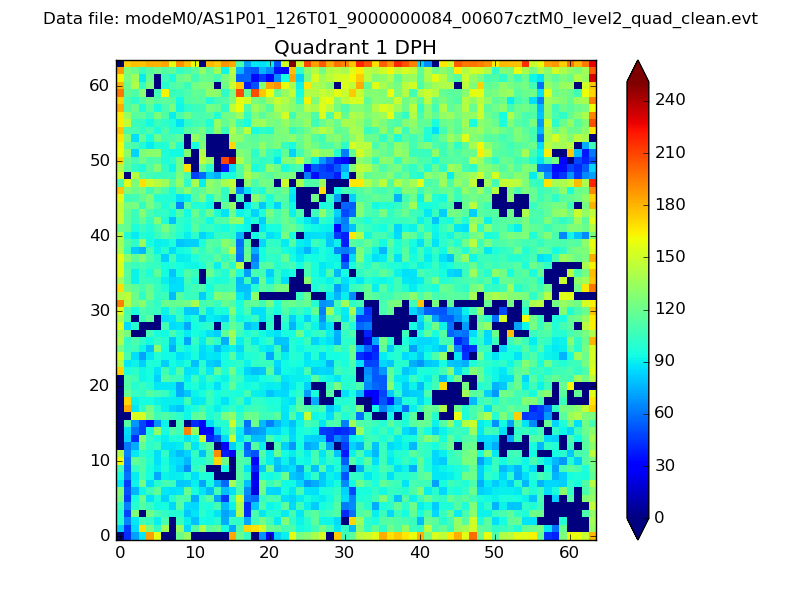 |
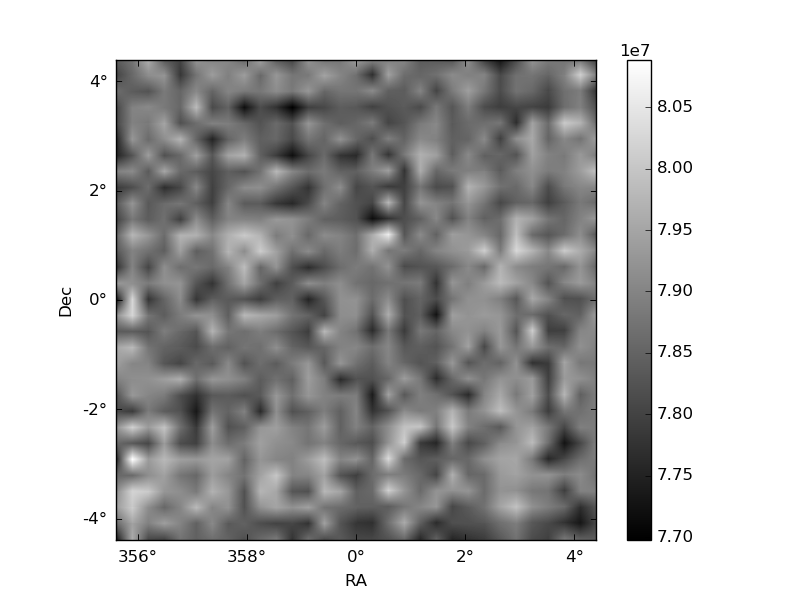
Quadrant B |
|---|---|---|---|
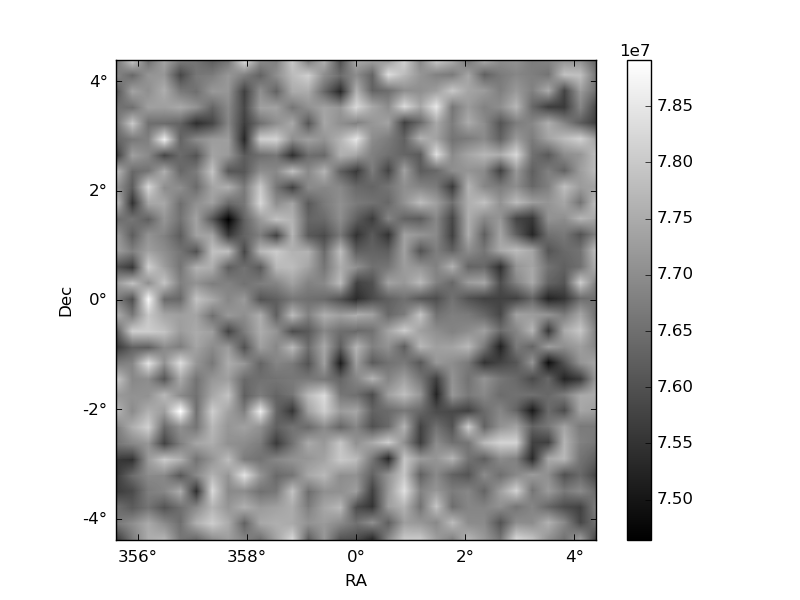
| Quadrant D | 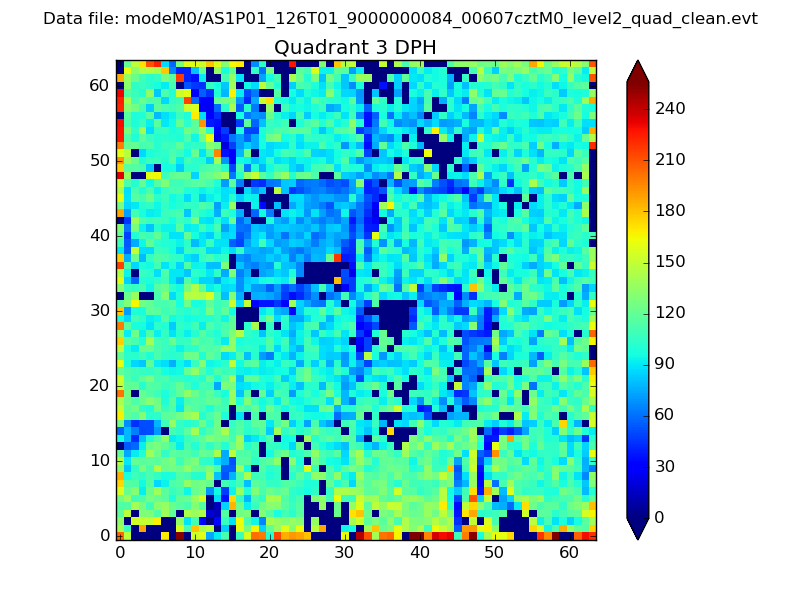 |
 |
Quadrant C |
| Plot type | Count rate plots | Images |
|---|---|---|
| Comparison with Poisson distribution Blue bars denote a histogram of data divided into 1 sec bins. Red curve is a Poisson curve with rate = median count rate of data. |
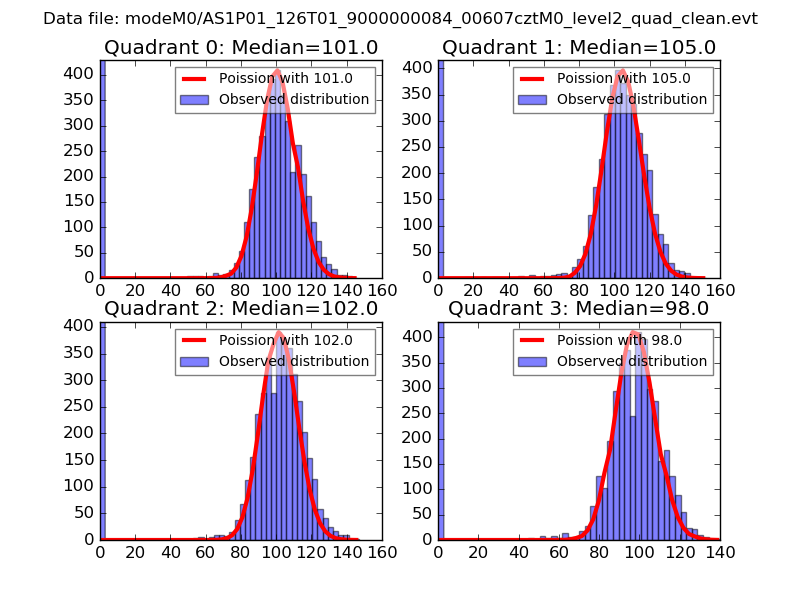 |
 |
| Quadrant-wise count rates Data is divided into 100 sec bins |
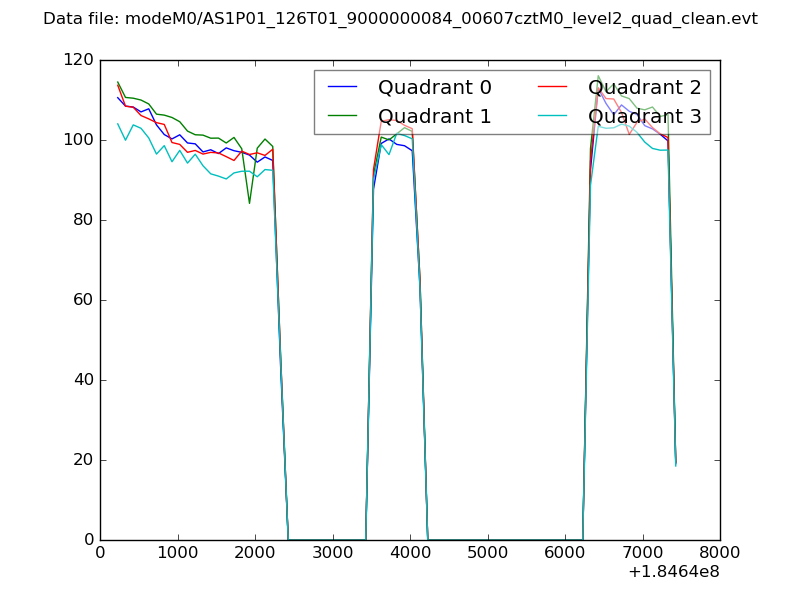 |
|
| Module-wise count rates for Quadrant A Data is divided into 100 sec bins |
 |
 |
| Module-wise count rates for Quadrant B Data is divided into 100 sec bins |
 |
 |
| Module-wise count rates for Quadrant C Data is divided into 100 sec bins |
 |
 |
| Module-wise count rates for Quadrant D Data is divided into 100 sec bins |
 |
 |
| Parameter | Plot |
|---|---|
| CZT HV Monitor |  |
| D_VDD | 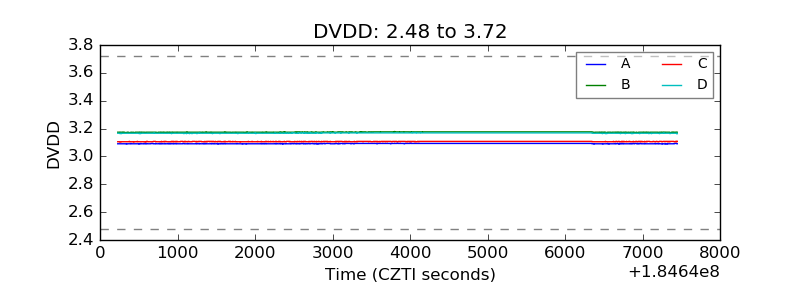 |
| Temperature 1 | 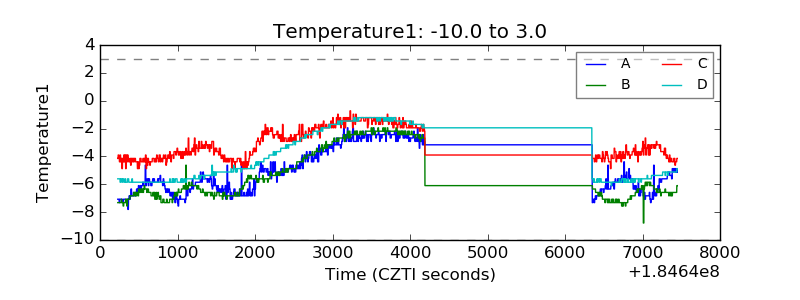 |
| Veto HV Monitor | 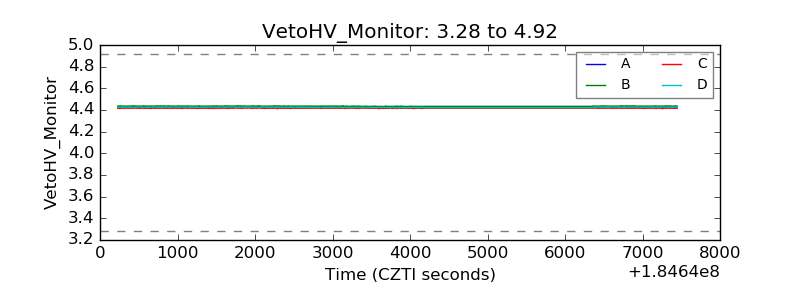 |
| Veto LLD | 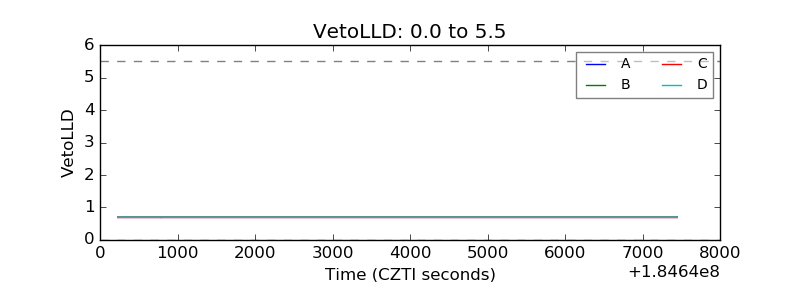 |
| Alpha Counter | 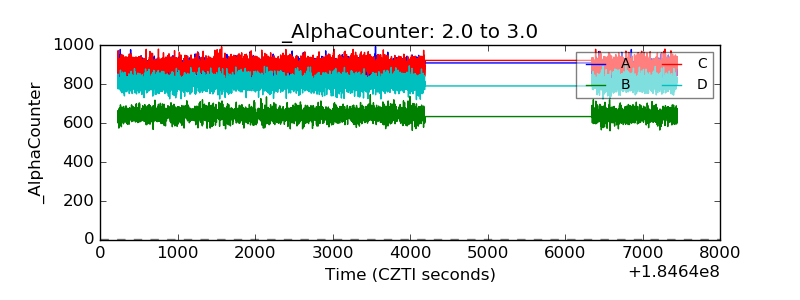 |
| _CPM_Rate | 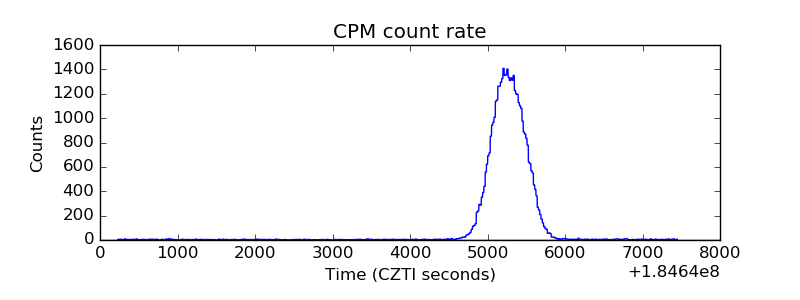 |
| CZT Counter | 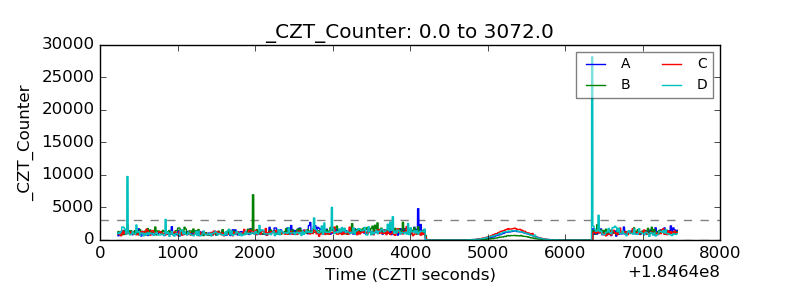 |
| +2.5 Volts monitor |  |
| +5 Volts monitor | 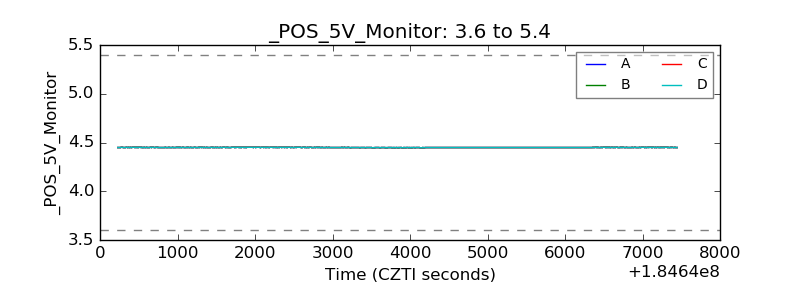 |
| _ROLL_ROT | 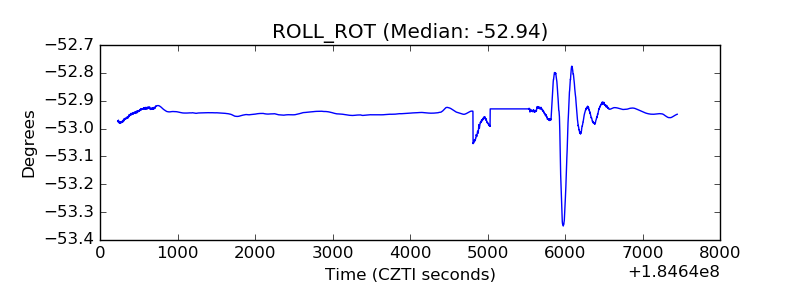 |
| _Roll_DEC | 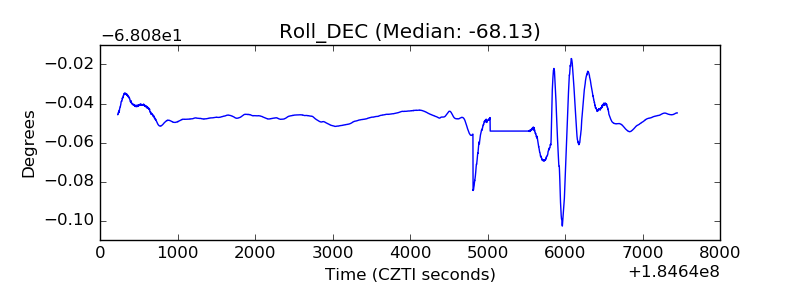 |
| _Roll_RA | 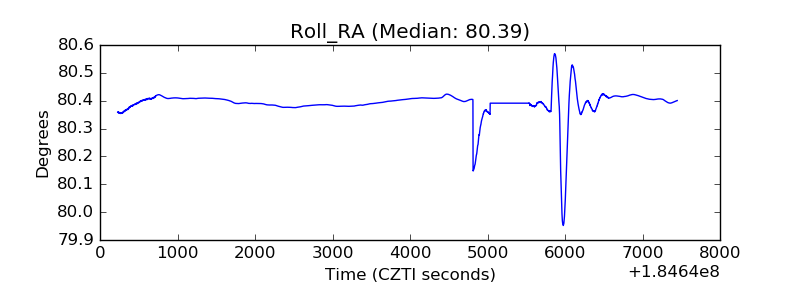 |
| Veto Counter |  |