| Param | Original file | Final file |
|---|---|---|
| Filename | modeM0/AS1P01_126T01_9000000084_00608cztM0_level2.evt | modeM0/AS1P01_126T01_9000000084_00608cztM0_level2_quad_clean.evt |
| Size (bytes) | 833,374,080 | 65,096,640 |
| Size | 794.8 MB | 62.1 MB |
| Events in quadrant A | 6,608,755 | 399,986 |
| Events in quadrant B | 6,363,426 | 415,552 |
| Events in quadrant C | 5,752,805 | 406,539 |
| Events in quadrant D | 6,174,944 | 391,255 |
| Mode M9 | |||
|---|---|---|---|
| Quadrant | BADHDUFLAG | Total packets | Discarded packets |
| A | 0 | 28 | 0 |
| B | 0 | 28 | 0 |
| C | 0 | 28 | 0 |
| D | 0 | 29 | 0 |
| Mode M0 | |||
|---|---|---|---|
| Quadrant | BADHDUFLAG | Total packets | Discarded packets |
| A | 0 | 23258 | 3 |
| B | 0 | 22513 | 2 |
| C | 0 | 20705 | 2 |
| D | 0 | 21982 | 2 |
| Mode SS | |||
|---|---|---|---|
| Quadrant | BADHDUFLAG | Total packets | Discarded packets |
| A | 0 | 106 | 0 |
| B | 0 | 106 | 0 |
| C | 0 | 106 | 0 |
| D | 0 | 106 | 0 |
| Quadrant | Total seconds | Saturated seconds | Saturation percentage |
|---|---|---|---|
| A | 5095 | 26 | 0.510304% |
| B | 5095 | 16 | 0.314033% |
| C | 5095 | 8 | 0.157017% |
| D | 5095 | 25 | 0.490677% |
Noise dominated data is calculated using 1-second bins in cleaned event files. If a bin has >2000 counts, and if more than 50% of those come from <1% of pixels, then it is considered to be noise-dominated and hence unusable.
| Quadrant | # 1 sec bins | Bins with >0 counts | Bins with >2000 counts | High rate bins dominated by noise | Noise dominated (total time) | Noise dominated (detector-on time) | Marked lightcurve |
|---|---|---|---|---|---|---|---|
| A | 7251 | 5096 | 248 | 248 | 3.42% | 4.87% | 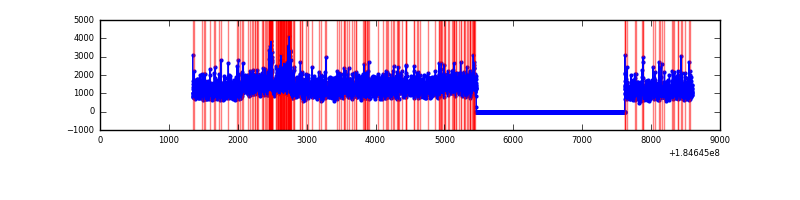 |
| B | 7251 | 5096 | 166 | 166 | 2.29% | 3.26% | 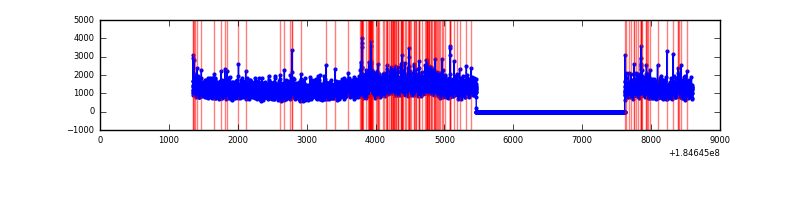 |
| C | 7251 | 5096 | 55 | 55 | 0.76% | 1.08% |  |
| D | 7251 | 5096 | 175 | 175 | 2.41% | 3.43% | 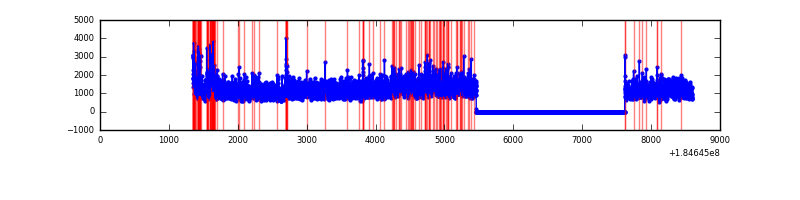 |
Top three noisy pixels from each quadrant. If the there are fewer than three noisy pixels in the level2.evt file, extra rows are filled as -1
| Pixel properties | Quadrant properties | ||||||
|---|---|---|---|---|---|---|---|
| Quadrant | DetID | PixID | Counts | Sigma | Mean | Median | Sigma |
| A | 15 | 171 | 475659 | 1378.37 | 1552 | 1533 | 344.0 |
| A | 13 | 160 | 36660 | 102.12 | 1552 | 1533 | 344.0 |
| A | 0 | 238 | 33227 | 92.14 | 1552 | 1533 | 344.0 |
| B | 7 | 221 | 279616 | 777.69 | 1543 | 1549 | 357.6 |
| B | 4 | 250 | 79770 | 218.77 | 1543 | 1549 | 357.6 |
| B | 0 | 220 | 24266 | 63.53 | 1543 | 1549 | 357.6 |
| C | 10 | 19 | 41181 | 99.22 | 1443 | 1496 | 400.0 |
| C | 1 | 1 | 15143 | 34.12 | 1443 | 1496 | 400.0 |
| C | 7 | 221 | 13263 | 29.42 | 1443 | 1496 | 400.0 |
| D | 1 | 4 | 264571 | 609.02 | 1393 | 1447 | 432.0 |
| D | 7 | 143 | 175202 | 402.17 | 1393 | 1447 | 432.0 |
| D | 12 | 237 | 107614 | 245.73 | 1393 | 1447 | 432.0 |
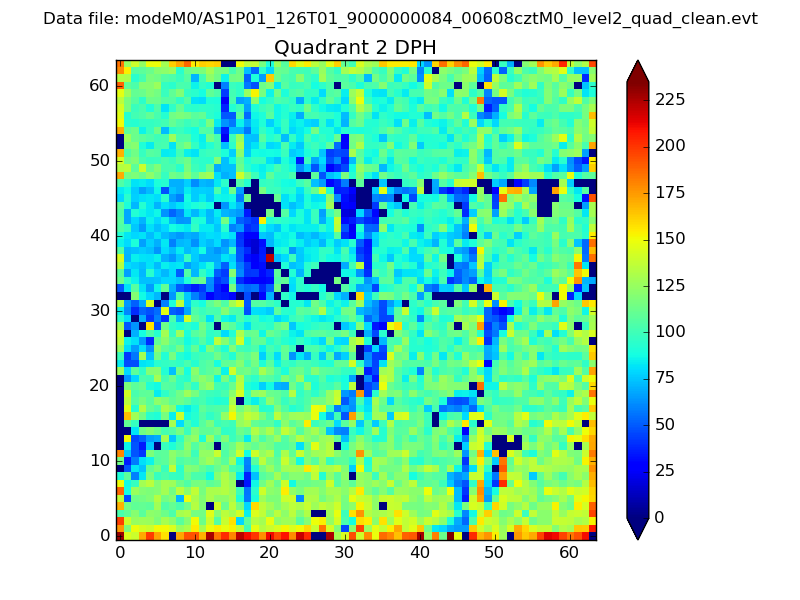
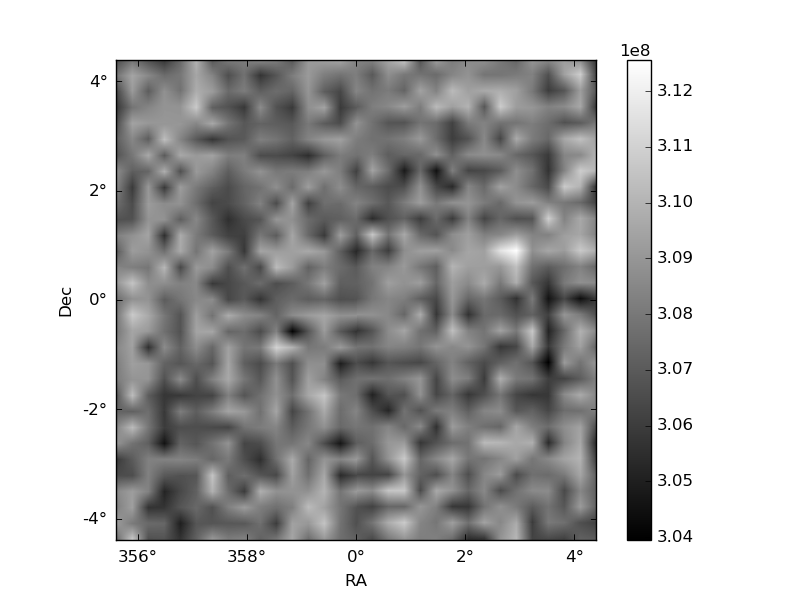
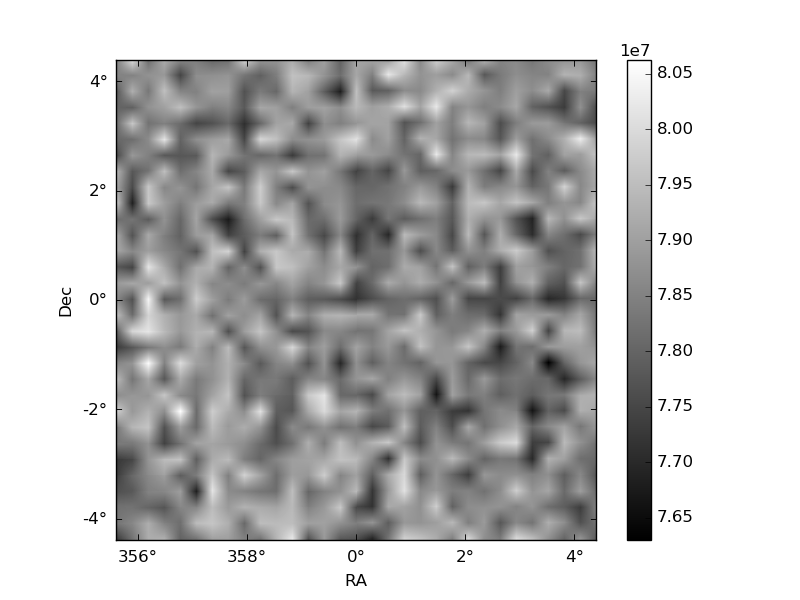
Histogram calculated using DETX and DETY for each event in the final _common_clean file
| Quadrant A | 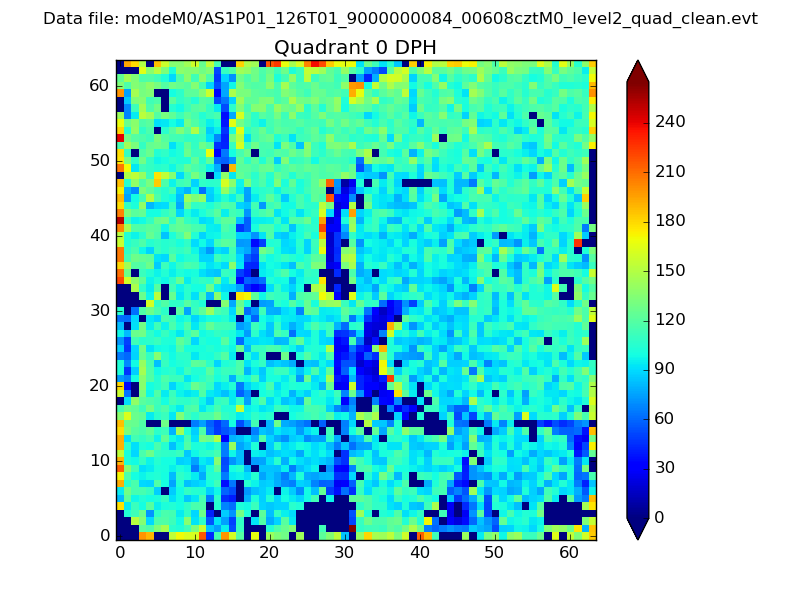 |
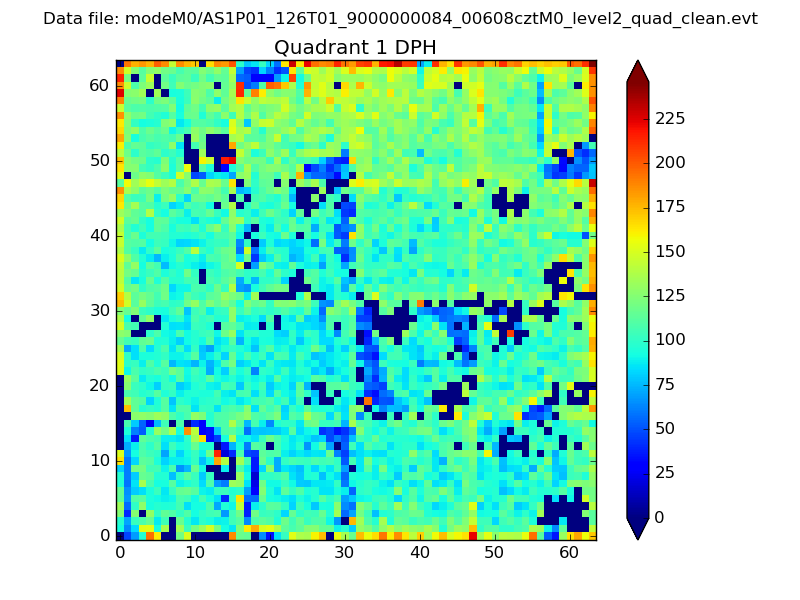 |
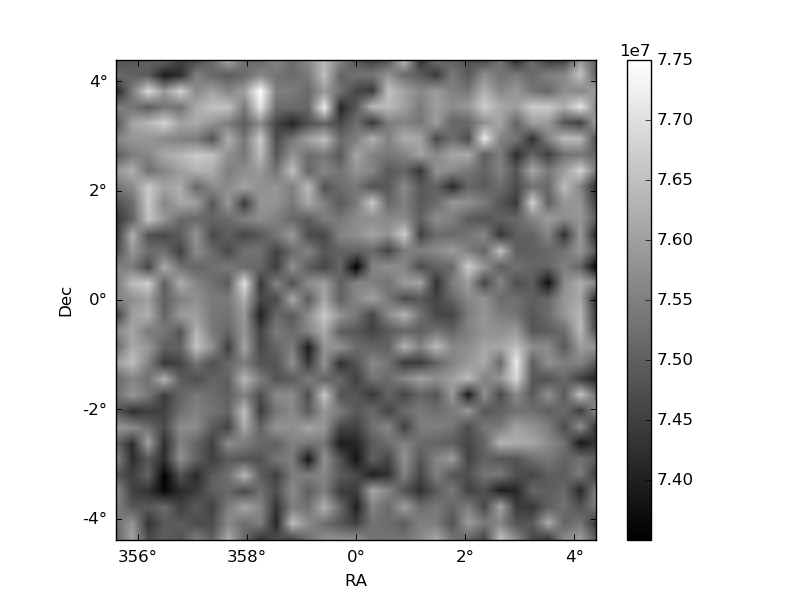
Quadrant B |
|---|---|---|---|
| Quadrant D | 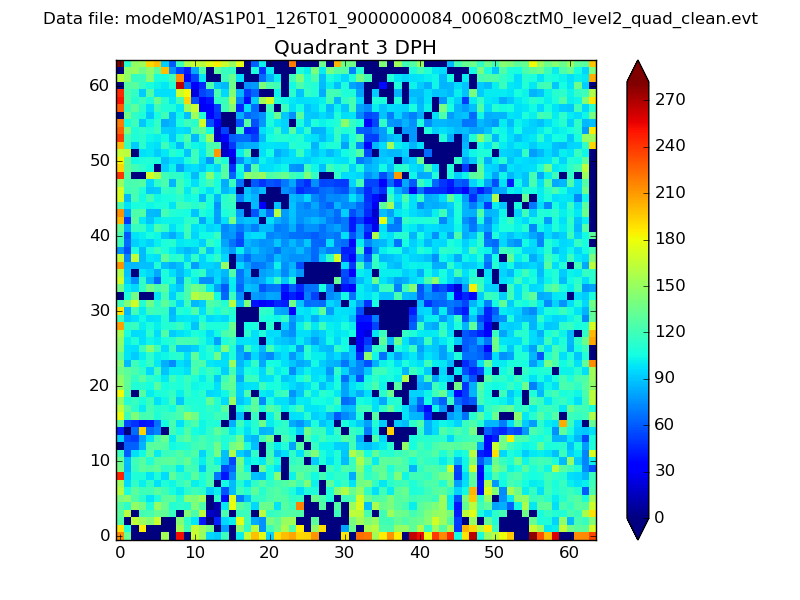 |
 |
Quadrant C |
| Plot type | Count rate plots | Images |
|---|---|---|
| Comparison with Poisson distribution Blue bars denote a histogram of data divided into 1 sec bins. Red curve is a Poisson curve with rate = median count rate of data. |
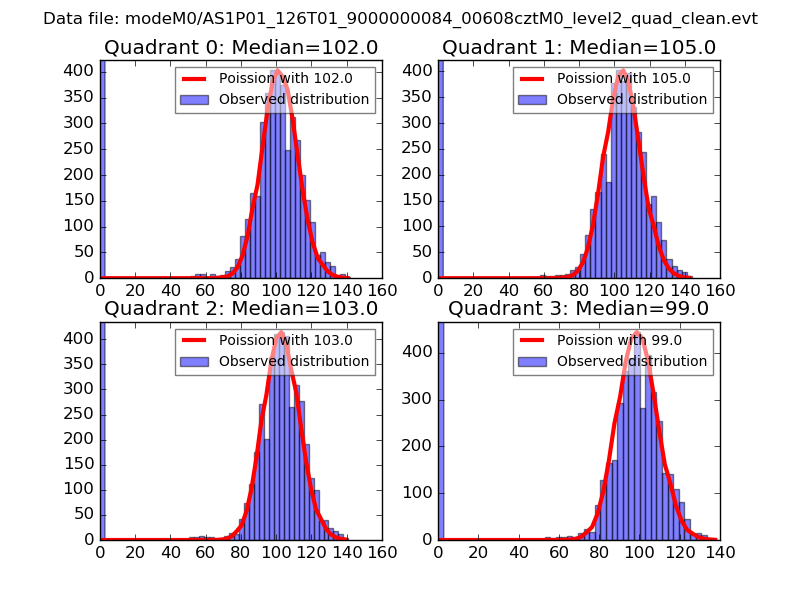 |
 |
| Quadrant-wise count rates Data is divided into 100 sec bins |
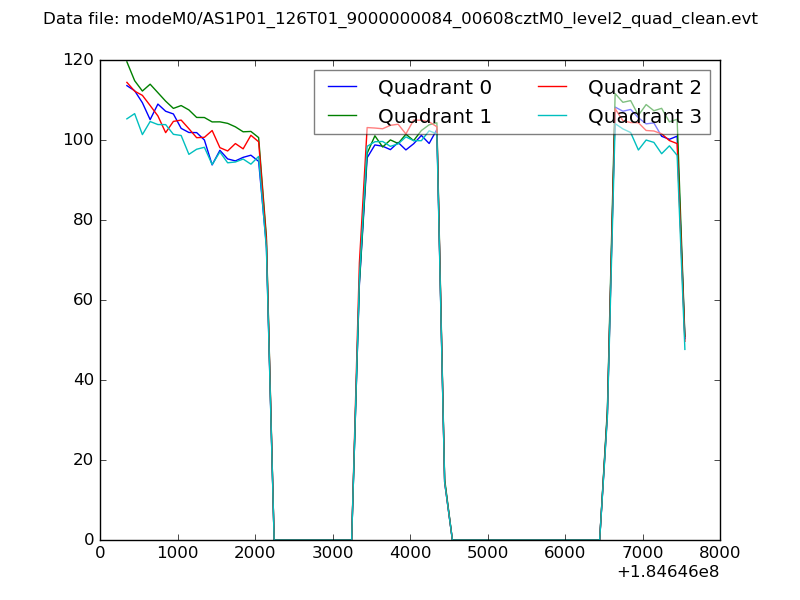 |
|
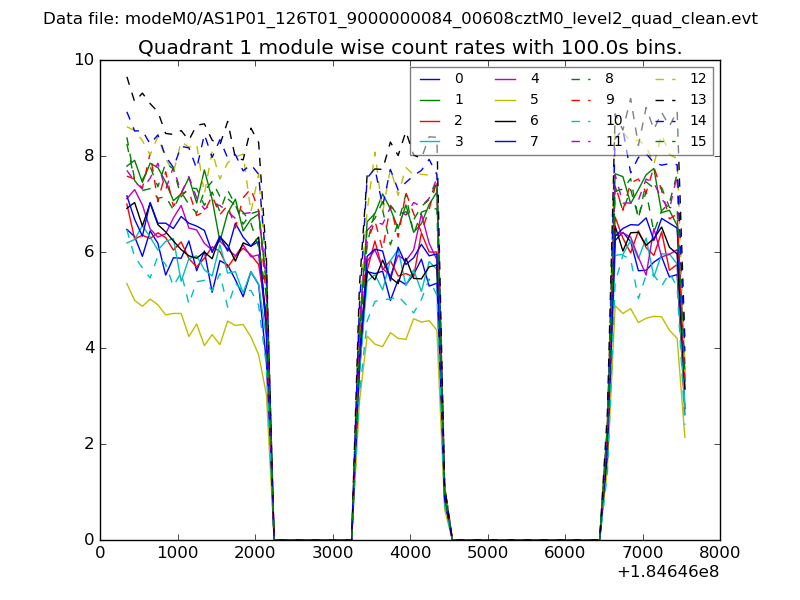
| Module-wise count rates for Quadrant A Data is divided into 100 sec bins |
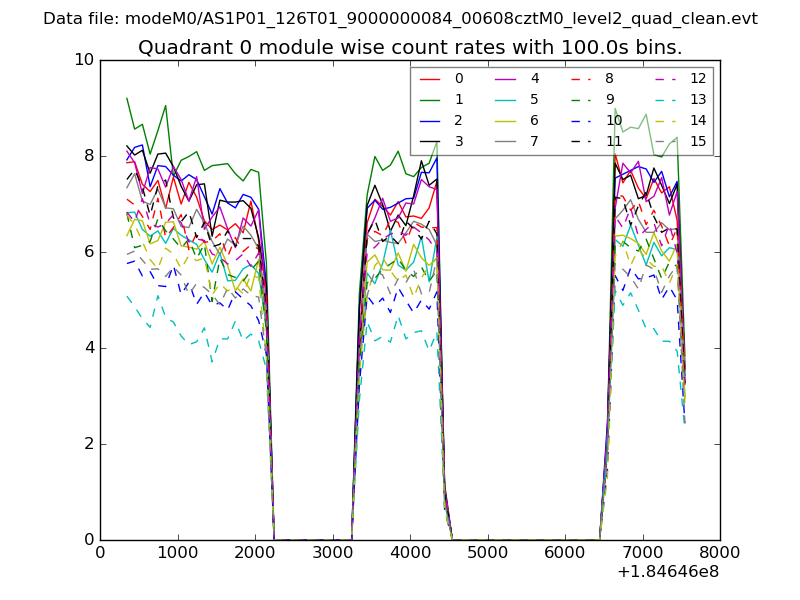 |
 |
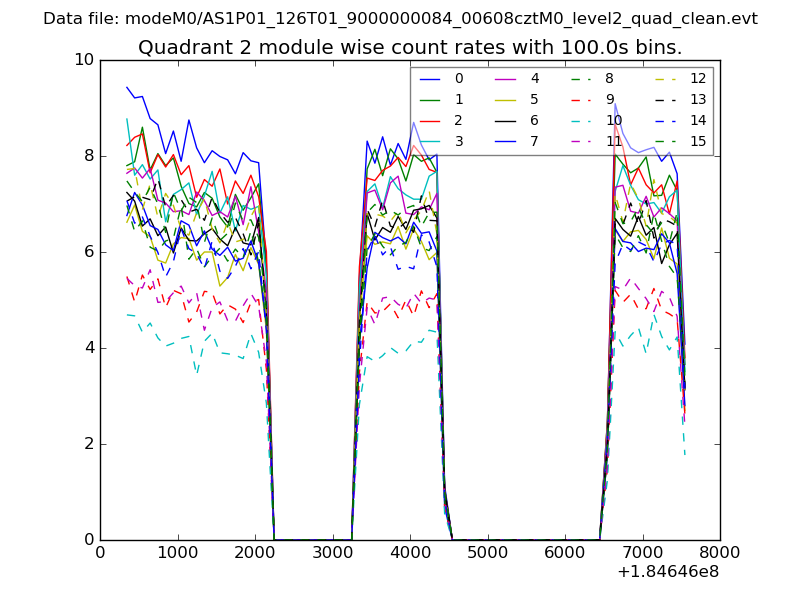
| Module-wise count rates for Quadrant B Data is divided into 100 sec bins |
 |
 |
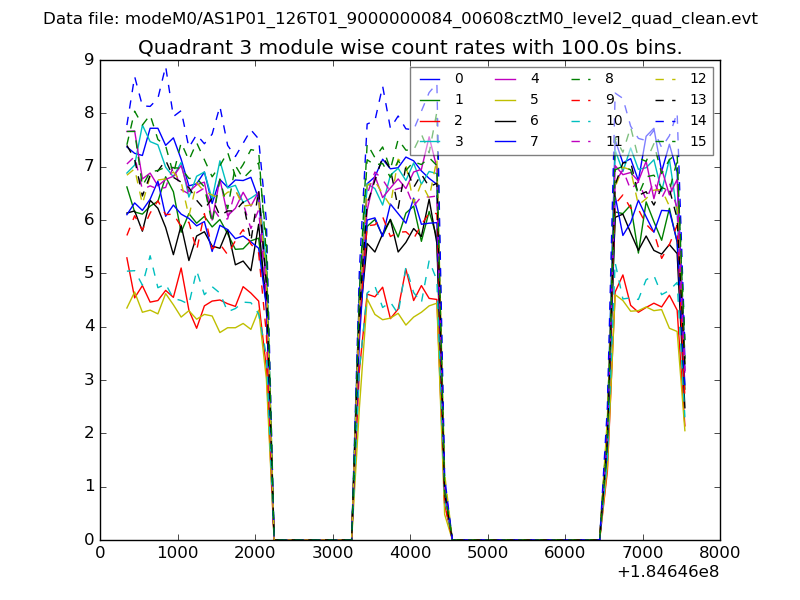
| Module-wise count rates for Quadrant C Data is divided into 100 sec bins |
 |
 |
| Module-wise count rates for Quadrant D Data is divided into 100 sec bins |
 |
 |
| Parameter | Plot |
|---|---|
| CZT HV Monitor | 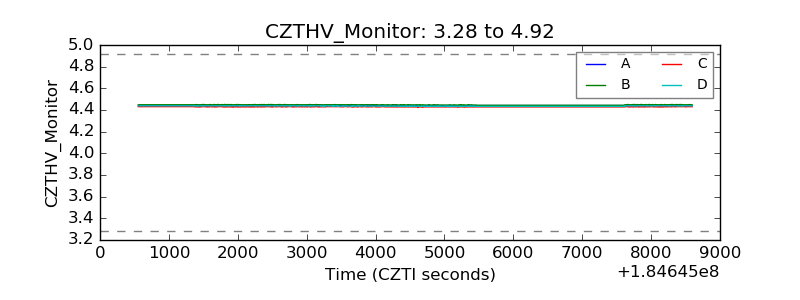 |
| D_VDD | 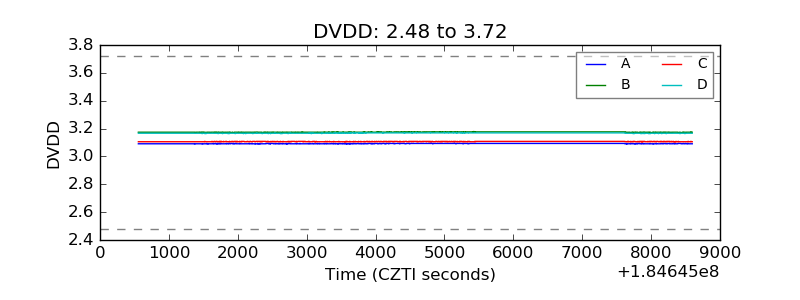 |
| Temperature 1 | 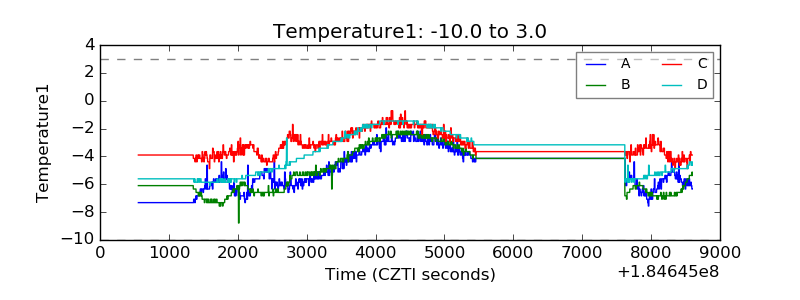 |
| Veto HV Monitor | 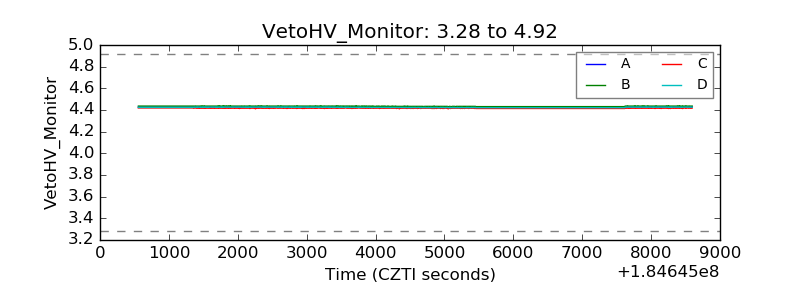 |
| Veto LLD | 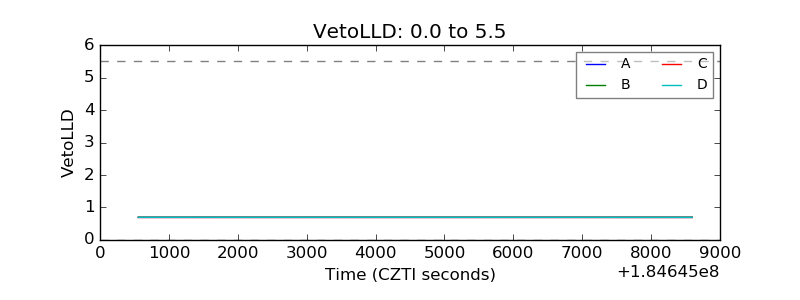 |
| Alpha Counter | 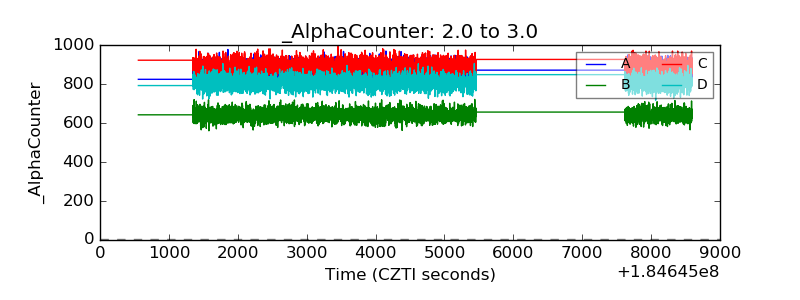 |
| _CPM_Rate | 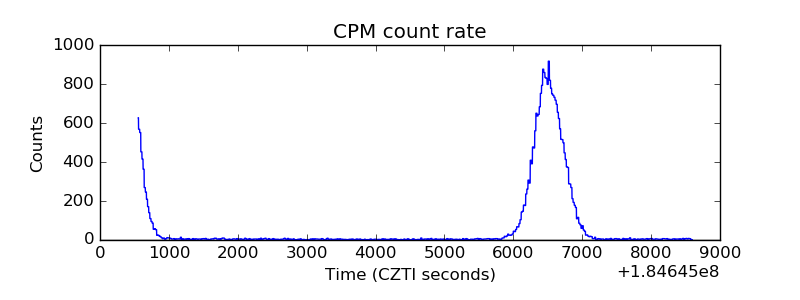 |
| CZT Counter | 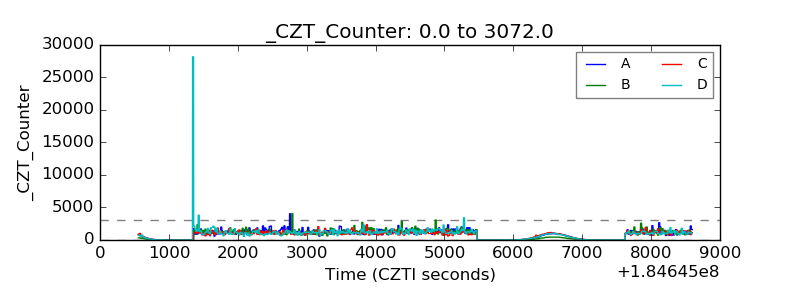 |
| +2.5 Volts monitor |  |
| +5 Volts monitor |  |
| _ROLL_ROT | 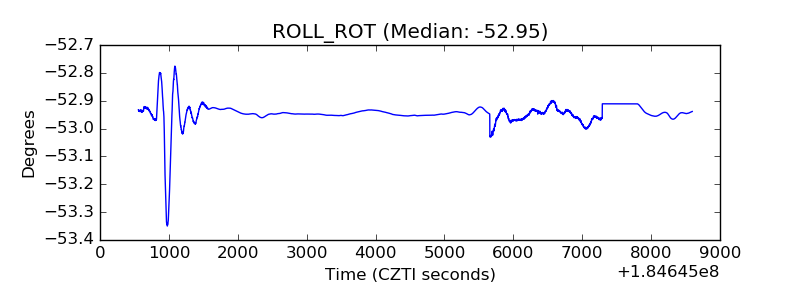 |
| _Roll_DEC | 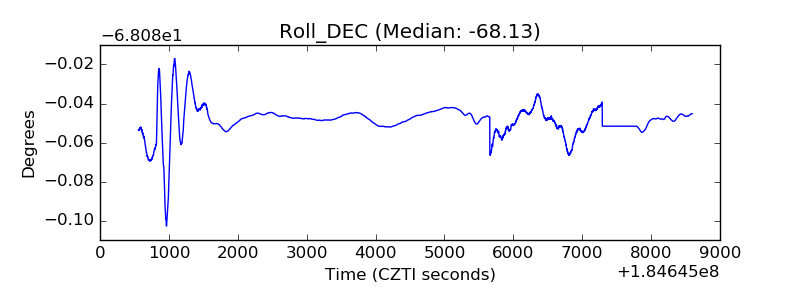 |
| _Roll_RA | 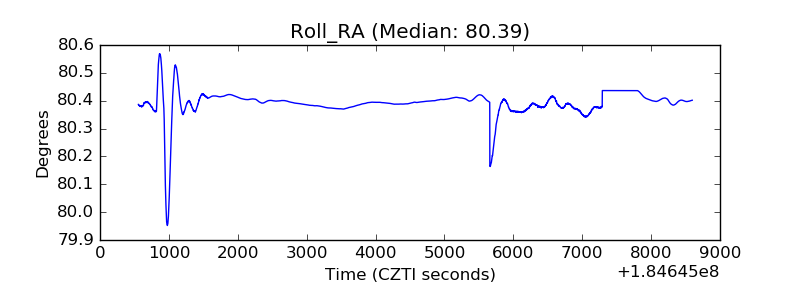 |
| Veto Counter | 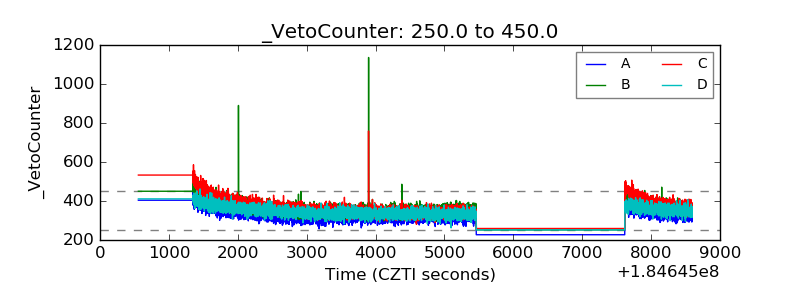 |