| Param | Original file | Final file |
|---|---|---|
| Filename | modeM0/AS1P01_126T01_9000000084_00609cztM0_level2.evt | modeM0/AS1P01_126T01_9000000084_00609cztM0_level2_quad_clean.evt |
| Size (bytes) | 784,869,120 | 59,195,520 |
| Size | 748.5 MB | 56.5 MB |
| Events in quadrant A | 6,028,476 | 359,862 |
| Events in quadrant B | 5,935,898 | 372,991 |
| Events in quadrant C | 5,454,625 | 367,255 |
| Events in quadrant D | 6,030,425 | 353,745 |
| Mode M9 | |||
|---|---|---|---|
| Quadrant | BADHDUFLAG | Total packets | Discarded packets |
| A | 0 | 22 | 0 |
| B | 0 | 22 | 0 |
| C | 0 | 22 | 0 |
| D | 0 | 22 | 0 |
| Mode M0 | |||
|---|---|---|---|
| Quadrant | BADHDUFLAG | Total packets | Discarded packets |
| A | 0 | 21353 | 2 |
| B | 0 | 21028 | 1 |
| C | 0 | 19627 | 1 |
| D | 0 | 21319 | 1 |
| Mode SS | |||
|---|---|---|---|
| Quadrant | BADHDUFLAG | Total packets | Discarded packets |
| A | 0 | 98 | 0 |
| B | 0 | 98 | 0 |
| C | 0 | 98 | 0 |
| D | 0 | 98 | 0 |
| Quadrant | Total seconds | Saturated seconds | Saturation percentage |
|---|---|---|---|
| A | 4822 | 65 | 1.347988% |
| B | 4822 | 20 | 0.414766% |
| C | 4822 | 2 | 0.041477% |
| D | 4822 | 37 | 0.767316% |
Noise dominated data is calculated using 1-second bins in cleaned event files. If a bin has >2000 counts, and if more than 50% of those come from <1% of pixels, then it is considered to be noise-dominated and hence unusable.
| Quadrant | # 1 sec bins | Bins with >0 counts | Bins with >2000 counts | High rate bins dominated by noise | Noise dominated (total time) | Noise dominated (detector-on time) | Marked lightcurve |
|---|---|---|---|---|---|---|---|
| A | 6977 | 4823 | 190 | 190 | 2.72% | 3.94% | 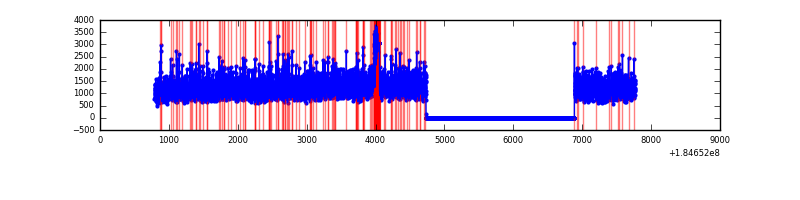 |
| B | 6977 | 4823 | 129 | 129 | 1.85% | 2.67% |  |
| C | 6977 | 4823 | 51 | 51 | 0.73% | 1.06% | 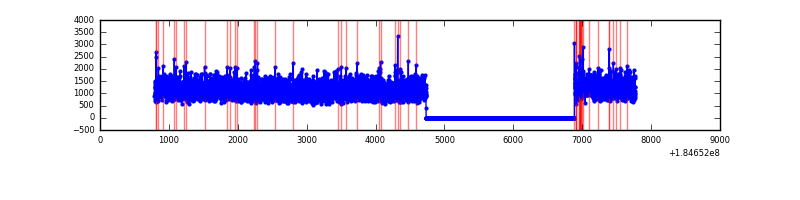 |
| D | 6977 | 4823 | 186 | 186 | 2.67% | 3.86% | 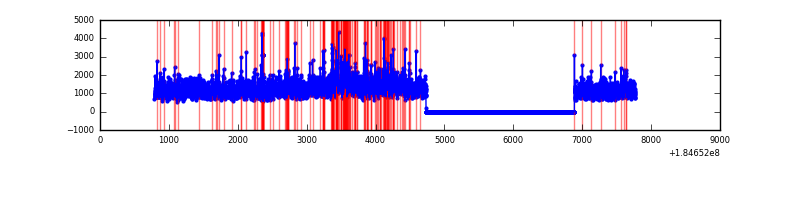 |
Top three noisy pixels from each quadrant. If the there are fewer than three noisy pixels in the level2.evt file, extra rows are filled as -1
| Pixel properties | Quadrant properties | ||||||
|---|---|---|---|---|---|---|---|
| Quadrant | DetID | PixID | Counts | Sigma | Mean | Median | Sigma |
| A | 15 | 171 | 221514 | 682.0 | 1468 | 1451 | 322.7 |
| A | 0 | 149 | 58013 | 175.29 | 1468 | 1451 | 322.7 |
| A | 0 | 238 | 34452 | 102.27 | 1468 | 1451 | 322.7 |
| B | 7 | 221 | 290534 | 849.64 | 1447 | 1454 | 340.2 |
| B | 5 | 191 | 45116 | 128.33 | 1447 | 1454 | 340.2 |
| B | 8 | 4 | 21952 | 60.25 | 1447 | 1454 | 340.2 |
| C | 1 | 1 | 85005 | 222.25 | 1348 | 1400 | 376.2 |
| C | 7 | 190 | 21317 | 52.95 | 1348 | 1400 | 376.2 |
| C | 10 | 19 | 18905 | 46.54 | 1348 | 1400 | 376.2 |
| D | 1 | 4 | 464140 | 1131.35 | 1306 | 1356 | 409.1 |
| D | 13 | 221 | 165779 | 401.96 | 1306 | 1356 | 409.1 |
| D | 12 | 237 | 76526 | 183.76 | 1306 | 1356 | 409.1 |
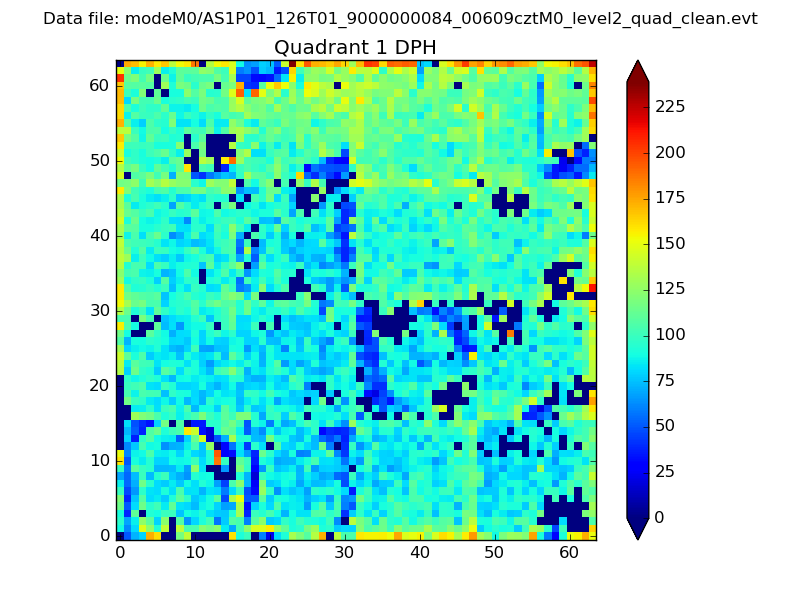
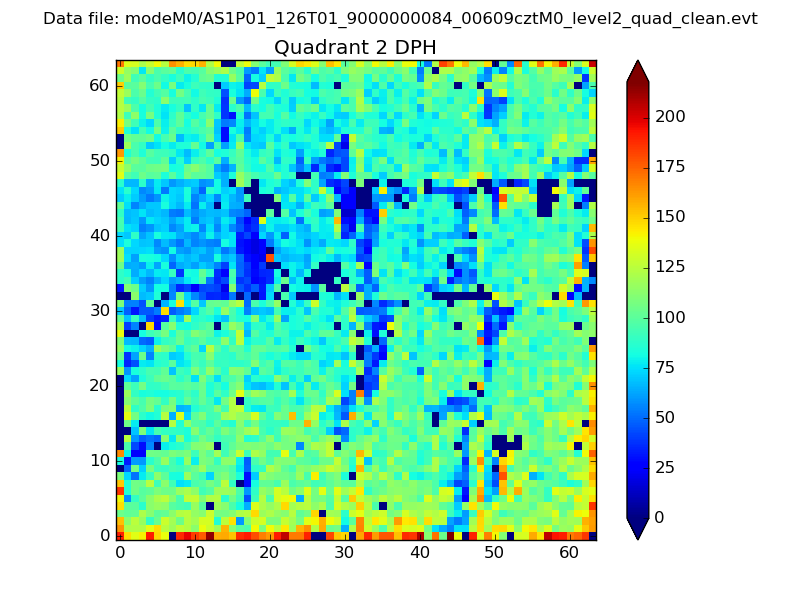
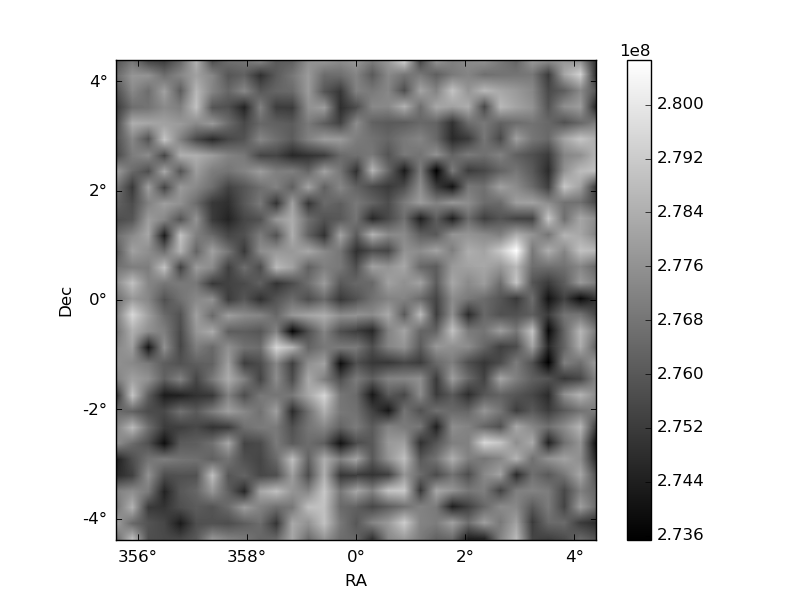
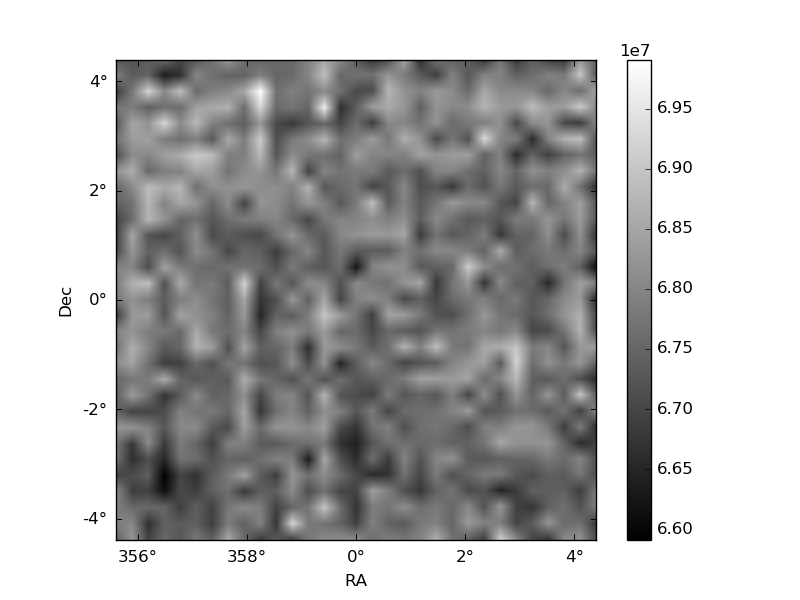
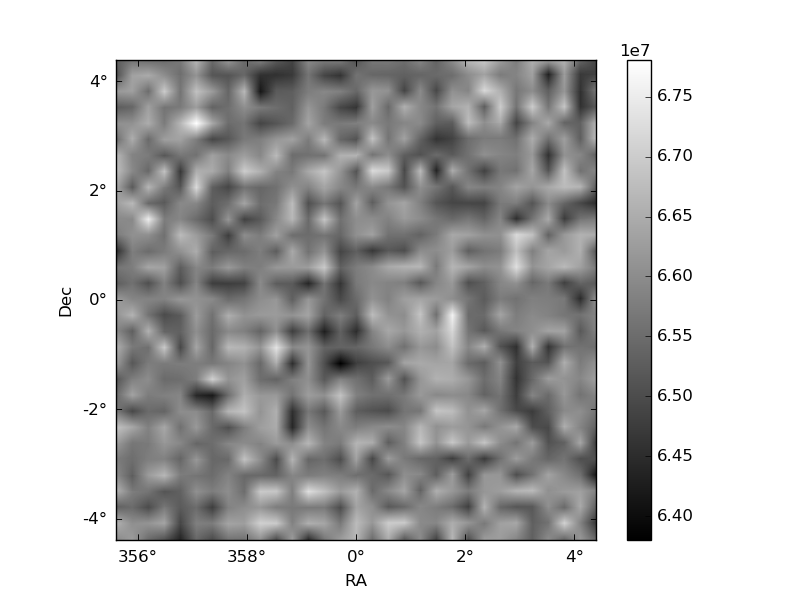
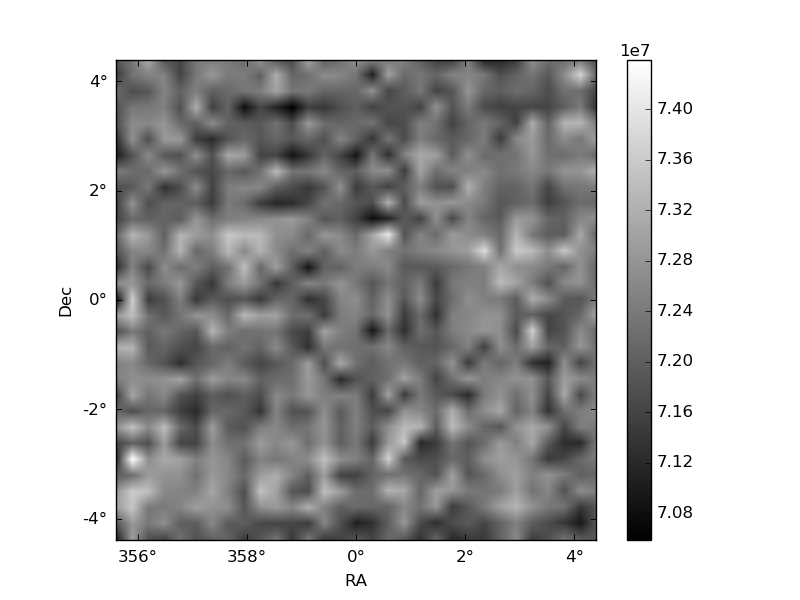
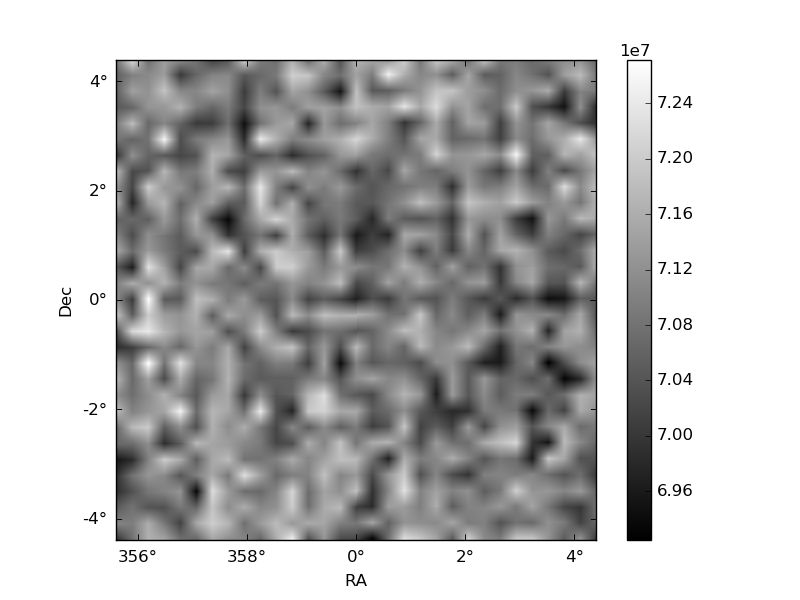
Histogram calculated using DETX and DETY for each event in the final _common_clean file
| Quadrant A | 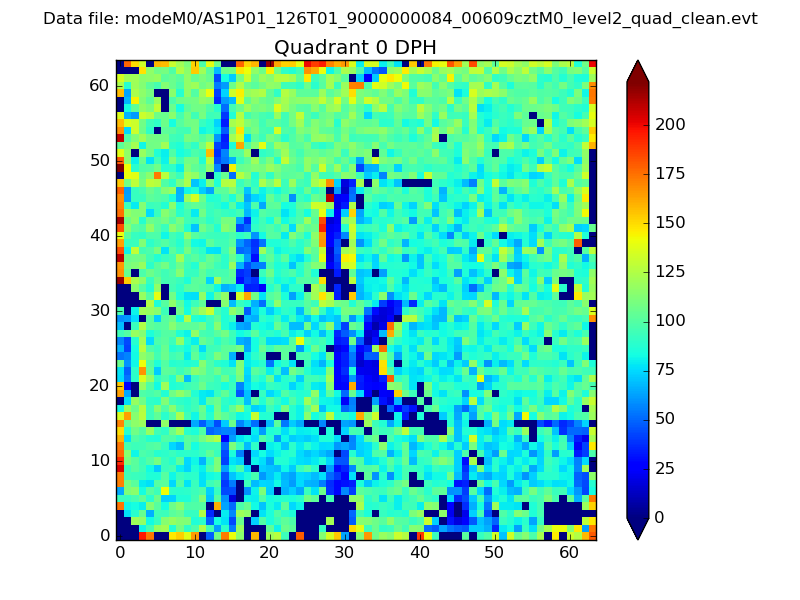 |
 |
Quadrant B |
|---|---|---|---|
| Quadrant D | 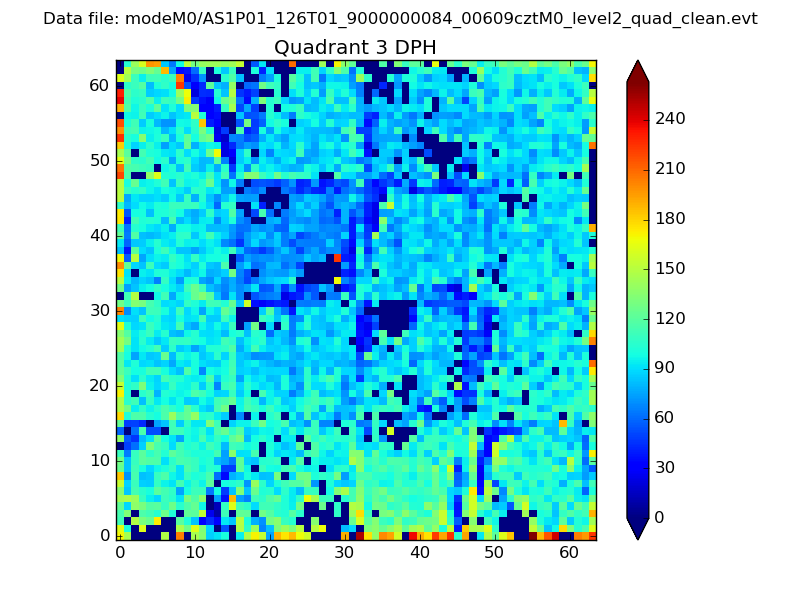 |
 |
Quadrant C |
| Plot type | Count rate plots | Images |
|---|---|---|
| Comparison with Poisson distribution Blue bars denote a histogram of data divided into 1 sec bins. Red curve is a Poisson curve with rate = median count rate of data. |
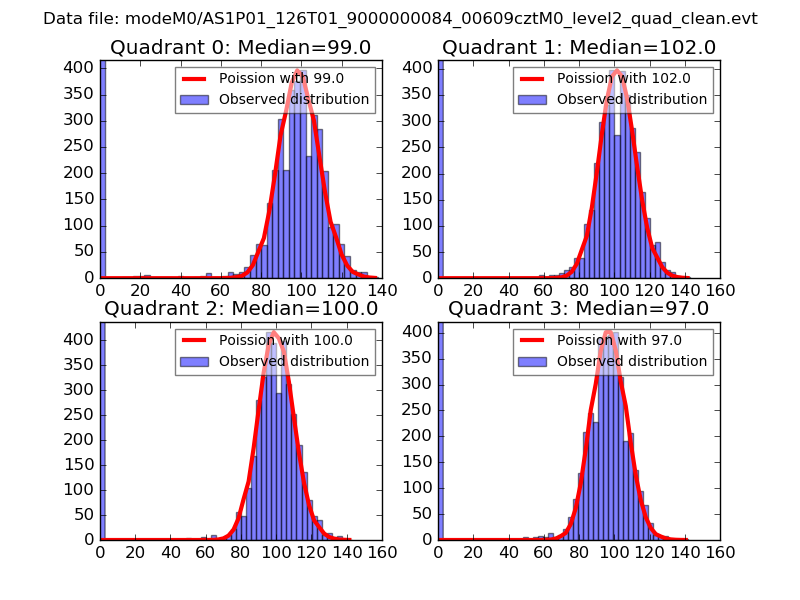 |
 |
| Quadrant-wise count rates Data is divided into 100 sec bins |
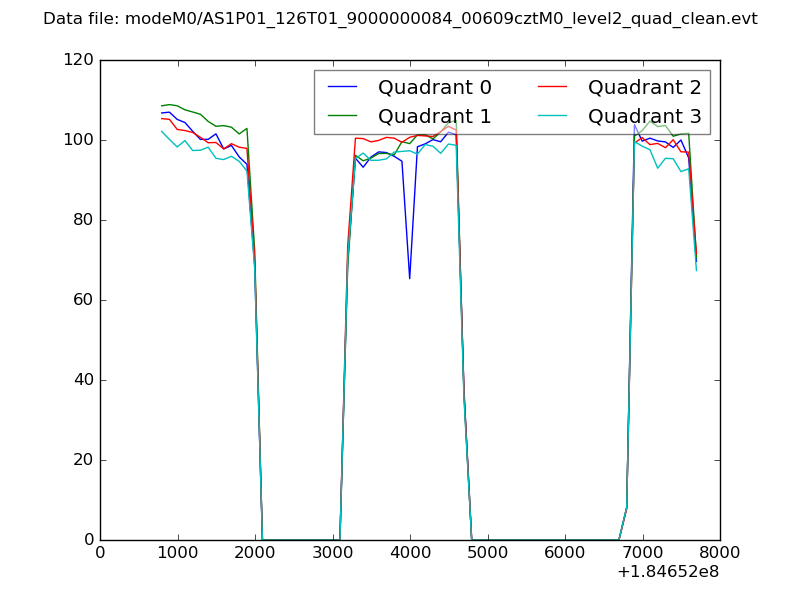 |
|
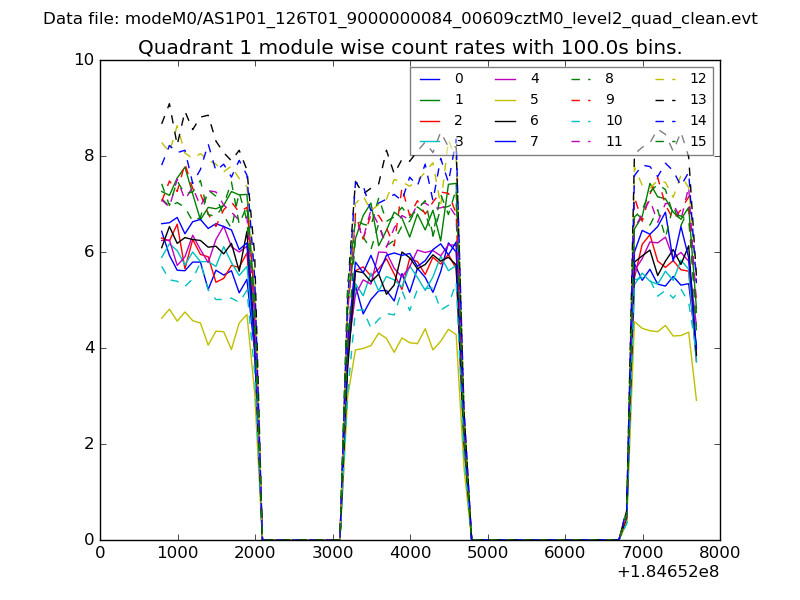
| Module-wise count rates for Quadrant A Data is divided into 100 sec bins |
 |
 |
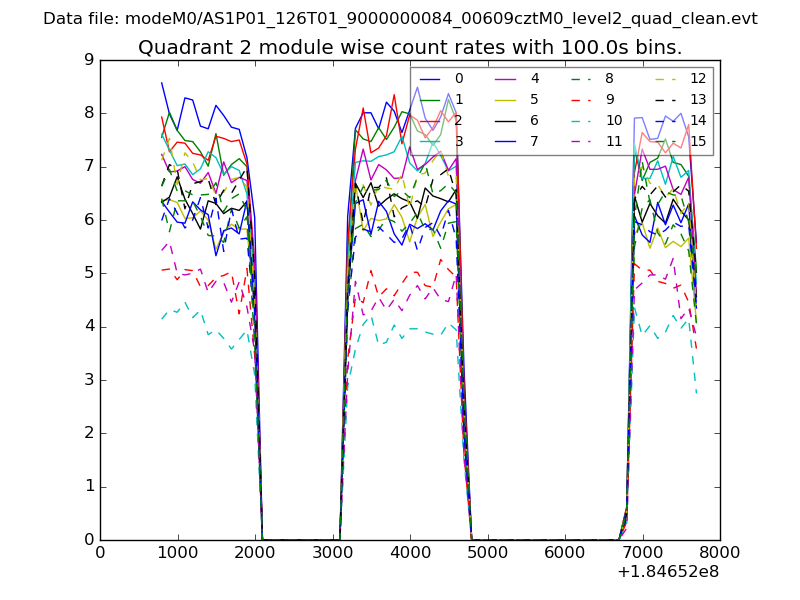
| Module-wise count rates for Quadrant B Data is divided into 100 sec bins |
 |
 |
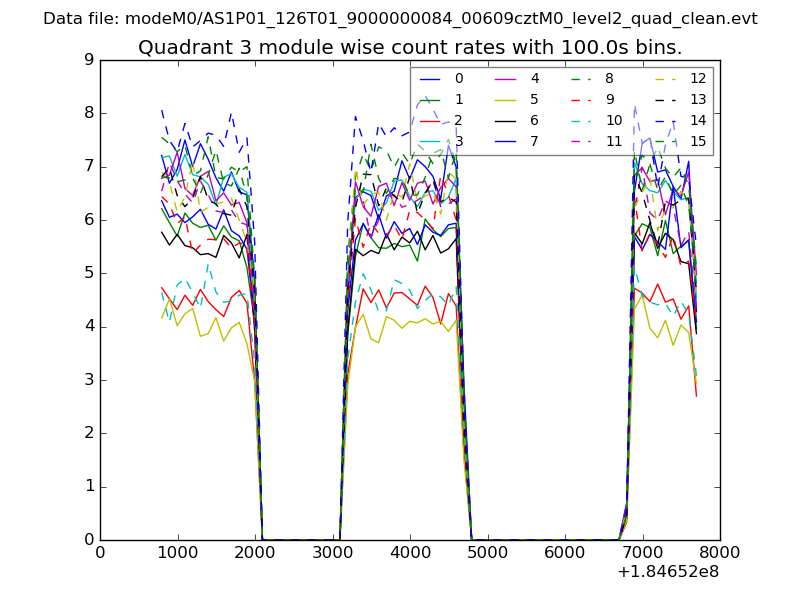
| Module-wise count rates for Quadrant C Data is divided into 100 sec bins |
 |
 |
| Module-wise count rates for Quadrant D Data is divided into 100 sec bins |
 |
 |
| Parameter | Plot |
|---|---|
| CZT HV Monitor | 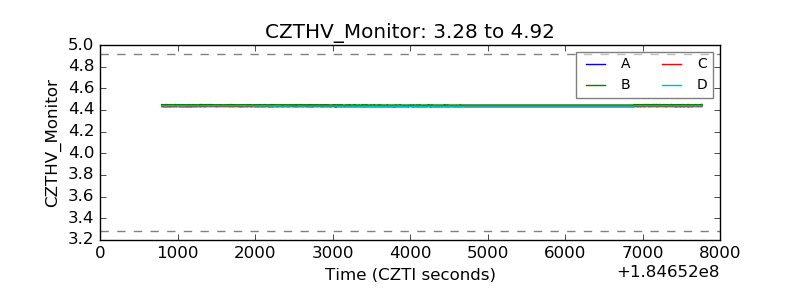 |
| D_VDD |  |
| Temperature 1 | 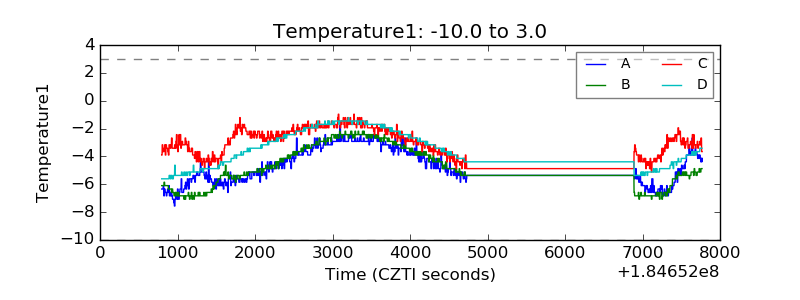 |
| Veto HV Monitor | 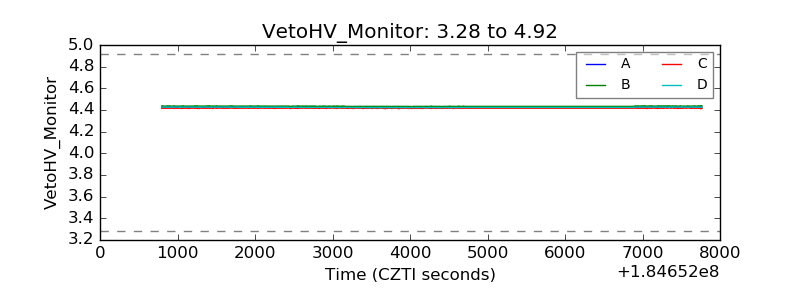 |
| Veto LLD |  |
| Alpha Counter | 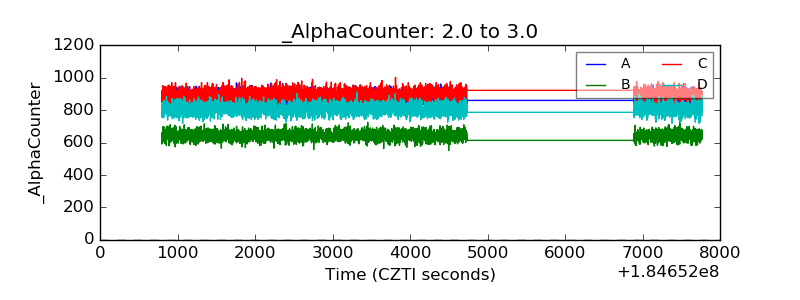 |
| _CPM_Rate | 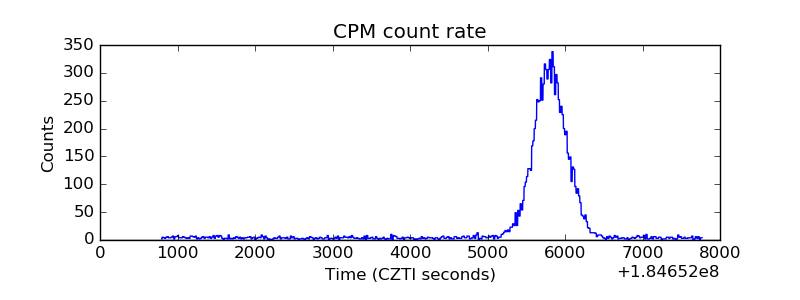 |
| CZT Counter | 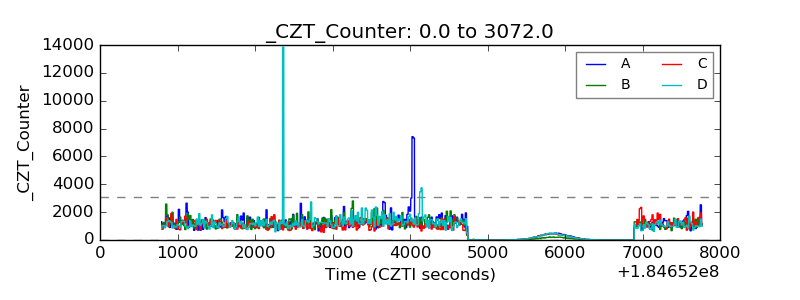 |
| +2.5 Volts monitor |  |
| +5 Volts monitor |  |
| _ROLL_ROT | 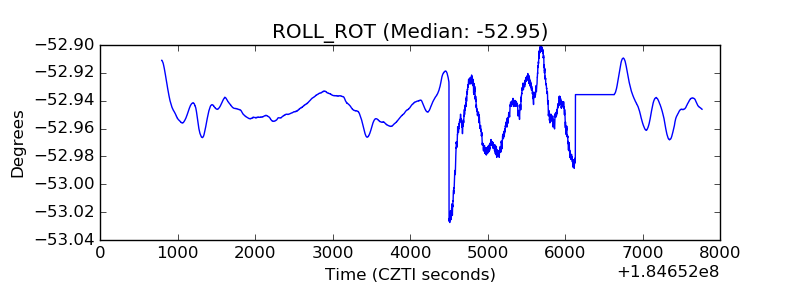 |
| _Roll_DEC | 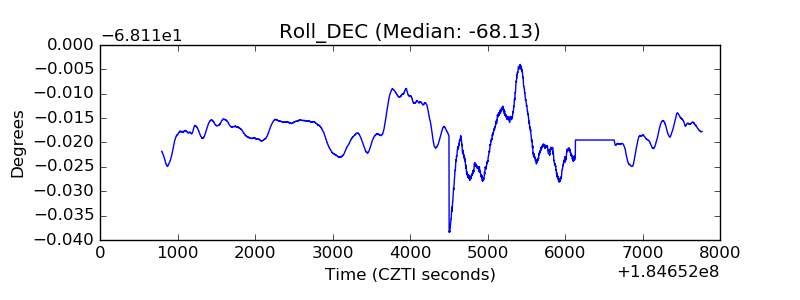 |
| _Roll_RA | 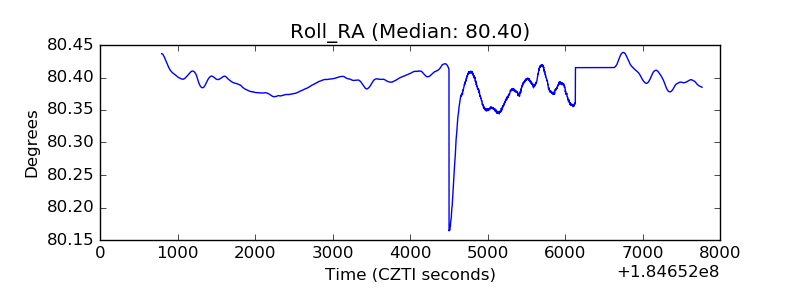 |
| Veto Counter | 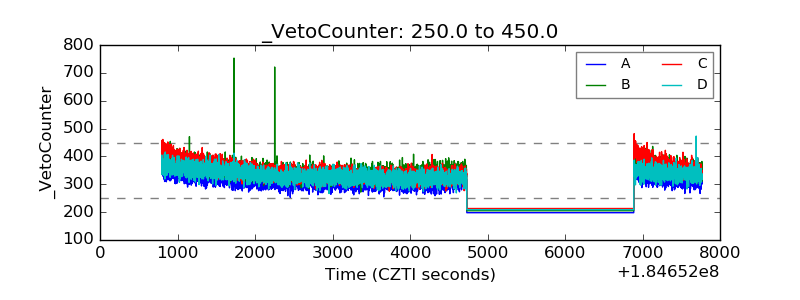 |