| Param | Original file | Final file |
|---|---|---|
| Filename | modeM0/AS1P01_126T01_9000000084_00610cztM0_level2.evt | modeM0/AS1P01_126T01_9000000084_00610cztM0_level2_quad_clean.evt |
| Size (bytes) | 774,552,960 | 56,877,120 |
| Size | 738.7 MB | 54.2 MB |
| Events in quadrant A | 5,920,116 | 344,605 |
| Events in quadrant B | 6,011,324 | 351,023 |
| Events in quadrant C | 5,462,737 | 348,381 |
| Events in quadrant D | 5,739,051 | 335,956 |
| Mode M9 | |||
|---|---|---|---|
| Quadrant | BADHDUFLAG | Total packets | Discarded packets |
| A | 0 | 24 | 0 |
| B | 0 | 24 | 0 |
| C | 0 | 24 | 0 |
| D | 0 | 25 | 0 |
| Mode M0 | |||
|---|---|---|---|
| Quadrant | BADHDUFLAG | Total packets | Discarded packets |
| A | 0 | 21078 | 3 |
| B | 0 | 21345 | 2 |
| C | 0 | 19705 | 2 |
| D | 0 | 20488 | 2 |
| Mode SS | |||
|---|---|---|---|
| Quadrant | BADHDUFLAG | Total packets | Discarded packets |
| A | 0 | 98 | 0 |
| B | 0 | 98 | 0 |
| C | 0 | 98 | 0 |
| D | 0 | 98 | 0 |
| Quadrant | Total seconds | Saturated seconds | Saturation percentage |
|---|---|---|---|
| A | 4879 | 8 | 0.163968% |
| B | 4879 | 26 | 0.532896% |
| C | 4879 | 2 | 0.040992% |
| D | 4879 | 35 | 0.717360% |
Noise dominated data is calculated using 1-second bins in cleaned event files. If a bin has >2000 counts, and if more than 50% of those come from <1% of pixels, then it is considered to be noise-dominated and hence unusable.
| Quadrant | # 1 sec bins | Bins with >0 counts | Bins with >2000 counts | High rate bins dominated by noise | Noise dominated (total time) | Noise dominated (detector-on time) | Marked lightcurve |
|---|---|---|---|---|---|---|---|
| A | 7034 | 4880 | 101 | 101 | 1.44% | 2.07% | 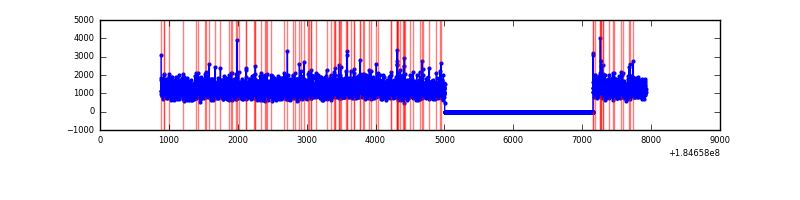 |
| B | 7034 | 4880 | 148 | 148 | 2.10% | 3.03% | 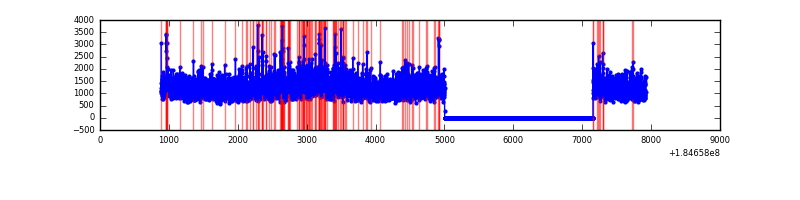 |
| C | 7034 | 4880 | 55 | 55 | 0.78% | 1.13% | 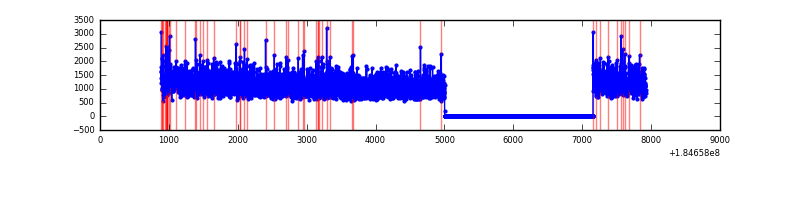 |
| D | 7034 | 4880 | 134 | 134 | 1.91% | 2.75% | 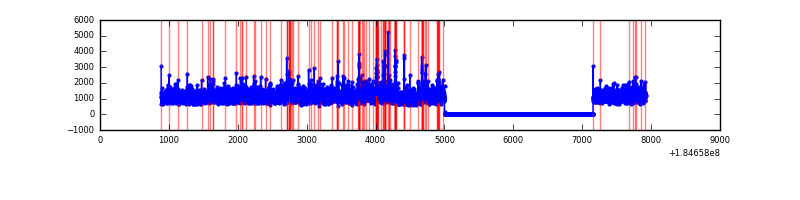 |
Top three noisy pixels from each quadrant. If the there are fewer than three noisy pixels in the level2.evt file, extra rows are filled as -1
| Pixel properties | Quadrant properties | ||||||
|---|---|---|---|---|---|---|---|
| Quadrant | DetID | PixID | Counts | Sigma | Mean | Median | Sigma |
| A | 15 | 171 | 52773 | 155.5 | 1495 | 1479 | 329.9 |
| A | 0 | 238 | 34227 | 99.27 | 1495 | 1479 | 329.9 |
| A | 13 | 160 | 26020 | 74.4 | 1495 | 1479 | 329.9 |
| B | 7 | 221 | 249434 | 725.52 | 1454 | 1462 | 341.8 |
| B | 5 | 191 | 80250 | 230.52 | 1454 | 1462 | 341.8 |
| B | 0 | 220 | 37237 | 104.67 | 1454 | 1462 | 341.8 |
| C | 1 | 1 | 65962 | 172.75 | 1348 | 1397 | 373.7 |
| C | 8 | 208 | 43009 | 111.34 | 1348 | 1397 | 373.7 |
| C | 15 | 241 | 27615 | 70.15 | 1348 | 1397 | 373.7 |
| D | 13 | 221 | 234632 | 565.5 | 1316 | 1366 | 412.5 |
| D | 12 | 237 | 130452 | 312.94 | 1316 | 1366 | 412.5 |
| D | 1 | 4 | 66330 | 157.49 | 1316 | 1366 | 412.5 |
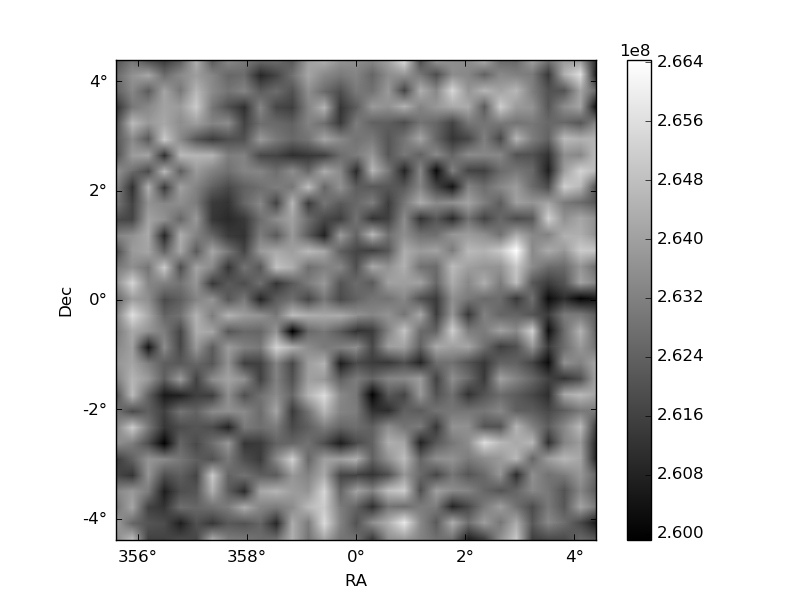
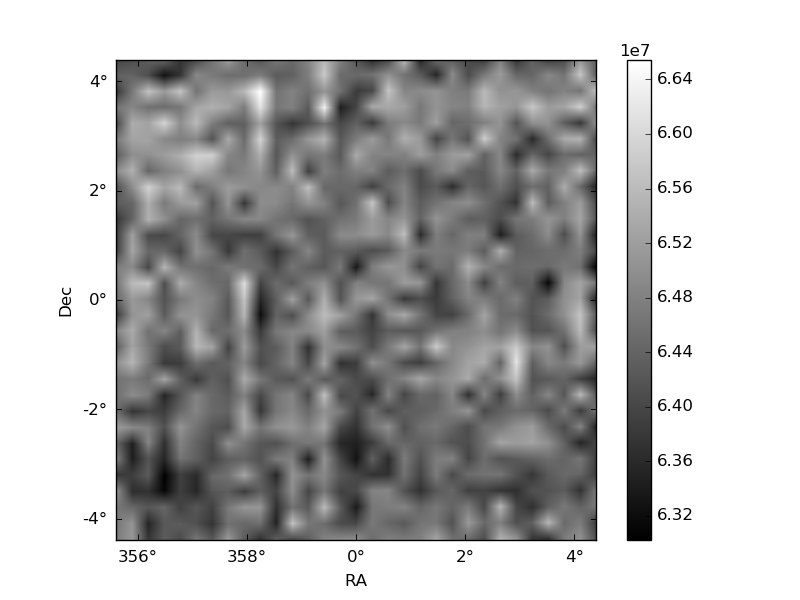
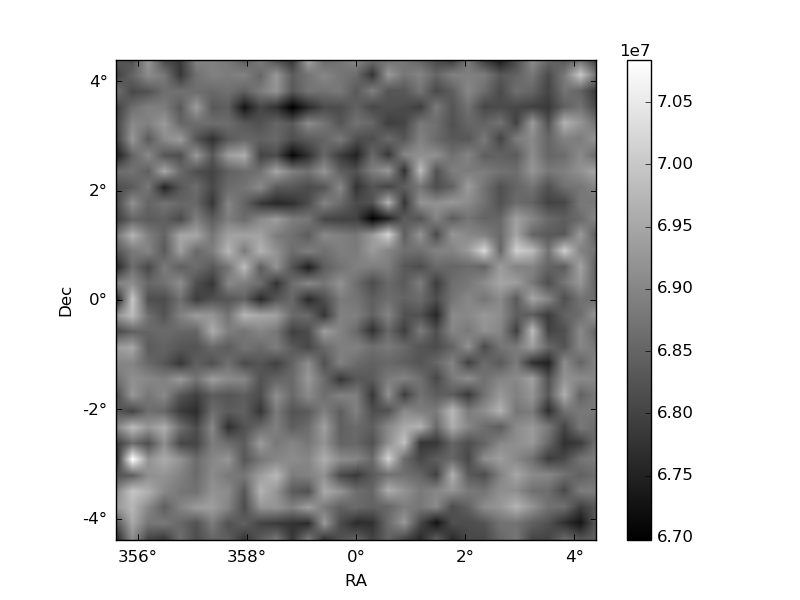
Histogram calculated using DETX and DETY for each event in the final _common_clean file
| Quadrant A | 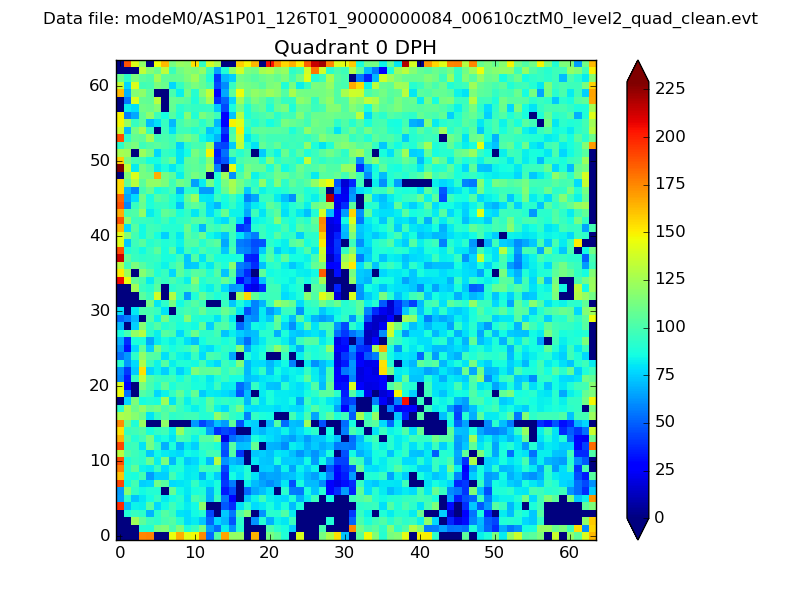 |
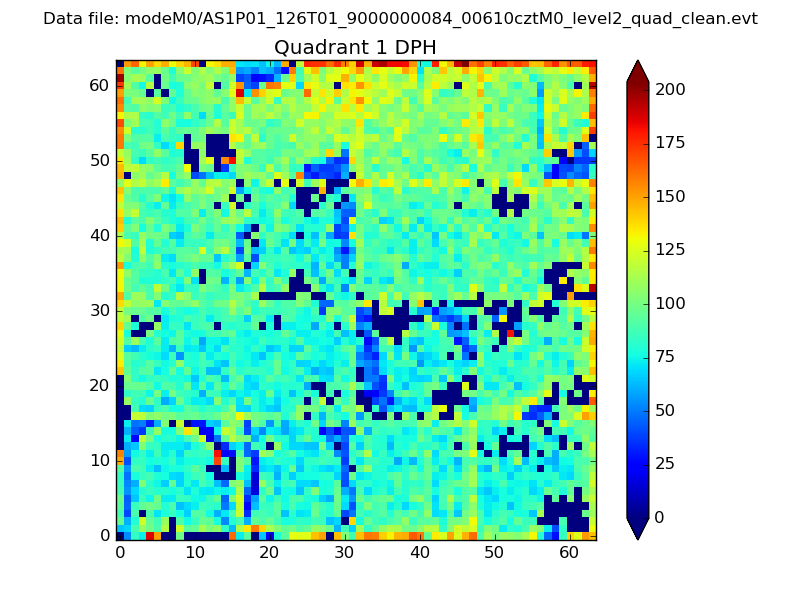 |
Quadrant B |
|---|---|---|---|
| Quadrant D | 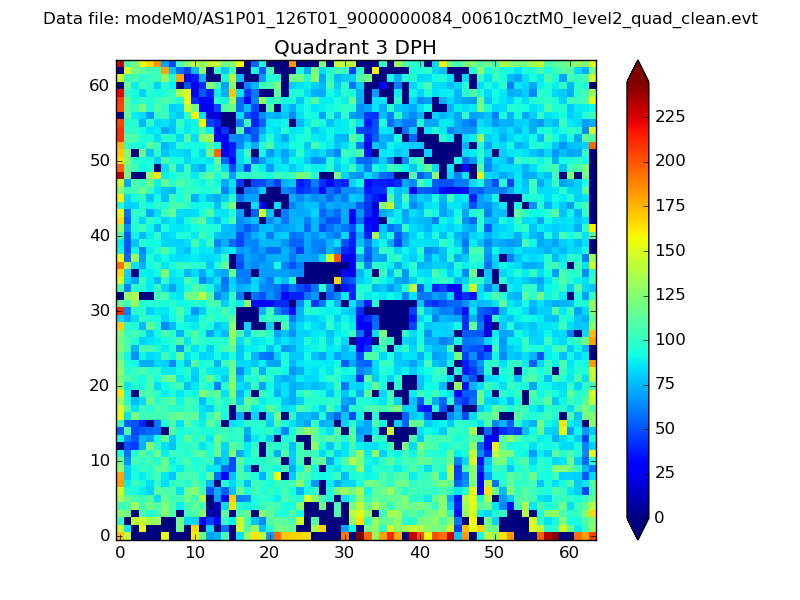 |
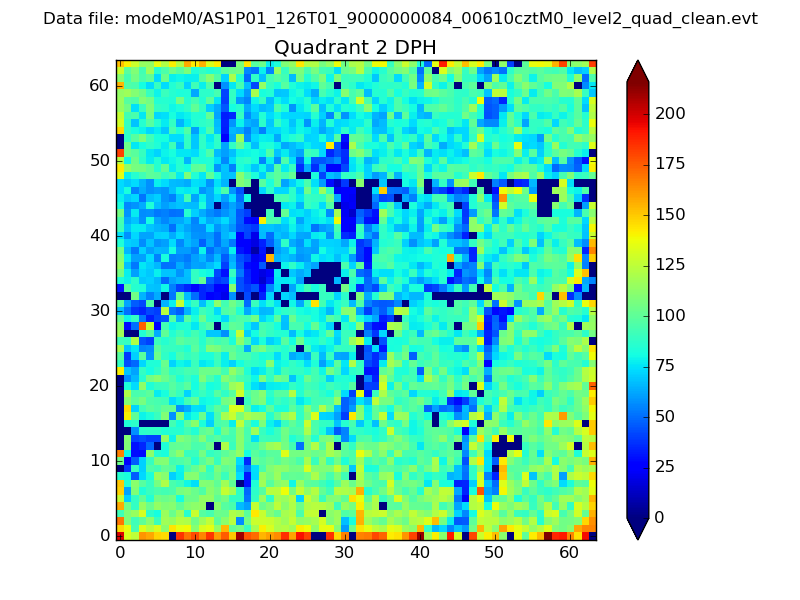 |
Quadrant C |
| Plot type | Count rate plots | Images |
|---|---|---|
| Comparison with Poisson distribution Blue bars denote a histogram of data divided into 1 sec bins. Red curve is a Poisson curve with rate = median count rate of data. |
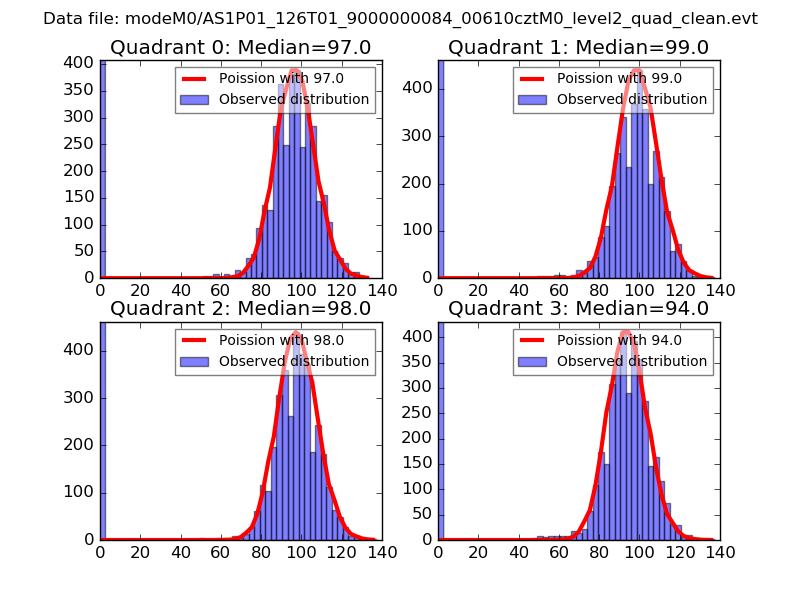 |
 |
| Quadrant-wise count rates Data is divided into 100 sec bins |
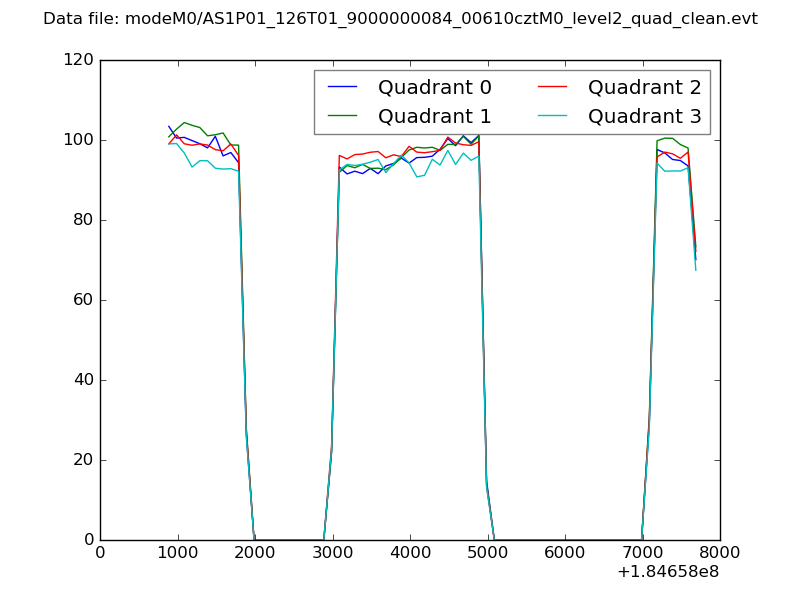 |
|
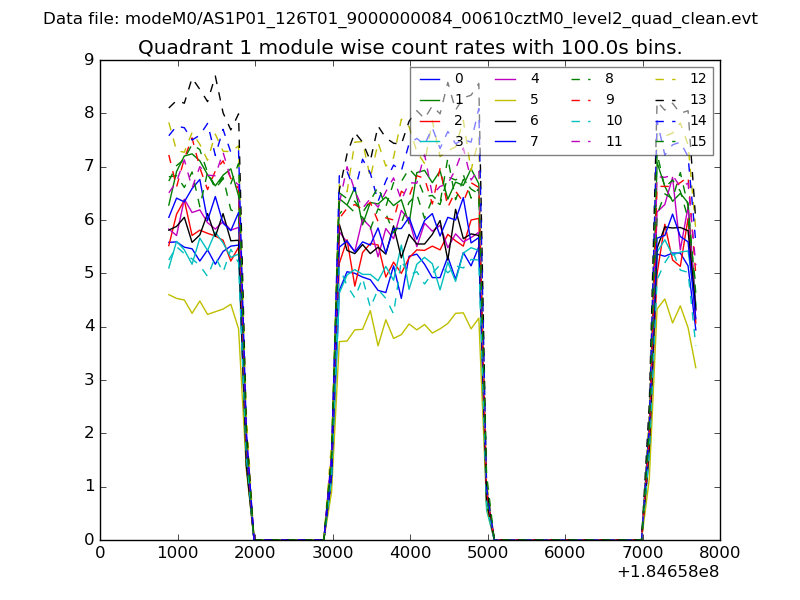
| Module-wise count rates for Quadrant A Data is divided into 100 sec bins |
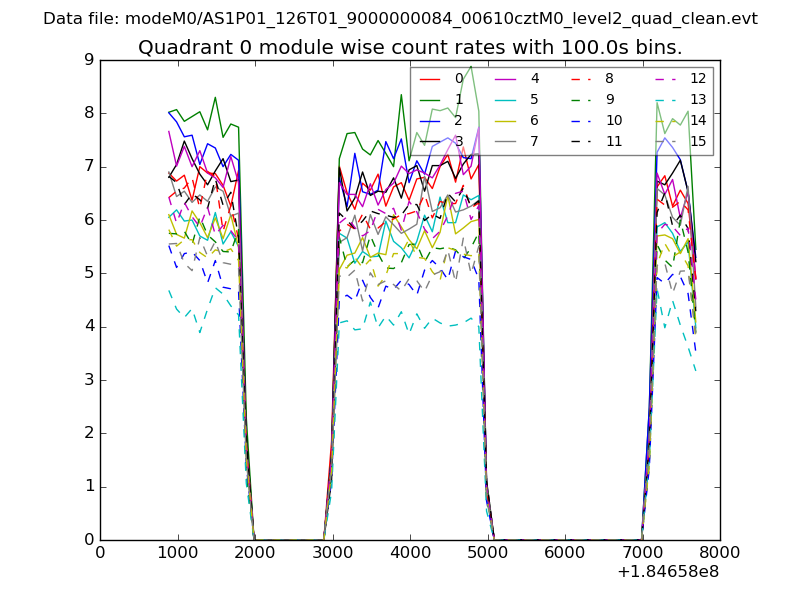 |
 |
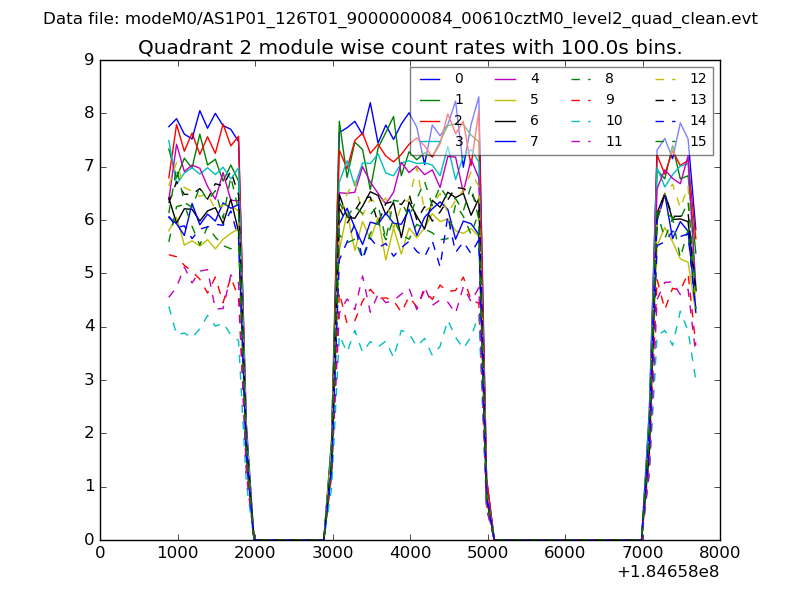
| Module-wise count rates for Quadrant B Data is divided into 100 sec bins |
 |
 |
| Module-wise count rates for Quadrant C Data is divided into 100 sec bins |
 |
 |
| Module-wise count rates for Quadrant D Data is divided into 100 sec bins |
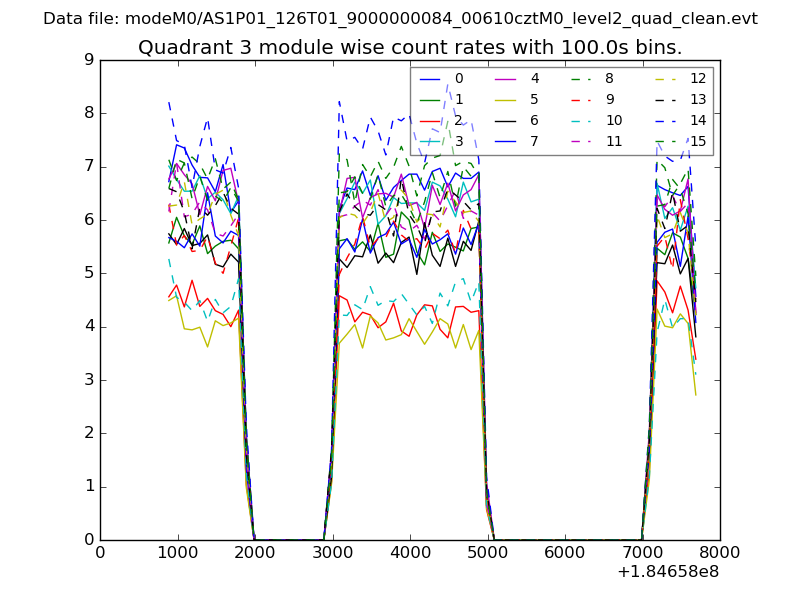 |
 |
| Parameter | Plot |
|---|---|
| CZT HV Monitor | 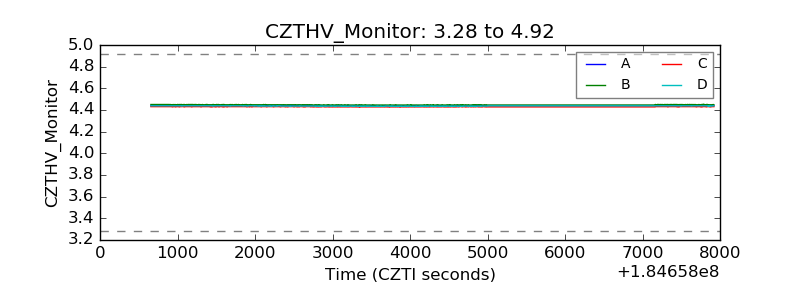 |
| D_VDD | 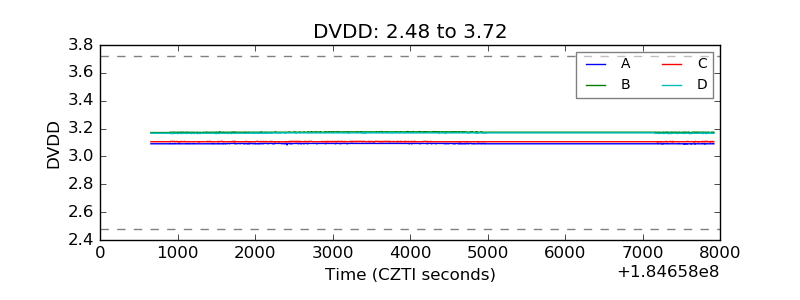 |
| Temperature 1 | 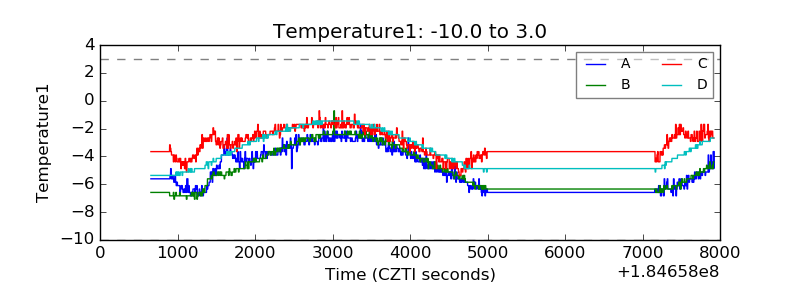 |
| Veto HV Monitor | 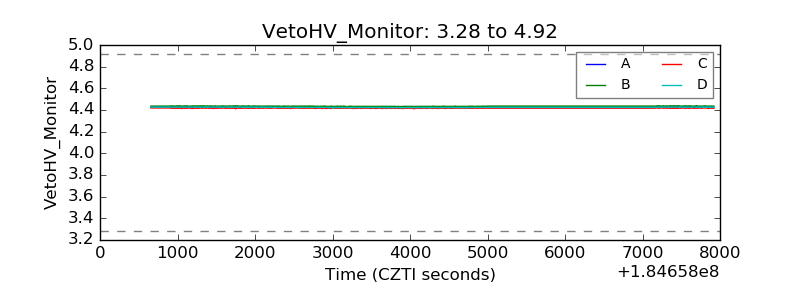 |
| Veto LLD | 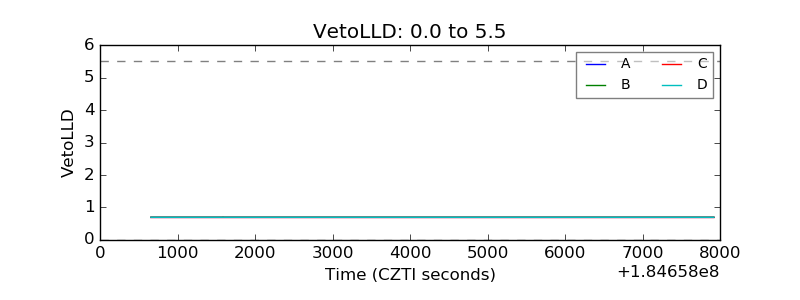 |
| Alpha Counter | 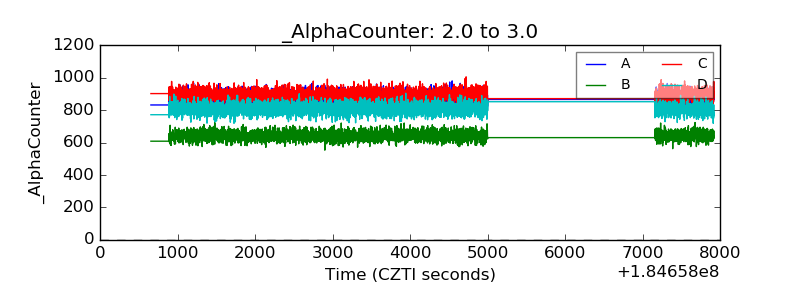 |
| _CPM_Rate | 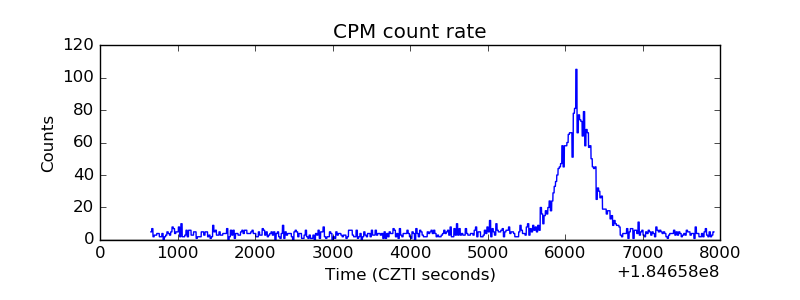 |
| CZT Counter | 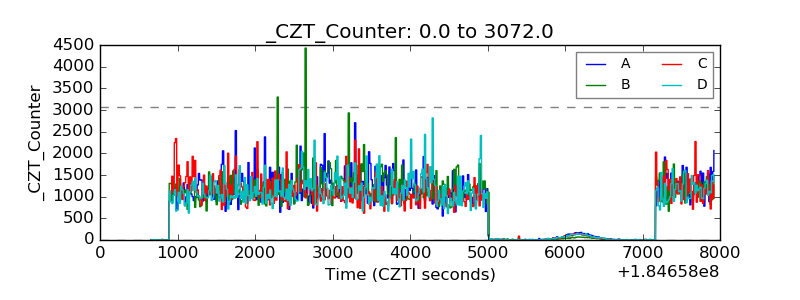 |
| +2.5 Volts monitor |  |
| +5 Volts monitor |  |
| _ROLL_ROT | 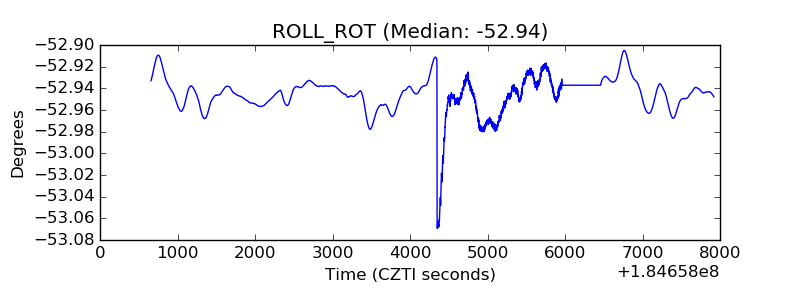 |
| _Roll_DEC | 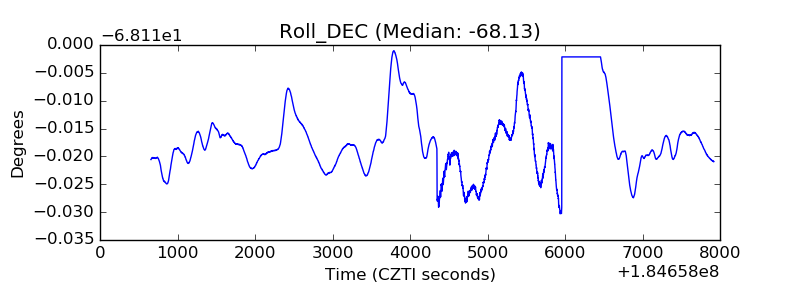 |
| _Roll_RA | 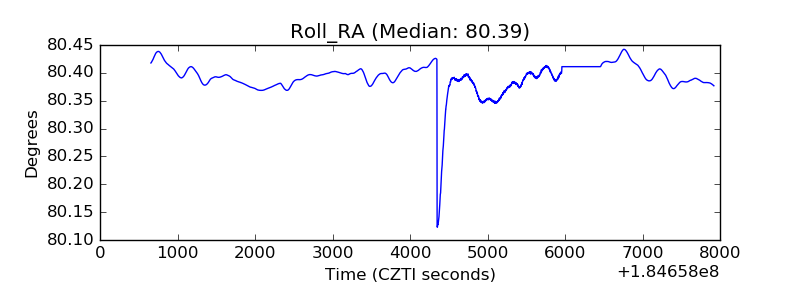 |
| Veto Counter | 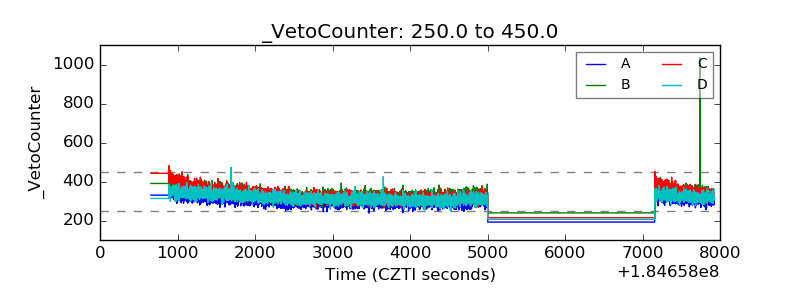 |