| Param | Original file | Final file |
|---|---|---|
| Filename | modeM0/AS1P01_116T01_9000000086_00614cztM0_level2.evt | modeM0/AS1P01_116T01_9000000086_00614cztM0_level2_quad_clean.evt |
| Size (bytes) | 633,723,840 | 53,205,120 |
| Size | 604.4 MB | 50.7 MB |
| Events in quadrant A | 4,924,609 | 333,412 |
| Events in quadrant B | 5,204,830 | 331,856 |
| Events in quadrant C | 4,274,994 | 333,287 |
| Events in quadrant D | 4,513,216 | 322,233 |
| Mode M0 | |||
|---|---|---|---|
| Quadrant | BADHDUFLAG | Total packets | Discarded packets |
| A | 0 | 17545 | 1 |
| B | 0 | 18367 | 1 |
| C | 0 | 15656 | 1 |
| D | 0 | 16348 | 1 |
| Mode M9 | |||
|---|---|---|---|
| Quadrant | BADHDUFLAG | Total packets | Discarded packets |
| A | 0 | 22 | 0 |
| B | 0 | 21 | 0 |
| C | 0 | 21 | 0 |
| D | 0 | 21 | 0 |
| Mode SS | |||
|---|---|---|---|
| Quadrant | BADHDUFLAG | Total packets | Discarded packets |
| A | 0 | 84 | 0 |
| B | 0 | 84 | 0 |
| C | 0 | 84 | 0 |
| D | 0 | 84 | 0 |
| Quadrant | Total seconds | Saturated seconds | Saturation percentage |
|---|---|---|---|
| A | 4115 | 11 | 0.267315% |
| B | 4115 | 63 | 1.530984% |
| C | 4115 | 2 | 0.048603% |
| D | 4115 | 81 | 1.968408% |
Noise dominated data is calculated using 1-second bins in cleaned event files. If a bin has >2000 counts, and if more than 50% of those come from <1% of pixels, then it is considered to be noise-dominated and hence unusable.
| Quadrant | # 1 sec bins | Bins with >0 counts | Bins with >2000 counts | High rate bins dominated by noise | Noise dominated (total time) | Noise dominated (detector-on time) | Marked lightcurve |
|---|---|---|---|---|---|---|---|
| A | 4115 | 4115 | 140 | 140 | 3.40% | 3.40% | 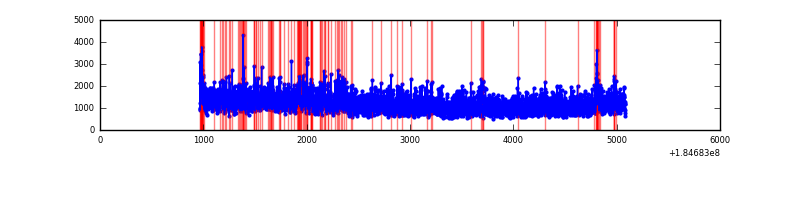 |
| B | 4115 | 4115 | 219 | 219 | 5.32% | 5.32% | 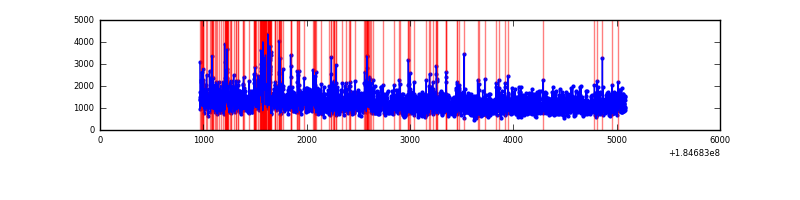 |
| C | 4115 | 4115 | 17 | 17 | 0.41% | 0.41% | 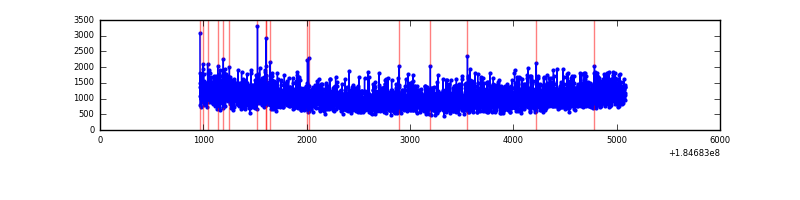 |
| D | 4115 | 4115 | 170 | 170 | 4.13% | 4.13% | 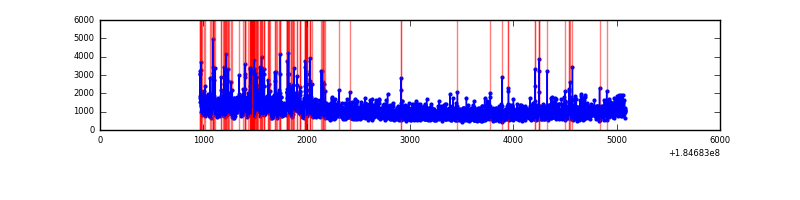 |
Top three noisy pixels from each quadrant. If the there are fewer than three noisy pixels in the level2.evt file, extra rows are filled as -1
| Pixel properties | Quadrant properties | ||||||
|---|---|---|---|---|---|---|---|
| Quadrant | DetID | PixID | Counts | Sigma | Mean | Median | Sigma |
| A | 0 | 69 | 93148 | 336.94 | 1203 | 1187 | 272.9 |
| A | 14 | 79 | 57977 | 208.08 | 1203 | 1187 | 272.9 |
| A | 0 | 238 | 40723 | 144.86 | 1203 | 1187 | 272.9 |
| B | 5 | 191 | 256722 | 898.96 | 1203 | 1209 | 284.2 |
| B | 0 | 220 | 177743 | 621.09 | 1203 | 1209 | 284.2 |
| B | 7 | 221 | 66823 | 230.85 | 1203 | 1209 | 284.2 |
| C | 3 | 159 | 22630 | 71.55 | 1074 | 1112 | 300.7 |
| C | 15 | 241 | 18466 | 57.7 | 1074 | 1112 | 300.7 |
| C | 5 | 249 | 8035 | 23.02 | 1074 | 1112 | 300.7 |
| D | 13 | 221 | 130321 | 383.94 | 1076 | 1084 | 336.6 |
| D | 1 | 4 | 54115 | 157.54 | 1076 | 1084 | 336.6 |
| D | 12 | 22 | 21853 | 61.7 | 1076 | 1084 | 336.6 |
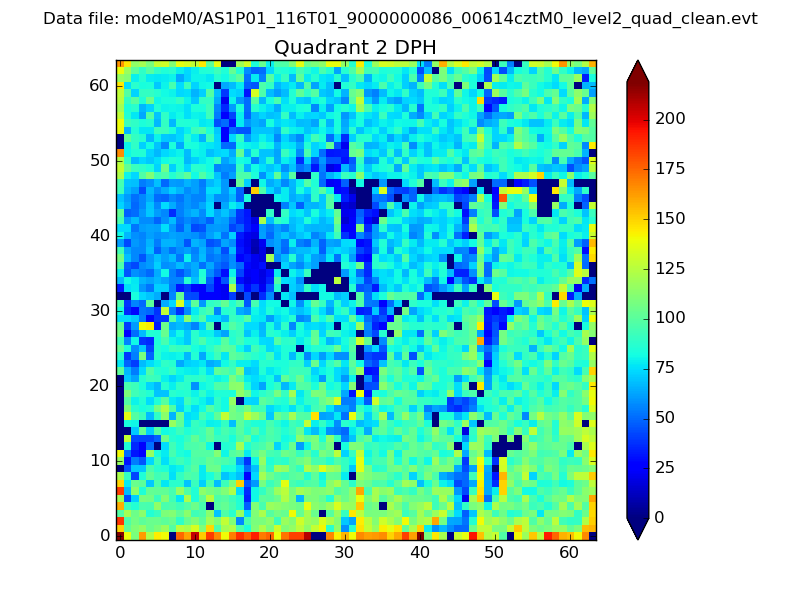
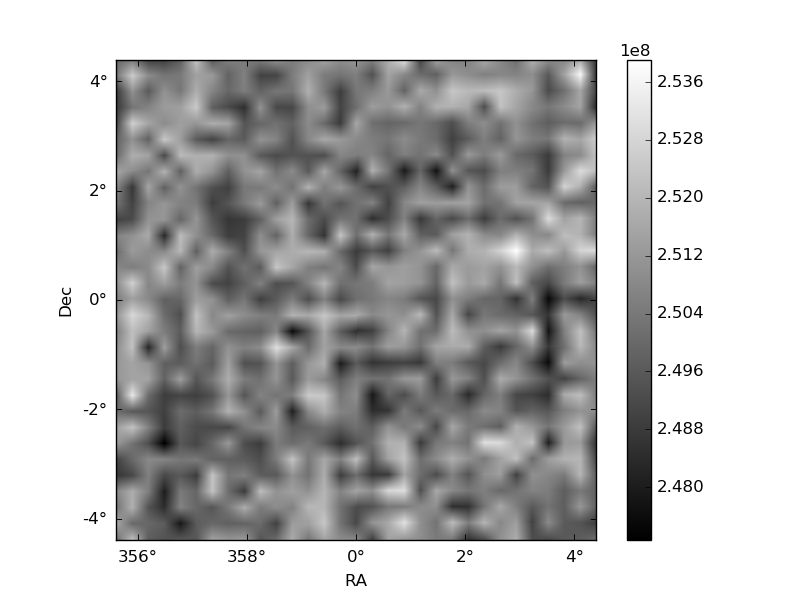
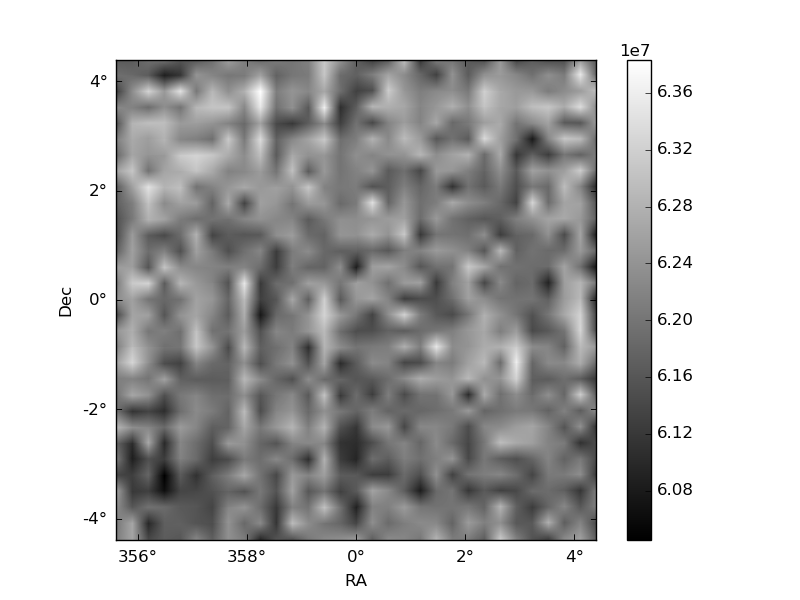
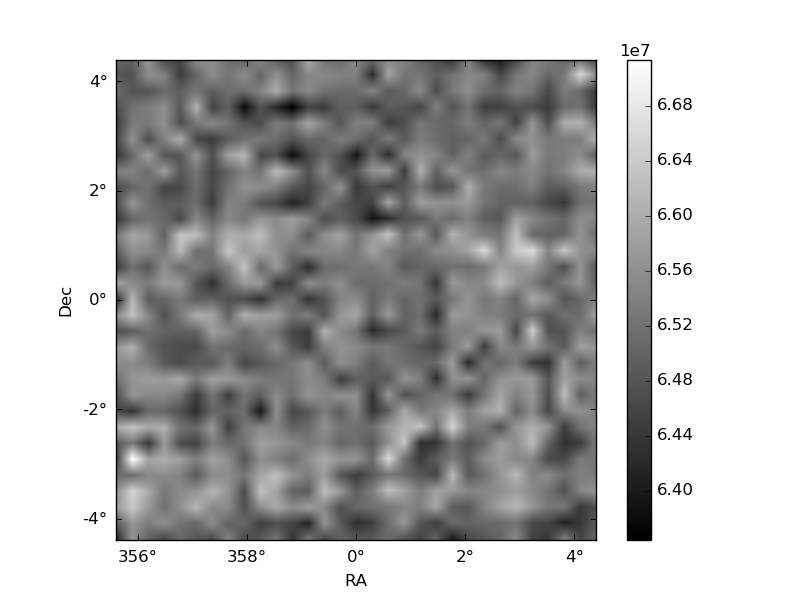
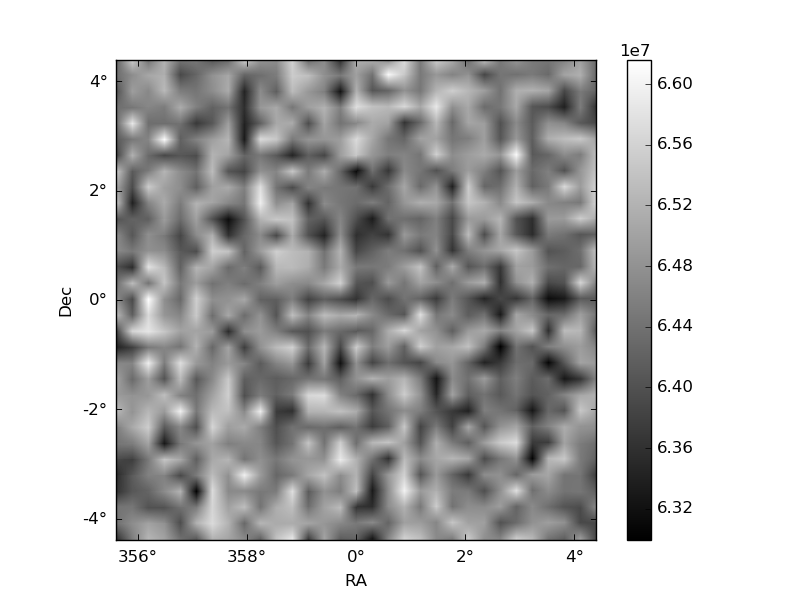
Histogram calculated using DETX and DETY for each event in the final _common_clean file
| Quadrant A | 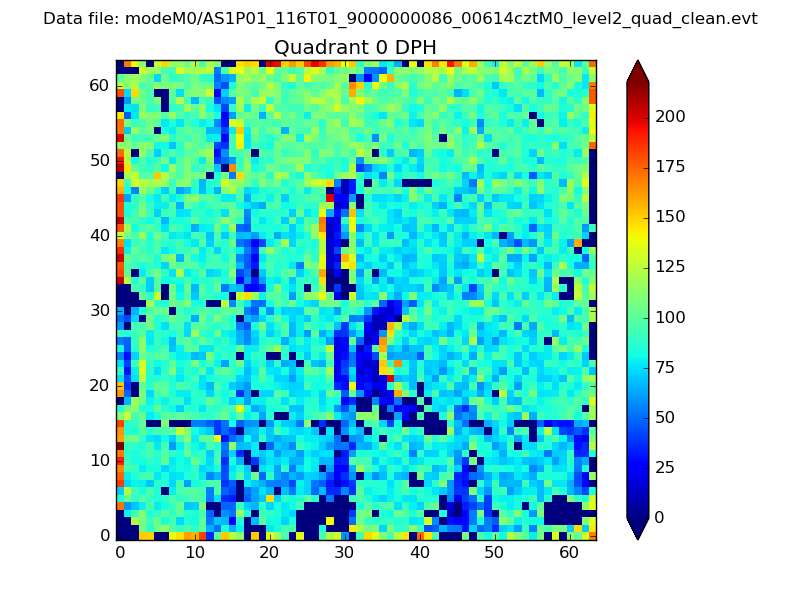 |
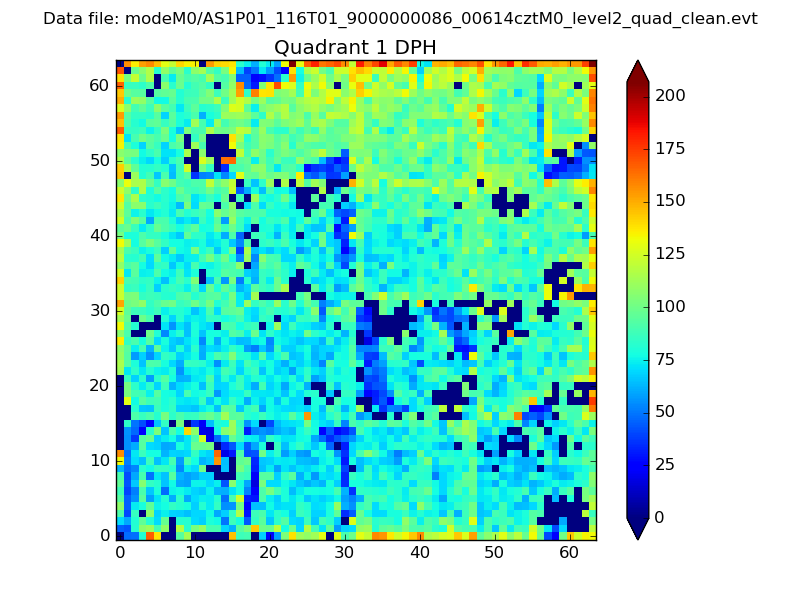 |
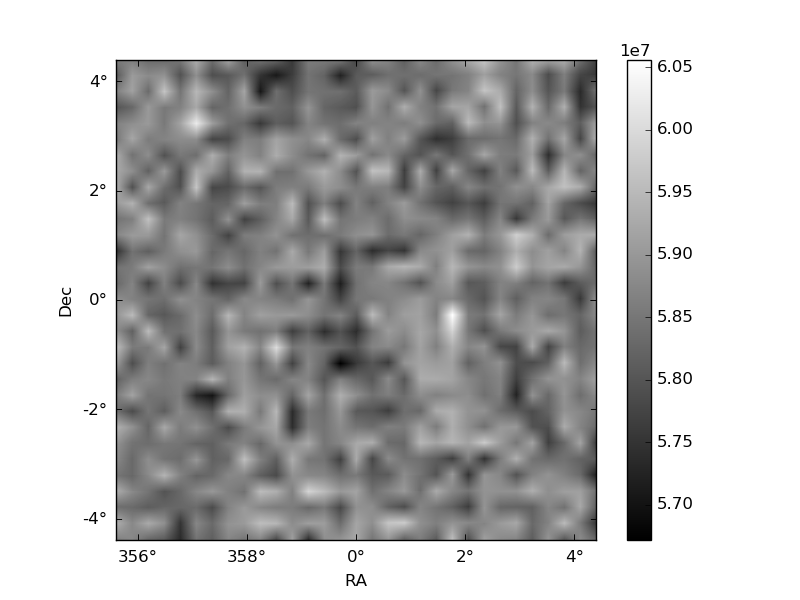
Quadrant B |
|---|---|---|---|
| Quadrant D | 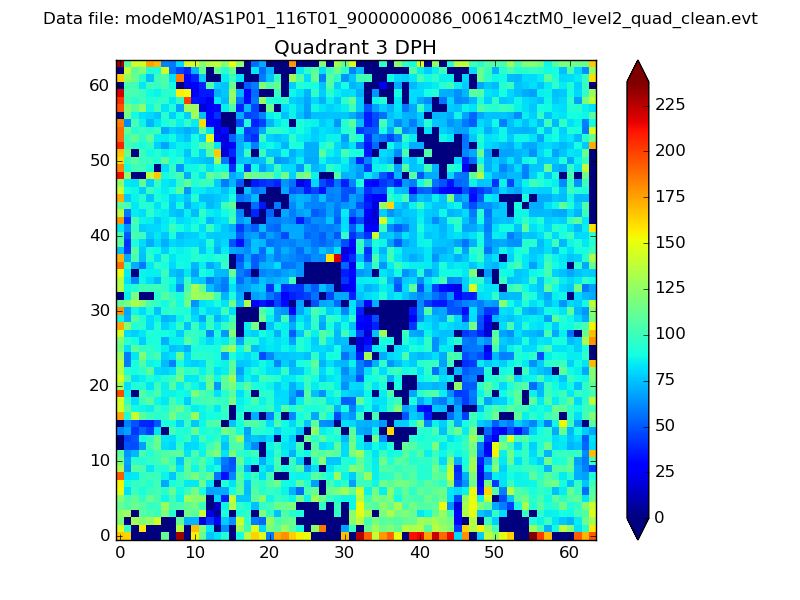 |
 |
Quadrant C |
| Plot type | Count rate plots | Images |
|---|---|---|
| Comparison with Poisson distribution Blue bars denote a histogram of data divided into 1 sec bins. Red curve is a Poisson curve with rate = median count rate of data. |
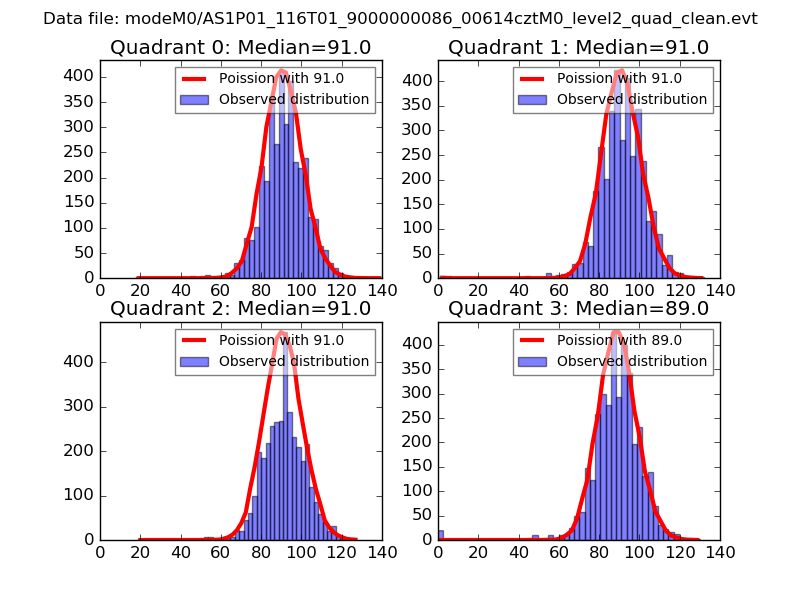 |
 |
| Quadrant-wise count rates Data is divided into 100 sec bins |
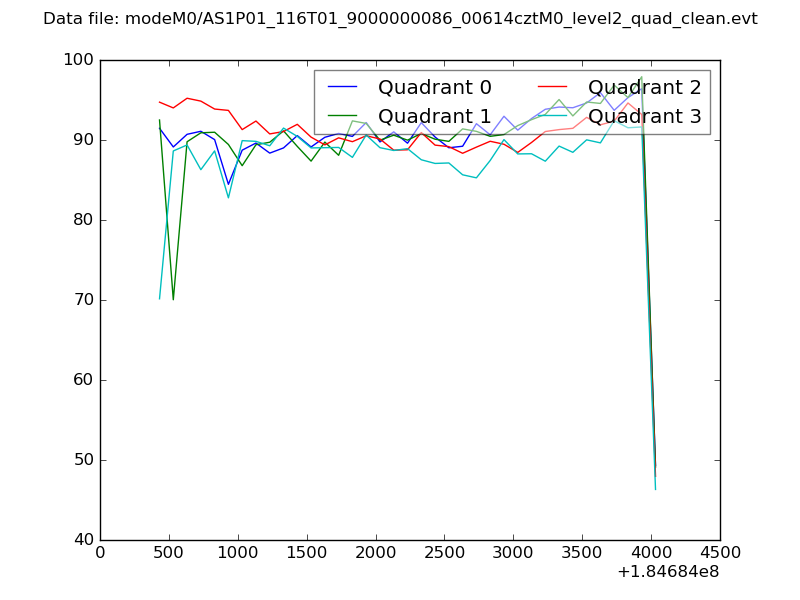 |
|
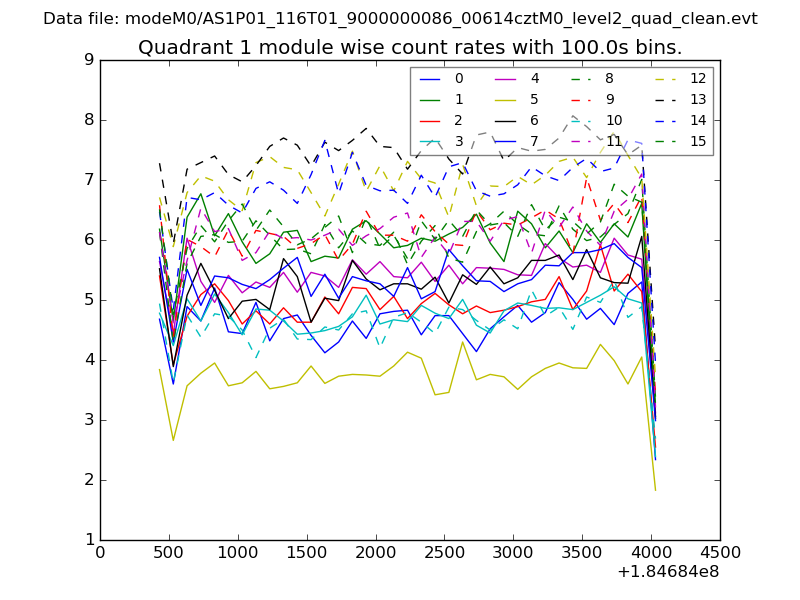
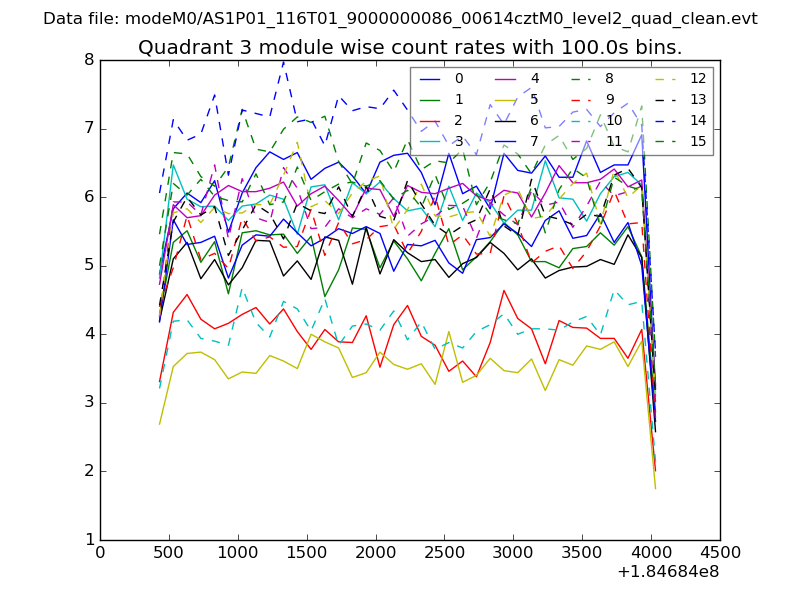
| Module-wise count rates for Quadrant A Data is divided into 100 sec bins |
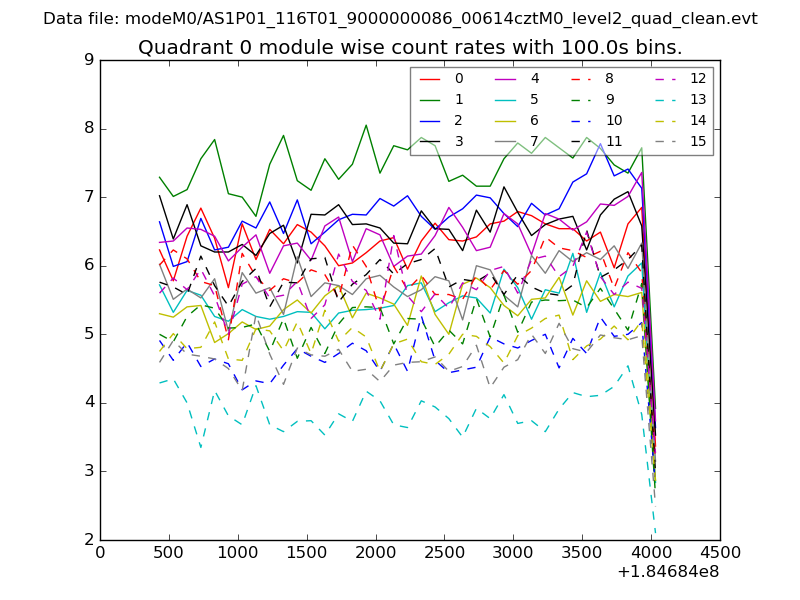 |
 |
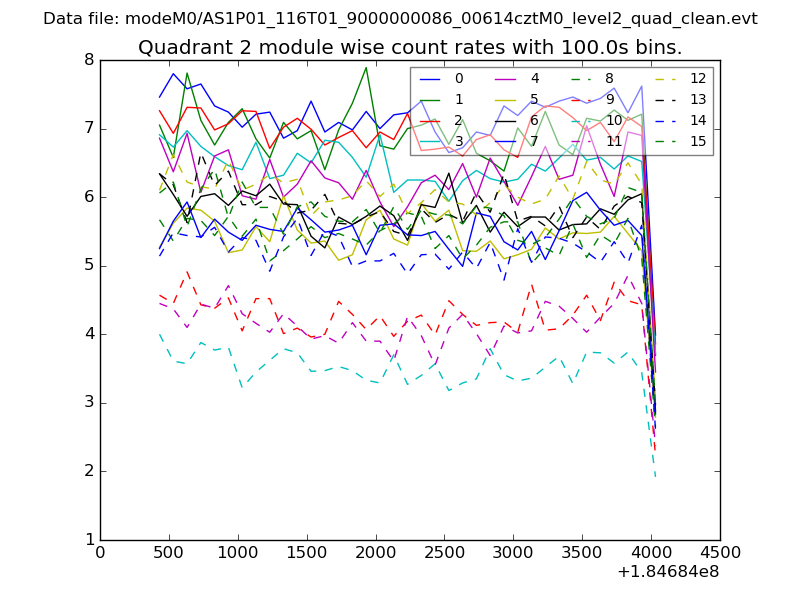
| Module-wise count rates for Quadrant B Data is divided into 100 sec bins |
 |
 |
| Module-wise count rates for Quadrant C Data is divided into 100 sec bins |
 |
 |
| Module-wise count rates for Quadrant D Data is divided into 100 sec bins |
 |
 |
| Parameter | Plot |
|---|---|
| CZT HV Monitor | 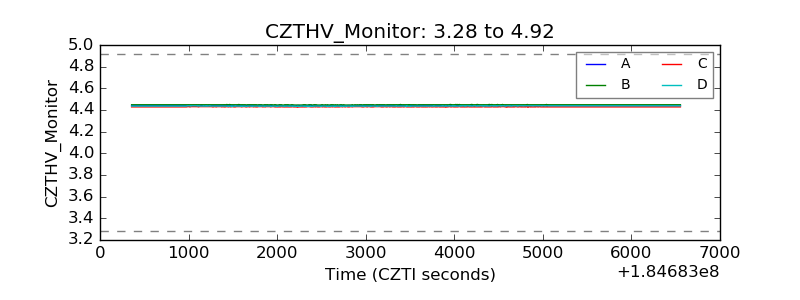 |
| D_VDD |  |
| Temperature 1 | 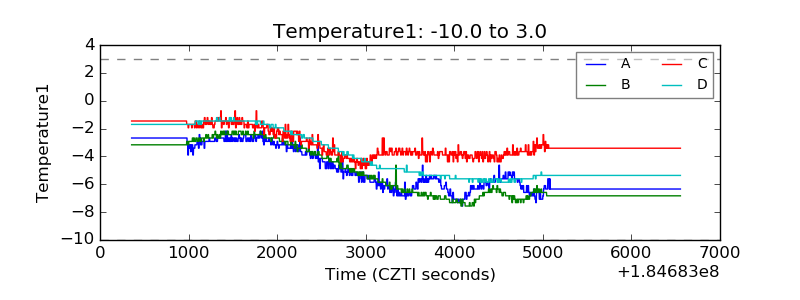 |
| Veto HV Monitor | 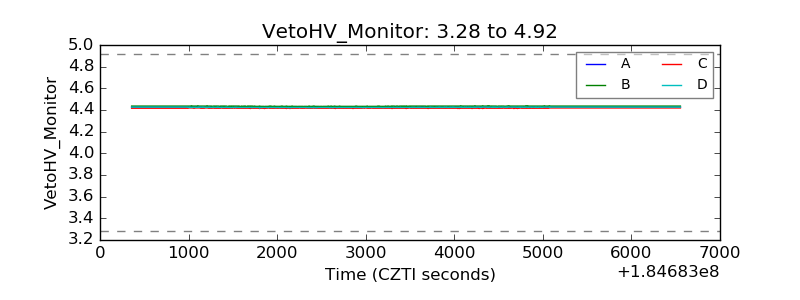 |
| Veto LLD | 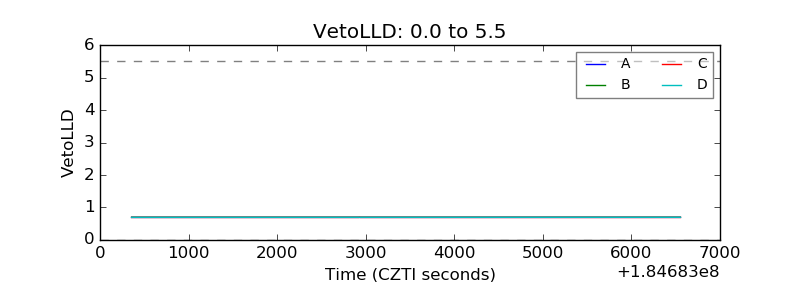 |
| Alpha Counter | 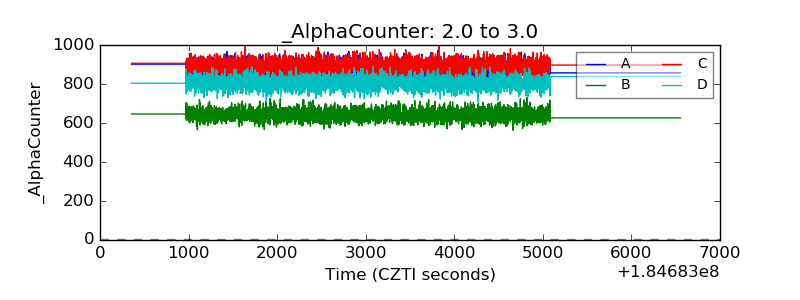 |
| _CPM_Rate | 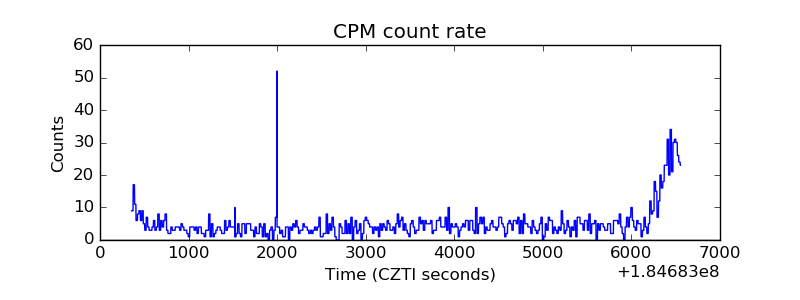 |
| CZT Counter | 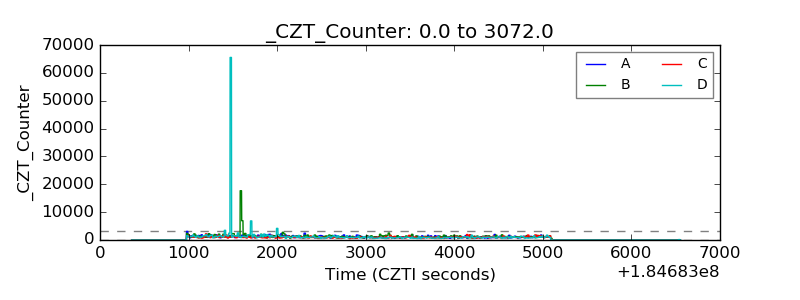 |
| +2.5 Volts monitor |  |
| +5 Volts monitor |  |
| _ROLL_ROT | 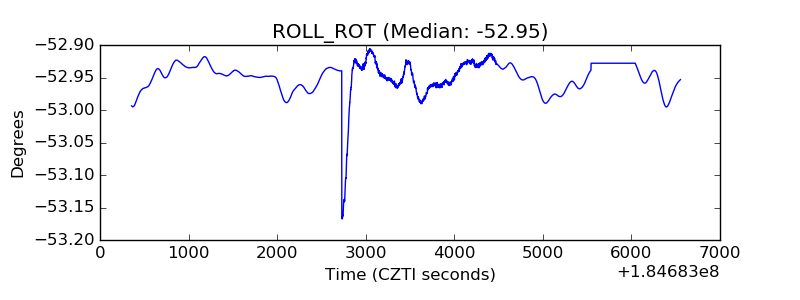 |
| _Roll_DEC | 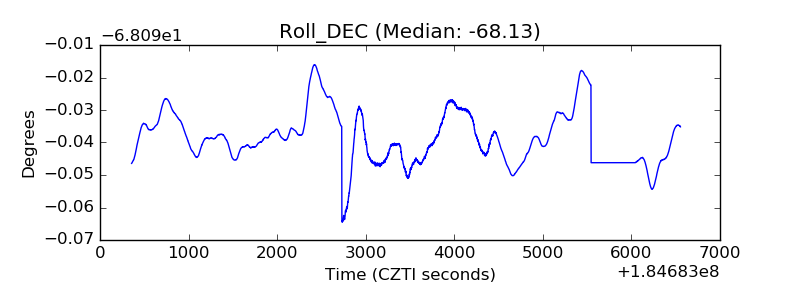 |
| _Roll_RA | 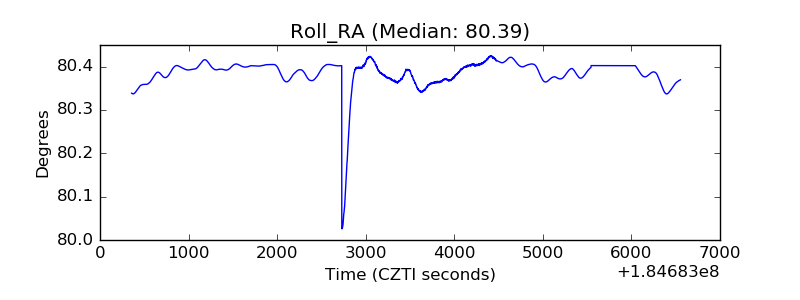 |
| Veto Counter | 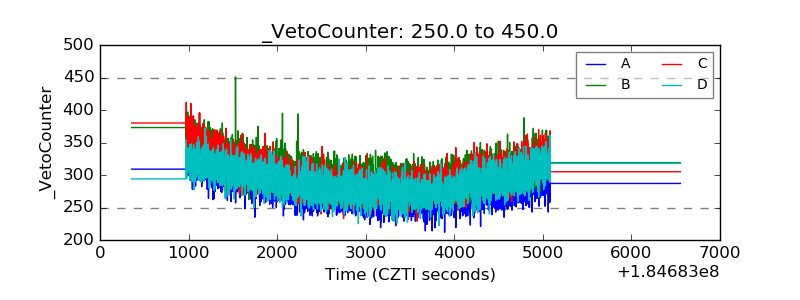 |