| Param | Original file | Final file |
|---|---|---|
| Filename | modeM0/AS1P01_116T01_9000000086_00615cztM0_level2.evt | modeM0/AS1P01_116T01_9000000086_00615cztM0_level2_quad_clean.evt |
| Size (bytes) | 849,191,040 | 73,756,800 |
| Size | 809.9 MB | 70.3 MB |
| Events in quadrant A | 7,411,019 | 457,416 |
| Events in quadrant B | 6,438,336 | 476,313 |
| Events in quadrant C | 5,445,616 | 474,934 |
| Events in quadrant D | 6,077,970 | 461,004 |
| Mode M0 | |||
|---|---|---|---|
| Quadrant | BADHDUFLAG | Total packets | Discarded packets |
| A | 0 | 25732 | 3 |
| B | 0 | 22798 | 2 |
| C | 0 | 19877 | 2 |
| D | 0 | 21768 | 2 |
| Mode M9 | |||
|---|---|---|---|
| Quadrant | BADHDUFLAG | Total packets | Discarded packets |
| A | 0 | 33 | 0 |
| B | 0 | 33 | 0 |
| C | 0 | 33 | 0 |
| D | 0 | 34 | 0 |
| Mode SS | |||
|---|---|---|---|
| Quadrant | BADHDUFLAG | Total packets | Discarded packets |
| A | 0 | 106 | 0 |
| B | 0 | 106 | 0 |
| C | 0 | 106 | 0 |
| D | 0 | 106 | 0 |
| Quadrant | Total seconds | Saturated seconds | Saturation percentage |
|---|---|---|---|
| A | 5189 | 363 | 6.995568% |
| B | 5189 | 17 | 0.327616% |
| C | 5189 | 2 | 0.038543% |
| D | 5189 | 75 | 1.445365% |
Noise dominated data is calculated using 1-second bins in cleaned event files. If a bin has >2000 counts, and if more than 50% of those come from <1% of pixels, then it is considered to be noise-dominated and hence unusable.
| Quadrant | # 1 sec bins | Bins with >0 counts | Bins with >2000 counts | High rate bins dominated by noise | Noise dominated (total time) | Noise dominated (detector-on time) | Marked lightcurve |
|---|---|---|---|---|---|---|---|
| A | 7344 | 5190 | 722 | 722 | 9.83% | 13.91% | 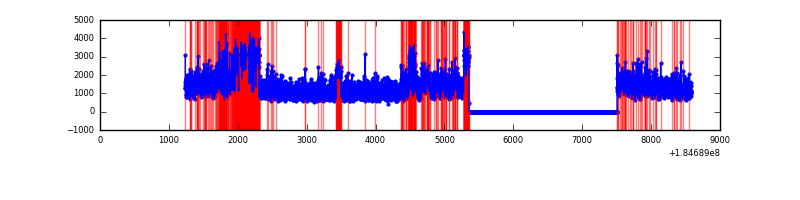 |
| B | 7344 | 5190 | 196 | 196 | 2.67% | 3.78% | 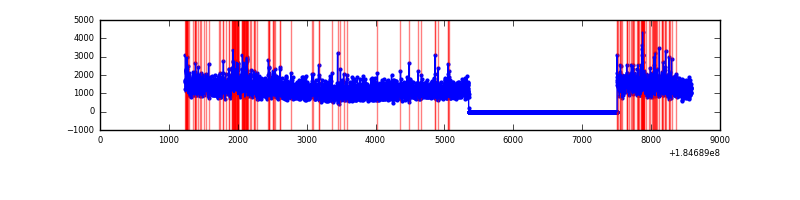 |
| C | 7344 | 5190 | 32 | 32 | 0.44% | 0.62% |  |
| D | 7344 | 5190 | 228 | 228 | 3.10% | 4.39% | 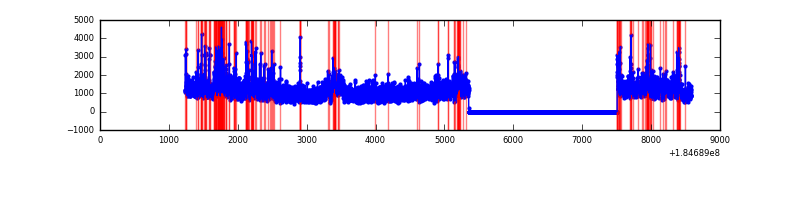 |
Top three noisy pixels from each quadrant. If the there are fewer than three noisy pixels in the level2.evt file, extra rows are filled as -1
| Pixel properties | Quadrant properties | ||||||
|---|---|---|---|---|---|---|---|
| Quadrant | DetID | PixID | Counts | Sigma | Mean | Median | Sigma |
| A | 0 | 69 | 979192 | 2899.09 | 1508 | 1495 | 337.2 |
| A | 15 | 171 | 467942 | 1383.12 | 1508 | 1495 | 337.2 |
| A | 13 | 160 | 66997 | 194.23 | 1508 | 1495 | 337.2 |
| B | 0 | 220 | 141001 | 378.99 | 1548 | 1559 | 367.9 |
| B | 5 | 2 | 131654 | 353.58 | 1548 | 1559 | 367.9 |
| B | 7 | 221 | 101879 | 272.66 | 1548 | 1559 | 367.9 |
| C | 15 | 241 | 35581 | 88.86 | 1372 | 1418 | 384.5 |
| C | 5 | 249 | 8359 | 18.05 | 1372 | 1418 | 384.5 |
| C | 1 | 1 | 6070 | 12.1 | 1372 | 1418 | 384.5 |
| D | 13 | 221 | 397351 | 951.49 | 1311 | 1361 | 416.2 |
| D | 1 | 4 | 121368 | 288.35 | 1311 | 1361 | 416.2 |
| D | 7 | 143 | 115423 | 274.07 | 1311 | 1361 | 416.2 |
Histogram calculated using DETX and DETY for each event in the final _common_clean file
| Quadrant A |  |
 |
Quadrant B |
|---|---|---|---|
| Quadrant D |  |
 |
Quadrant C |
| Plot type | Count rate plots | Images |
|---|---|---|
| Comparison with Poisson distribution Blue bars denote a histogram of data divided into 1 sec bins. Red curve is a Poisson curve with rate = median count rate of data. |
 |
 |
| Quadrant-wise count rates Data is divided into 100 sec bins |
 |
|
| Module-wise count rates for Quadrant A Data is divided into 100 sec bins |
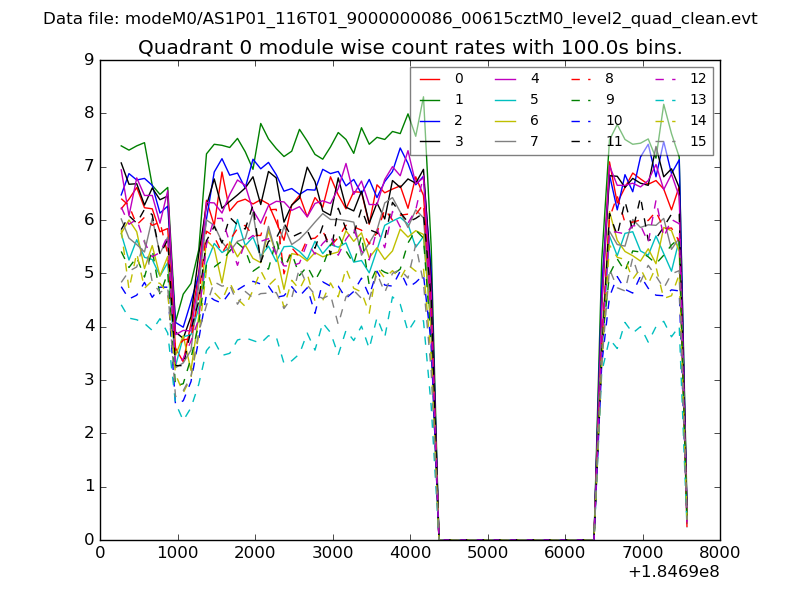 |
 |
| Module-wise count rates for Quadrant B Data is divided into 100 sec bins |
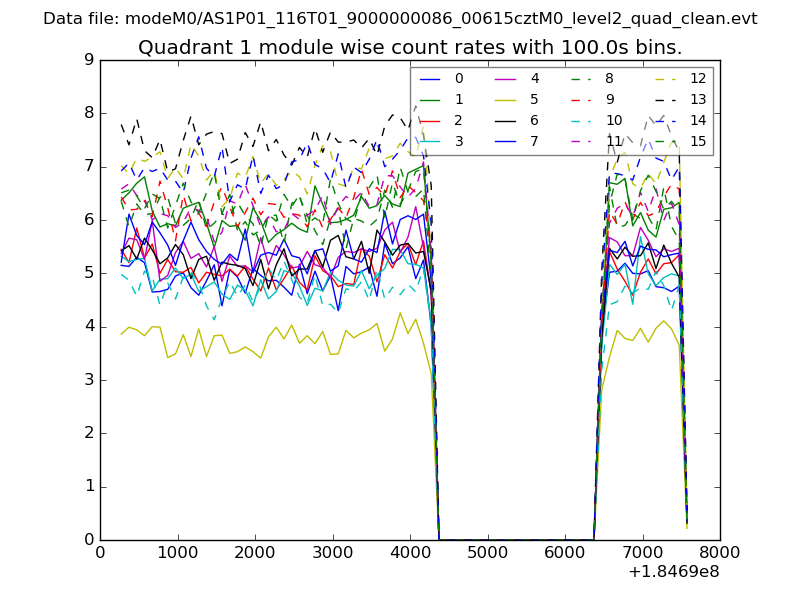 |
 |
| Module-wise count rates for Quadrant C Data is divided into 100 sec bins |
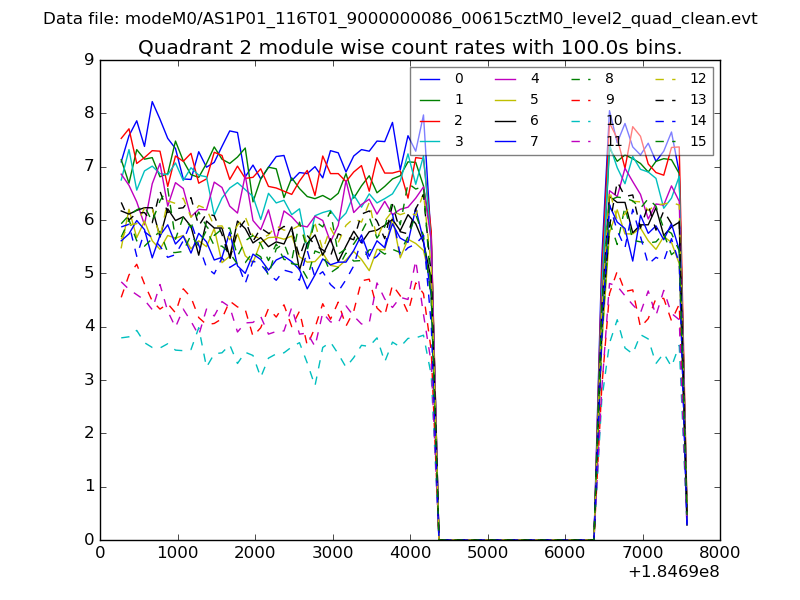 |
 |
| Module-wise count rates for Quadrant D Data is divided into 100 sec bins |
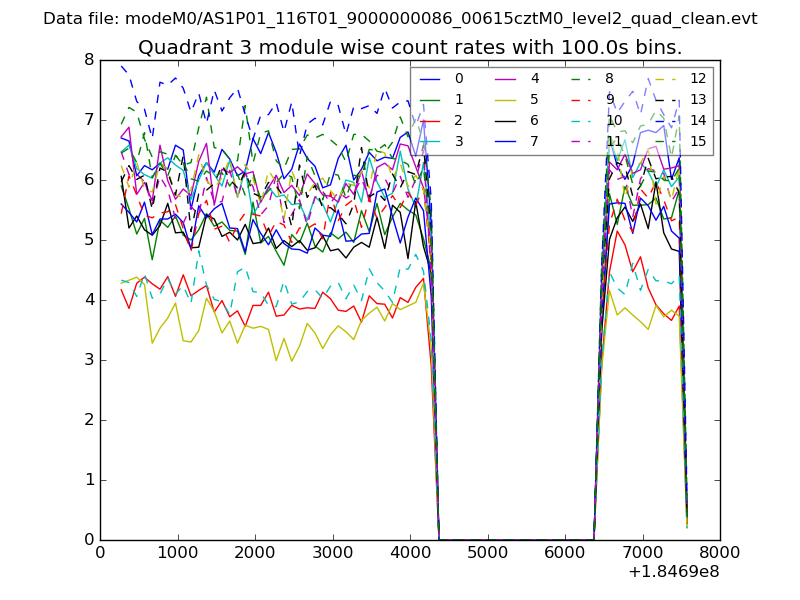 |
 |
| Parameter | Plot |
|---|---|
| CZT HV Monitor | 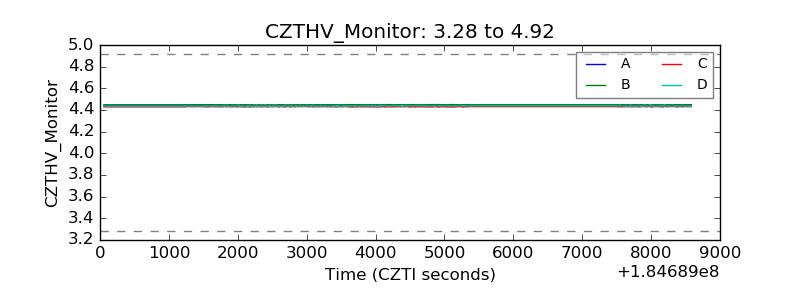 |
| D_VDD |  |
| Temperature 1 |  |
| Veto HV Monitor |  |
| Veto LLD |  |
| Alpha Counter | 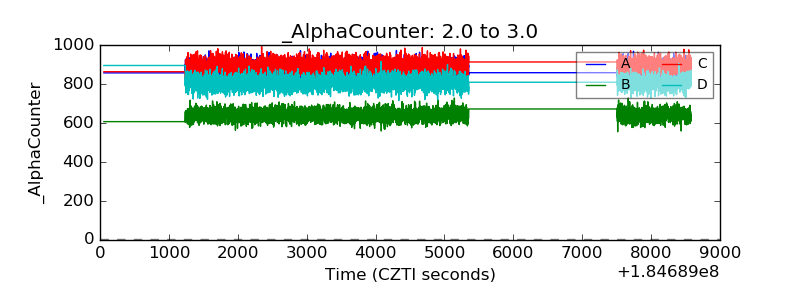 |
| _CPM_Rate | 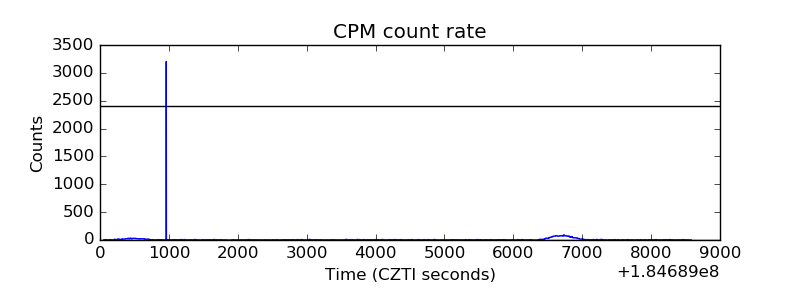 |
| CZT Counter |  |
| +2.5 Volts monitor |  |
| +5 Volts monitor |  |
| _ROLL_ROT |  |
| _Roll_DEC |  |
| _Roll_RA |  |
| Veto Counter | 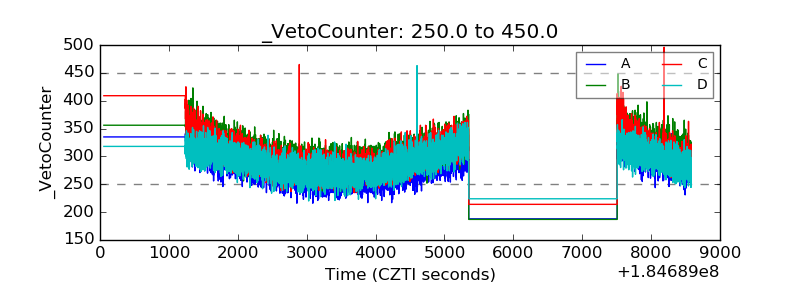 |