| Param | Original file | Final file |
|---|---|---|
| Filename | modeM0/AS1P01_116T01_9000000086_00616cztM0_level2.evt | modeM0/AS1P01_116T01_9000000086_00616cztM0_level2_quad_clean.evt |
| Size (bytes) | 788,777,280 | 73,416,960 |
| Size | 752.2 MB | 70.0 MB |
| Events in quadrant A | 5,967,601 | 473,883 |
| Events in quadrant B | 6,723,091 | 462,420 |
| Events in quadrant C | 5,380,309 | 469,553 |
| Events in quadrant D | 5,476,094 | 458,272 |
| Mode M0 | |||
|---|---|---|---|
| Quadrant | BADHDUFLAG | Total packets | Discarded packets |
| A | 0 | 21379 | 3 |
| B | 0 | 23607 | 2 |
| C | 0 | 19649 | 2 |
| D | 0 | 19948 | 2 |
| Mode M9 | |||
|---|---|---|---|
| Quadrant | BADHDUFLAG | Total packets | Discarded packets |
| A | 0 | 22 | 0 |
| B | 0 | 22 | 0 |
| C | 0 | 22 | 0 |
| D | 0 | 22 | 0 |
| Mode SS | |||
|---|---|---|---|
| Quadrant | BADHDUFLAG | Total packets | Discarded packets |
| A | 0 | 104 | 0 |
| B | 0 | 104 | 0 |
| C | 0 | 104 | 0 |
| D | 0 | 104 | 0 |
| Quadrant | Total seconds | Saturated seconds | Saturation percentage |
|---|---|---|---|
| A | 5123 | 4 | 0.078079% |
| B | 5123 | 231 | 4.509077% |
| C | 5123 | 1 | 0.019520% |
| D | 5123 | 30 | 0.585594% |
Noise dominated data is calculated using 1-second bins in cleaned event files. If a bin has >2000 counts, and if more than 50% of those come from <1% of pixels, then it is considered to be noise-dominated and hence unusable.
| Quadrant | # 1 sec bins | Bins with >0 counts | Bins with >2000 counts | High rate bins dominated by noise | Noise dominated (total time) | Noise dominated (detector-on time) | Marked lightcurve |
|---|---|---|---|---|---|---|---|
| A | 7278 | 5124 | 112 | 112 | 1.54% | 2.19% | 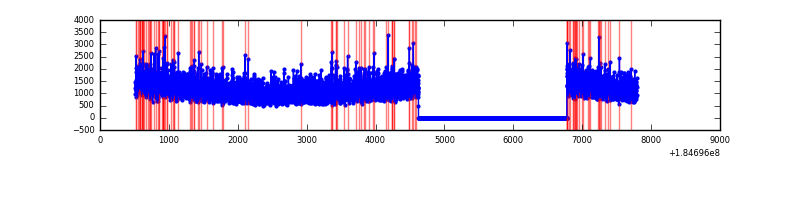 |
| B | 7278 | 5123 | 379 | 379 | 5.21% | 7.40% | 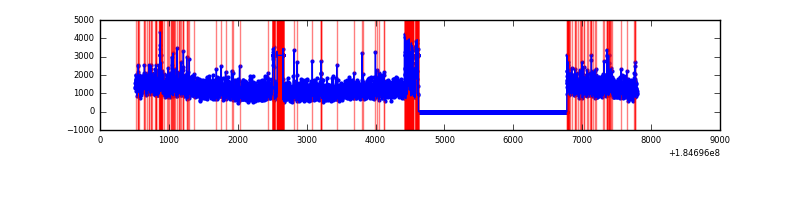 |
| C | 7278 | 5124 | 32 | 32 | 0.44% | 0.62% | 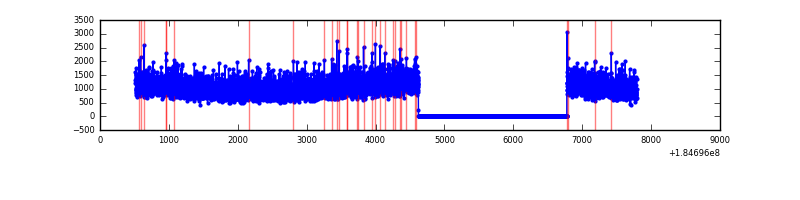 |
| D | 7278 | 5124 | 108 | 108 | 1.48% | 2.11% | 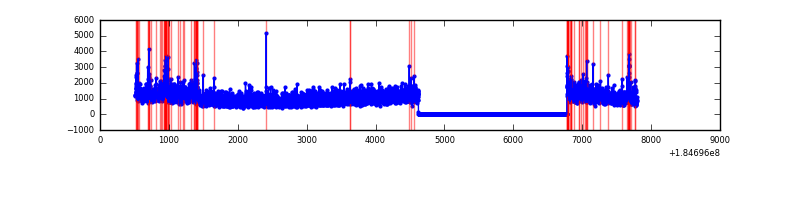 |
Top three noisy pixels from each quadrant. If the there are fewer than three noisy pixels in the level2.evt file, extra rows are filled as -1
| Pixel properties | Quadrant properties | ||||||
|---|---|---|---|---|---|---|---|
| Quadrant | DetID | PixID | Counts | Sigma | Mean | Median | Sigma |
| A | 0 | 238 | 53031 | 151.76 | 1502 | 1487 | 339.6 |
| A | 0 | 69 | 51807 | 148.16 | 1502 | 1487 | 339.6 |
| A | 13 | 160 | 16751 | 44.94 | 1502 | 1487 | 339.6 |
| B | 5 | 191 | 658434 | 1858.49 | 1489 | 1501 | 353.5 |
| B | 0 | 220 | 174054 | 488.16 | 1489 | 1501 | 353.5 |
| B | 7 | 221 | 65480 | 181.0 | 1489 | 1501 | 353.5 |
| C | 15 | 241 | 43612 | 110.93 | 1356 | 1406 | 380.5 |
| C | 5 | 249 | 5413 | 10.53 | 1356 | 1406 | 380.5 |
| C | 9 | 206 | 5215 | 10.01 | 1356 | 1406 | 380.5 |
| D | 13 | 221 | 254742 | 625.19 | 1290 | 1339 | 405.3 |
| D | 13 | 252 | 46183 | 110.64 | 1290 | 1339 | 405.3 |
| D | 13 | 101 | 42520 | 101.6 | 1290 | 1339 | 405.3 |
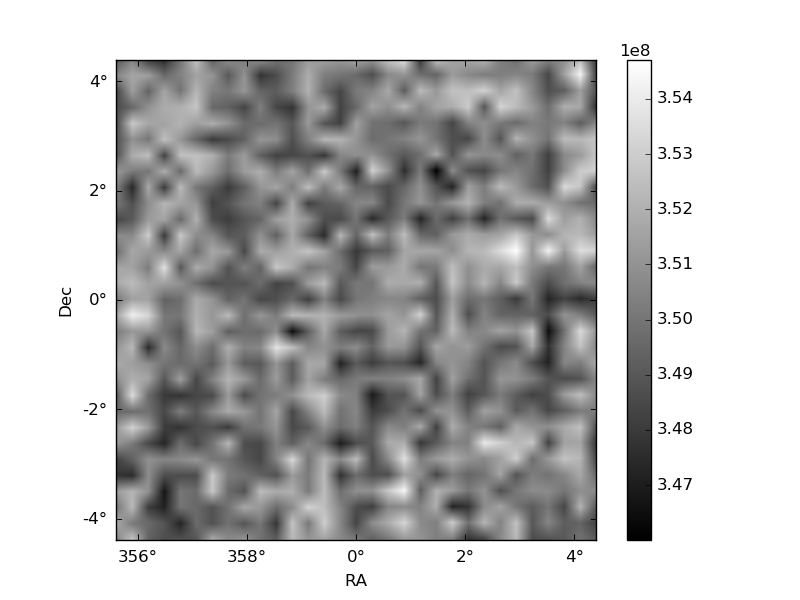
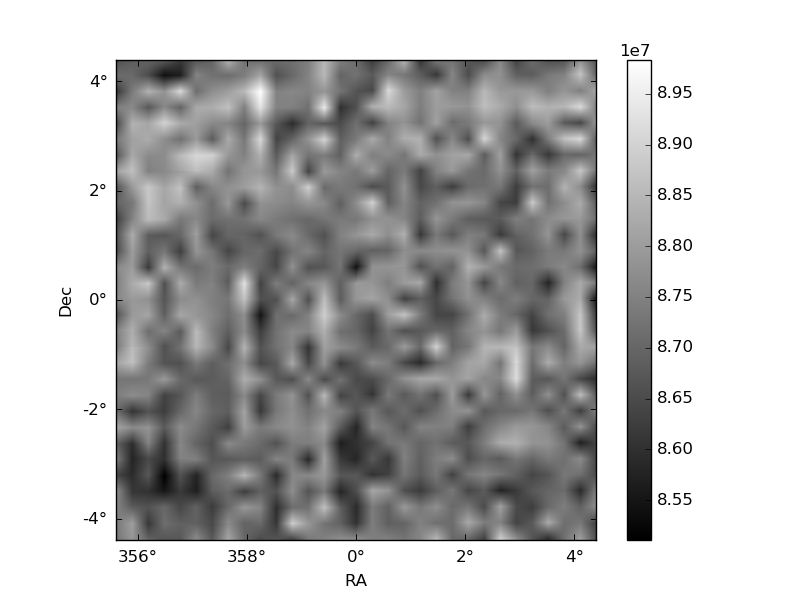
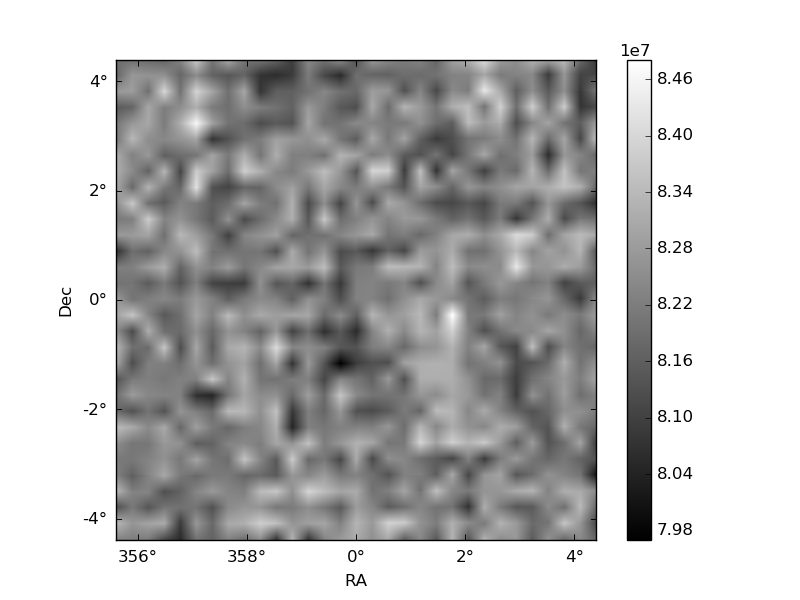
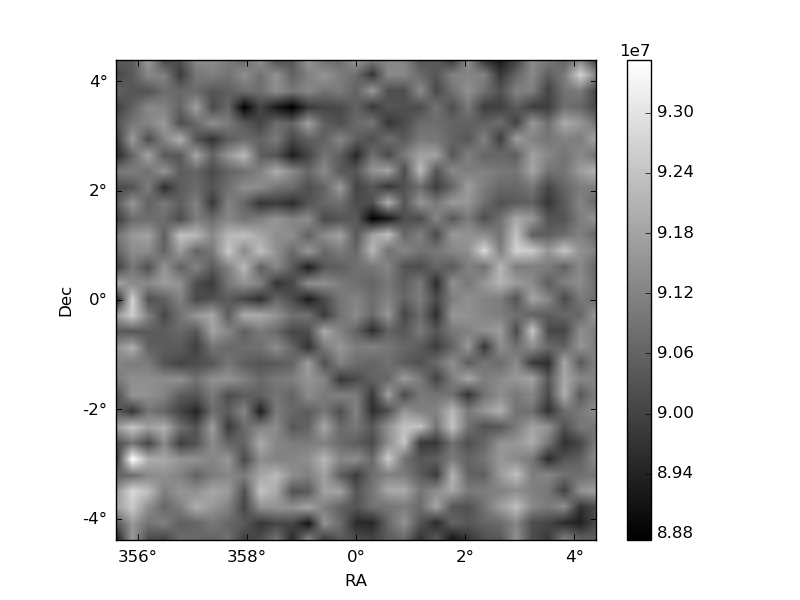
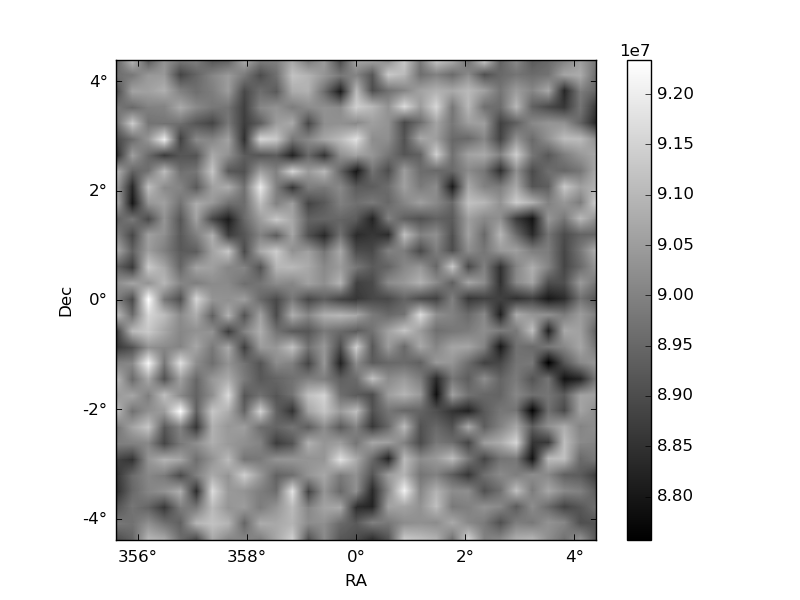
Histogram calculated using DETX and DETY for each event in the final _common_clean file
| Quadrant A | 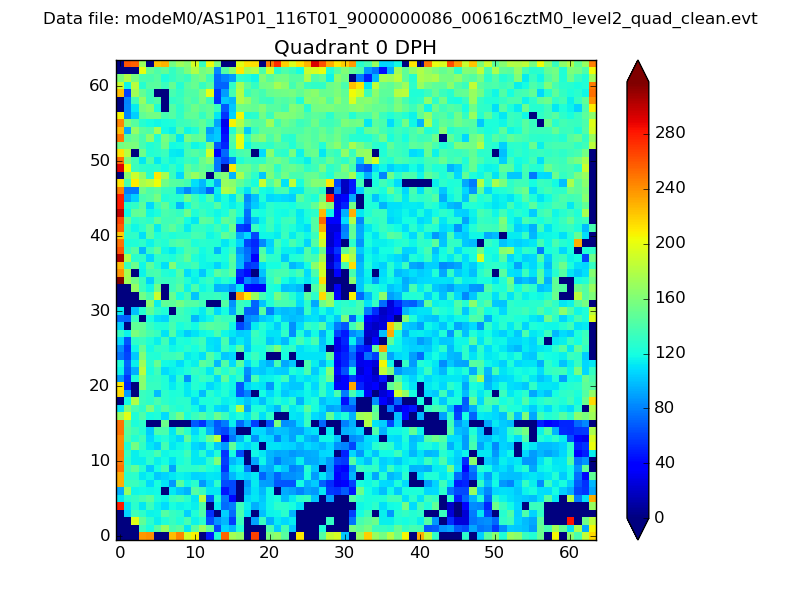 |
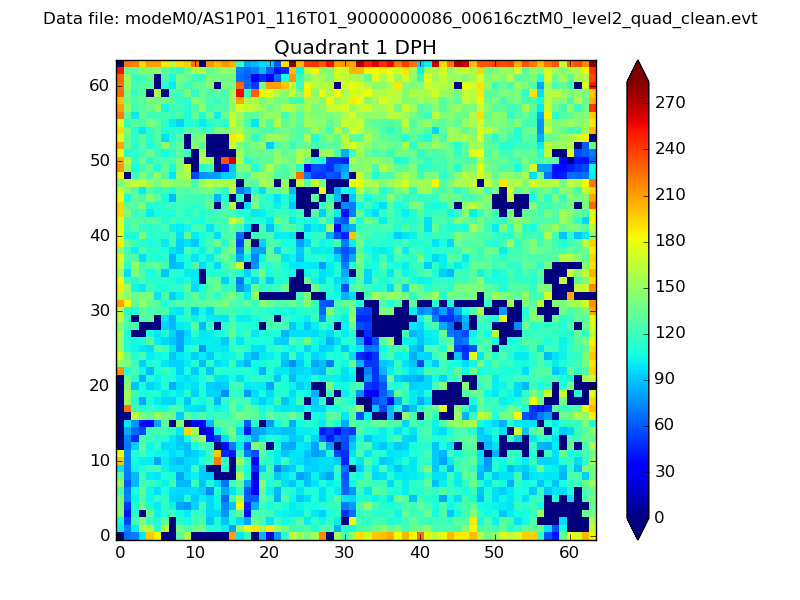 |
Quadrant B |
|---|---|---|---|
| Quadrant D | 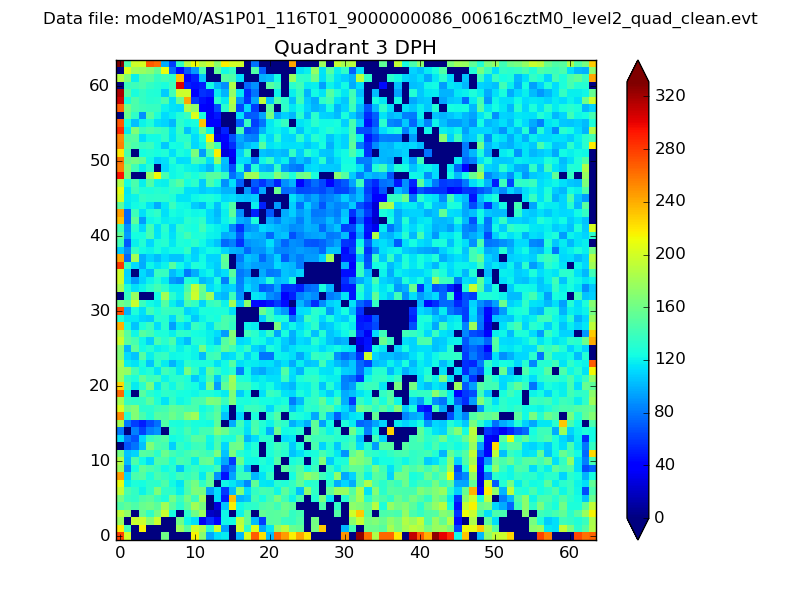 |
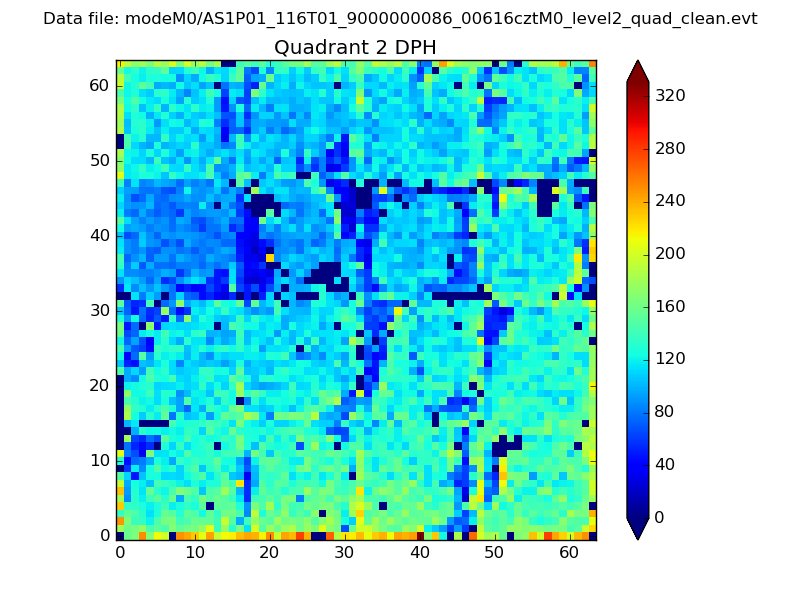 |
Quadrant C |
| Plot type | Count rate plots | Images |
|---|---|---|
| Comparison with Poisson distribution Blue bars denote a histogram of data divided into 1 sec bins. Red curve is a Poisson curve with rate = median count rate of data. |
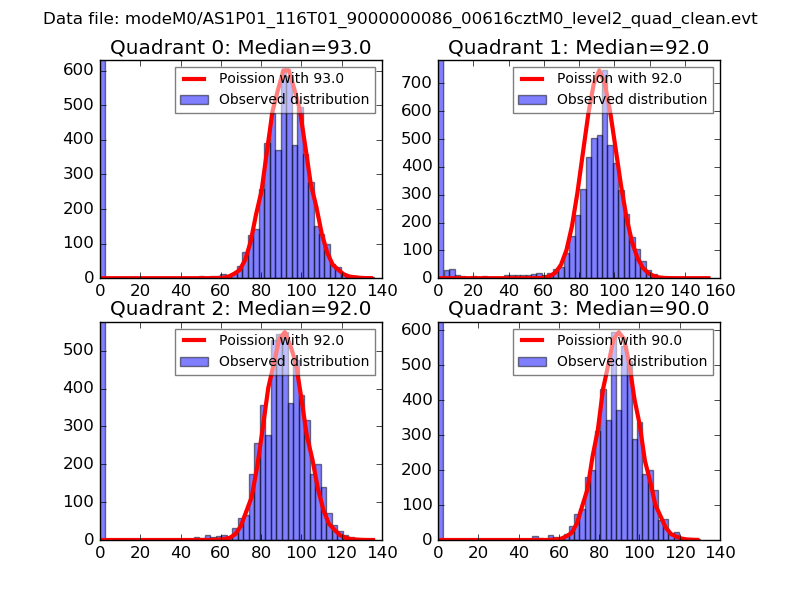 |
 |
| Quadrant-wise count rates Data is divided into 100 sec bins |
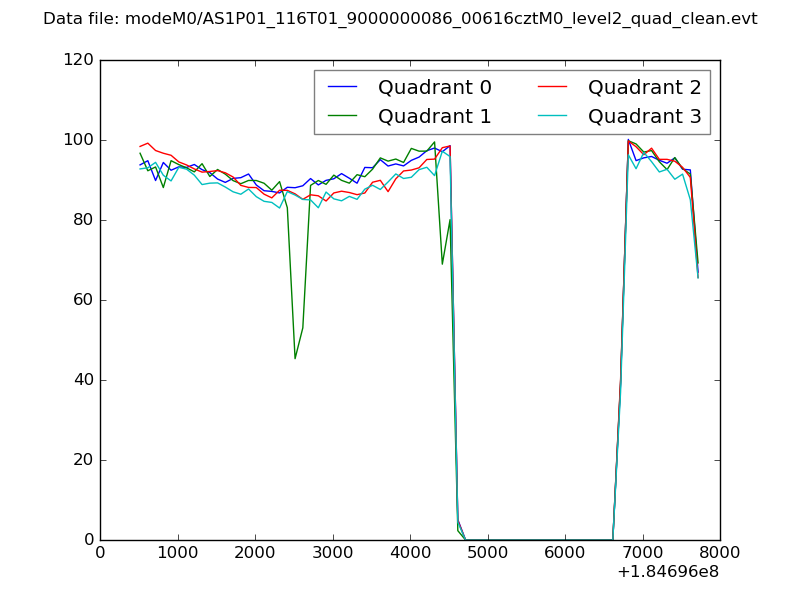 |
|
| Module-wise count rates for Quadrant A Data is divided into 100 sec bins |
 |
 |
| Module-wise count rates for Quadrant B Data is divided into 100 sec bins |
 |
 |
| Module-wise count rates for Quadrant C Data is divided into 100 sec bins |
 |
 |
| Module-wise count rates for Quadrant D Data is divided into 100 sec bins |
 |
 |
| Parameter | Plot |
|---|---|
| CZT HV Monitor |  |
| D_VDD | 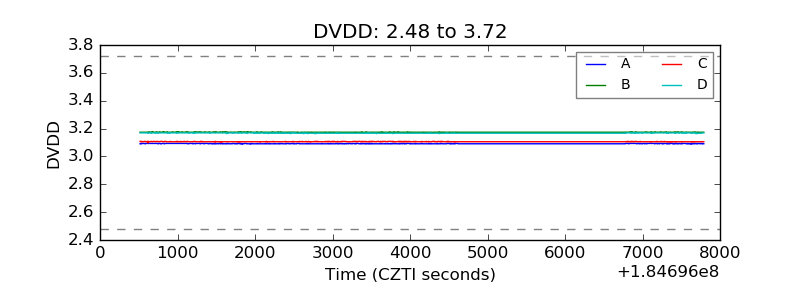 |
| Temperature 1 | 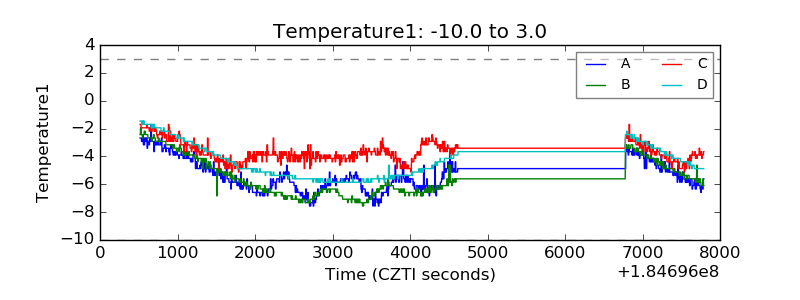 |
| Veto HV Monitor | 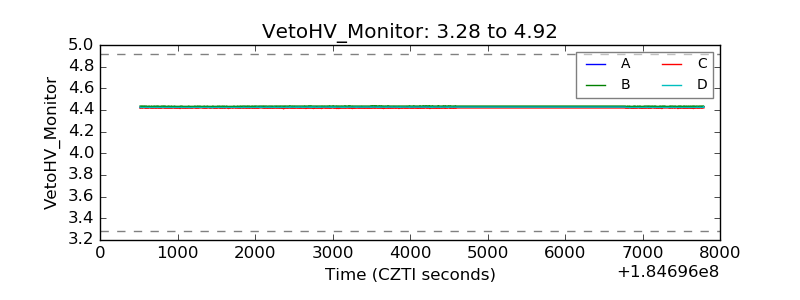 |
| Veto LLD | 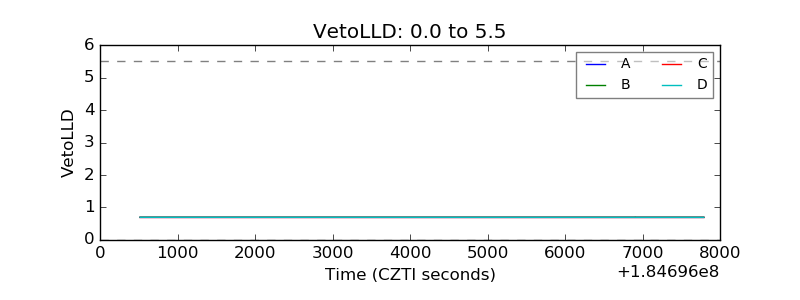 |
| Alpha Counter |  |
| _CPM_Rate | 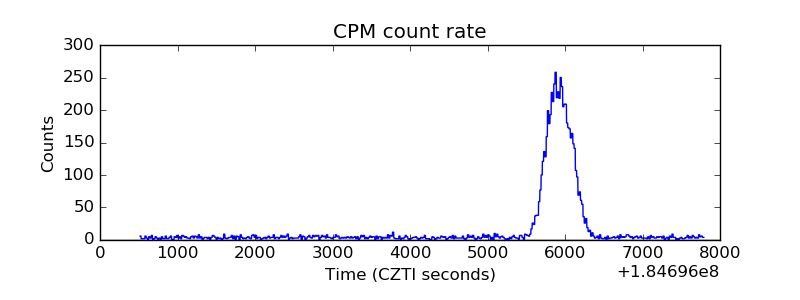 |
| CZT Counter | 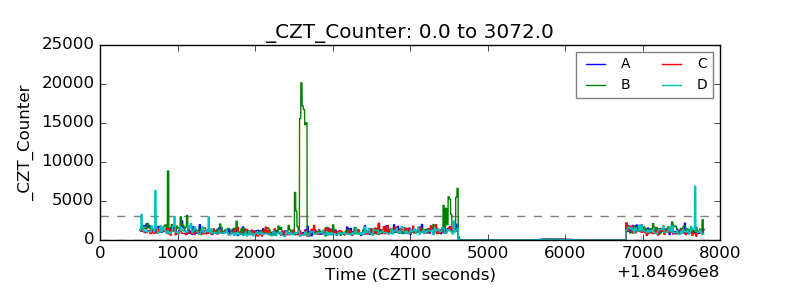 |
| +2.5 Volts monitor |  |
| +5 Volts monitor | 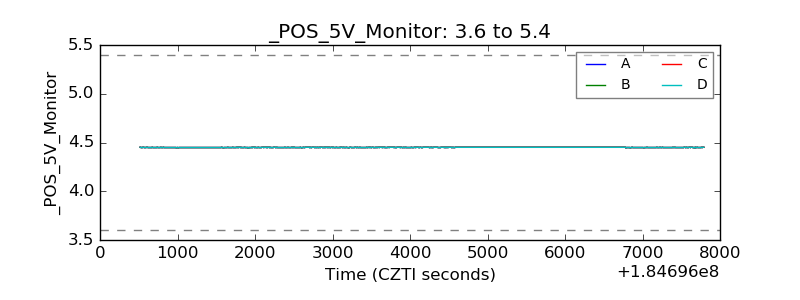 |
| _ROLL_ROT | 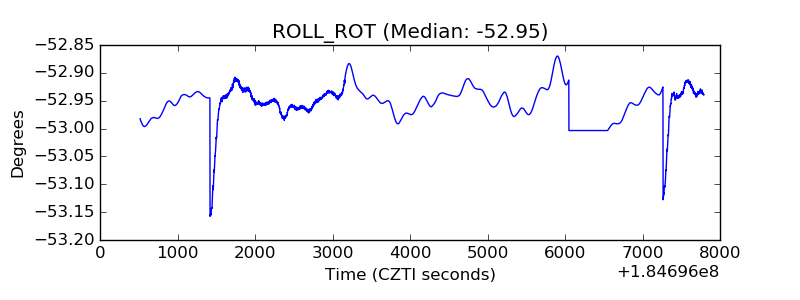 |
| _Roll_DEC | 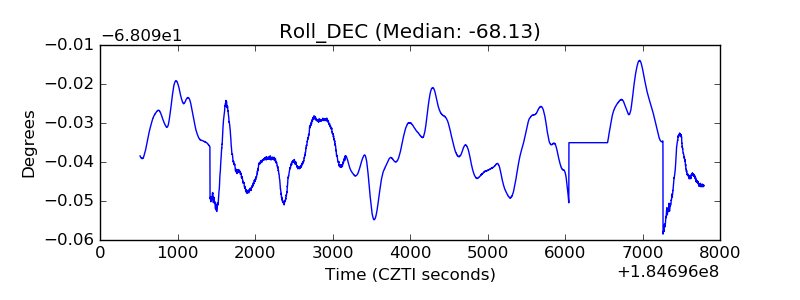 |
| _Roll_RA | 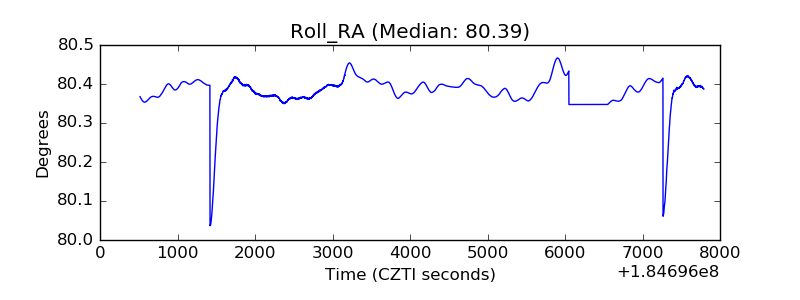 |
| Veto Counter |  |