| Param | Original file | Final file |
|---|---|---|
| Filename | modeM0/AS1P01_116T01_9000000086_00619cztM0_level2.evt | modeM0/AS1P01_116T01_9000000086_00619cztM0_level2_quad_clean.evt |
| Size (bytes) | 792,550,080 | 70,608,960 |
| Size | 755.8 MB | 67.3 MB |
| Events in quadrant A | 6,044,608 | 447,114 |
| Events in quadrant B | 6,243,585 | 452,844 |
| Events in quadrant C | 5,977,772 | 436,062 |
| Events in quadrant D | 5,379,833 | 427,544 |
| Mode M0 | |||
|---|---|---|---|
| Quadrant | BADHDUFLAG | Total packets | Discarded packets |
| A | 0 | 21763 | 3 |
| B | 0 | 22372 | 2 |
| C | 0 | 21631 | 2 |
| D | 0 | 19793 | 2 |
| Mode M9 | |||
|---|---|---|---|
| Quadrant | BADHDUFLAG | Total packets | Discarded packets |
| A | 0 | 24 | 0 |
| B | 0 | 24 | 0 |
| C | 0 | 24 | 0 |
| D | 0 | 25 | 0 |
| Mode SS | |||
|---|---|---|---|
| Quadrant | BADHDUFLAG | Total packets | Discarded packets |
| A | 0 | 110 | 0 |
| B | 0 | 110 | 0 |
| C | 0 | 110 | 0 |
| D | 0 | 110 | 0 |
| Quadrant | Total seconds | Saturated seconds | Saturation percentage |
|---|---|---|---|
| A | 5344 | 4 | 0.074850% |
| B | 5344 | 11 | 0.205838% |
| C | 5344 | 102 | 1.908683% |
| D | 5344 | 24 | 0.449102% |
Noise dominated data is calculated using 1-second bins in cleaned event files. If a bin has >2000 counts, and if more than 50% of those come from <1% of pixels, then it is considered to be noise-dominated and hence unusable.
| Quadrant | # 1 sec bins | Bins with >0 counts | Bins with >2000 counts | High rate bins dominated by noise | Noise dominated (total time) | Noise dominated (detector-on time) | Marked lightcurve |
|---|---|---|---|---|---|---|---|
| A | 7500 | 5345 | 79 | 79 | 1.05% | 1.48% | 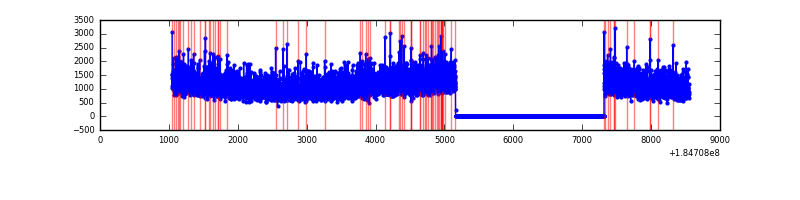 |
| B | 7500 | 5345 | 88 | 88 | 1.17% | 1.65% | 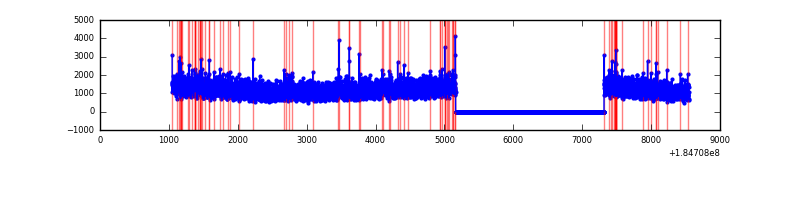 |
| C | 7500 | 5345 | 188 | 188 | 2.51% | 3.52% | 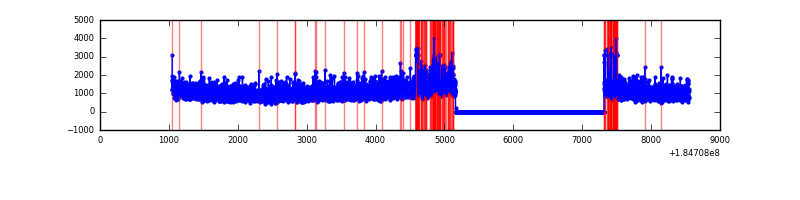 |
| D | 7500 | 5345 | 71 | 71 | 0.95% | 1.33% | 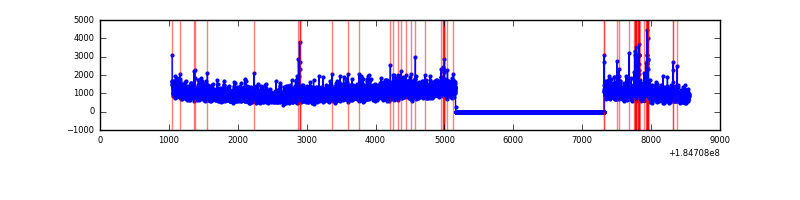 |
Top three noisy pixels from each quadrant. If the there are fewer than three noisy pixels in the level2.evt file, extra rows are filled as -1
| Pixel properties | Quadrant properties | ||||||
|---|---|---|---|---|---|---|---|
| Quadrant | DetID | PixID | Counts | Sigma | Mean | Median | Sigma |
| A | 13 | 160 | 67476 | 191.73 | 1533 | 1511 | 344.0 |
| A | 0 | 238 | 27963 | 76.88 | 1533 | 1511 | 344.0 |
| A | 0 | 69 | 6789 | 15.34 | 1533 | 1511 | 344.0 |
| B | 0 | 220 | 69223 | 182.96 | 1572 | 1580 | 369.7 |
| B | 7 | 221 | 67499 | 178.3 | 1572 | 1580 | 369.7 |
| B | 5 | 191 | 39131 | 101.57 | 1572 | 1580 | 369.7 |
| C | 9 | 83 | 388053 | 981.11 | 1416 | 1473 | 394.0 |
| C | 15 | 241 | 16999 | 39.4 | 1416 | 1473 | 394.0 |
| C | 7 | 159 | 11963 | 26.62 | 1416 | 1473 | 394.0 |
| D | 1 | 4 | 119516 | 282.22 | 1333 | 1388 | 418.6 |
| D | 13 | 221 | 42751 | 98.82 | 1333 | 1388 | 418.6 |
| D | 13 | 252 | 33706 | 77.21 | 1333 | 1388 | 418.6 |
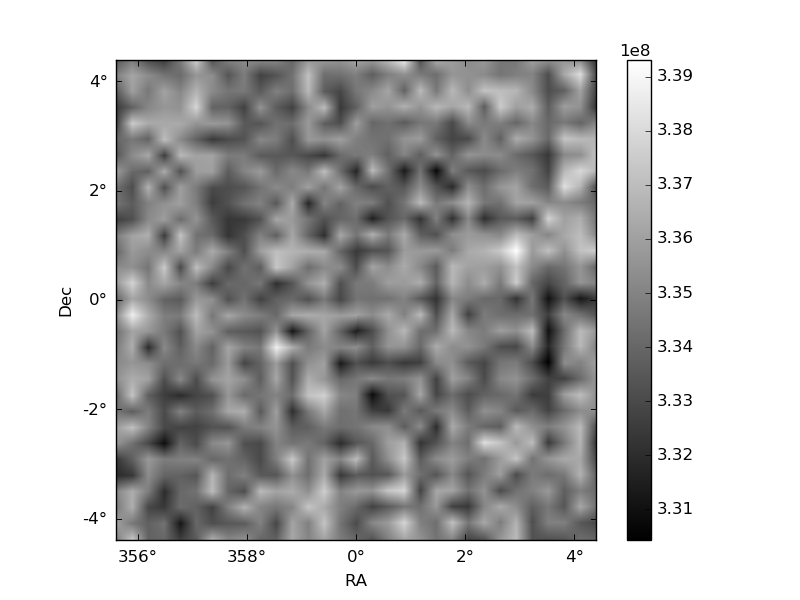
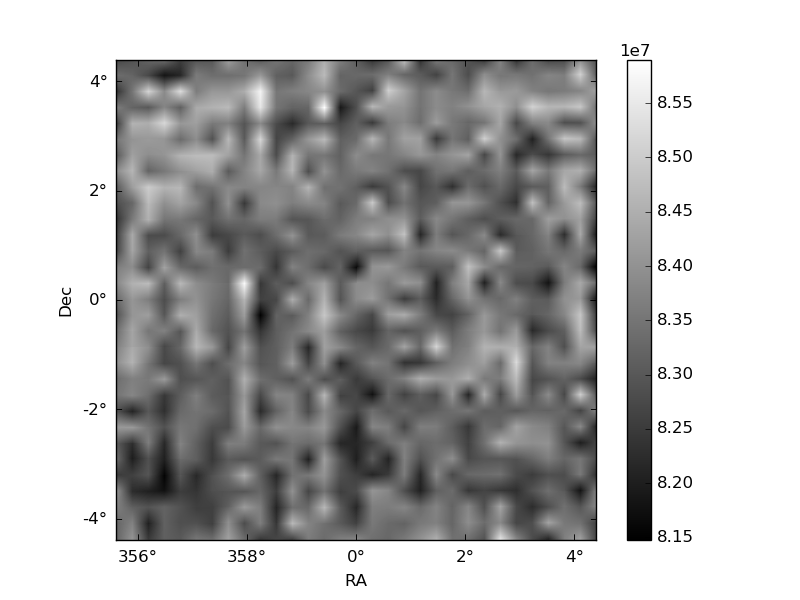
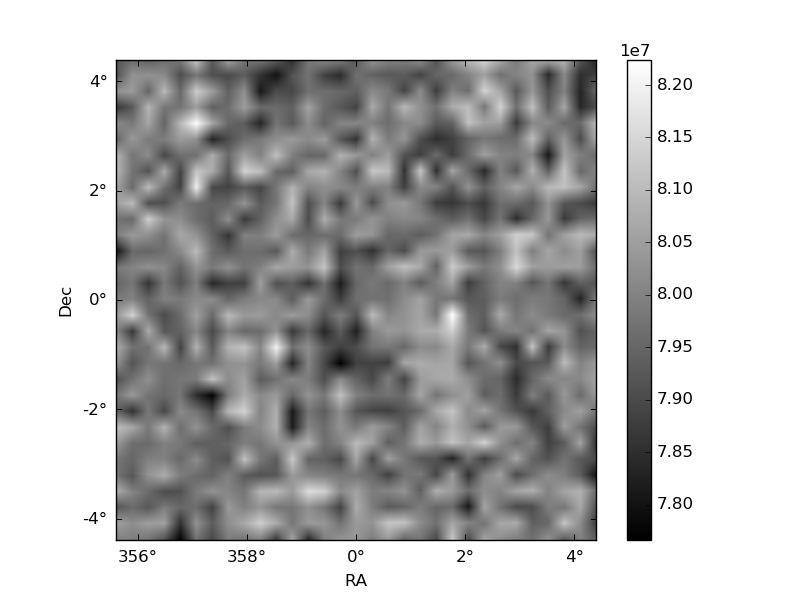
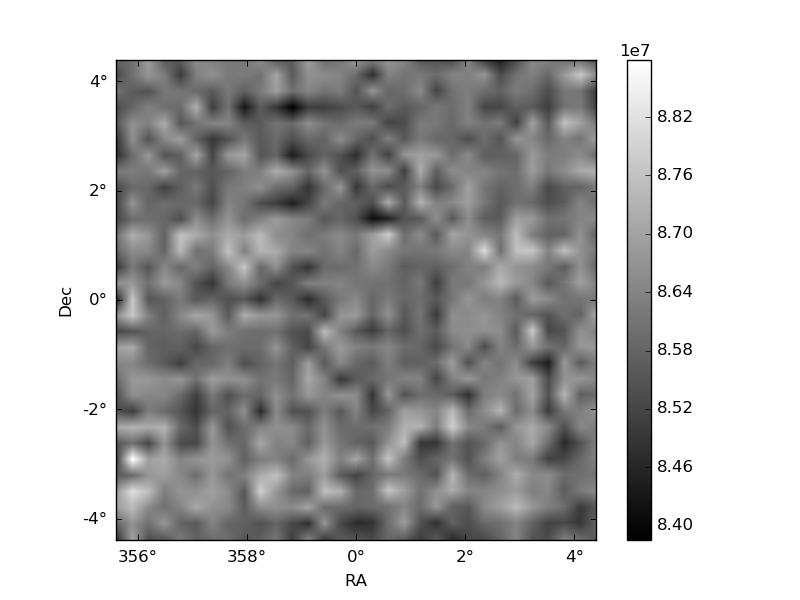
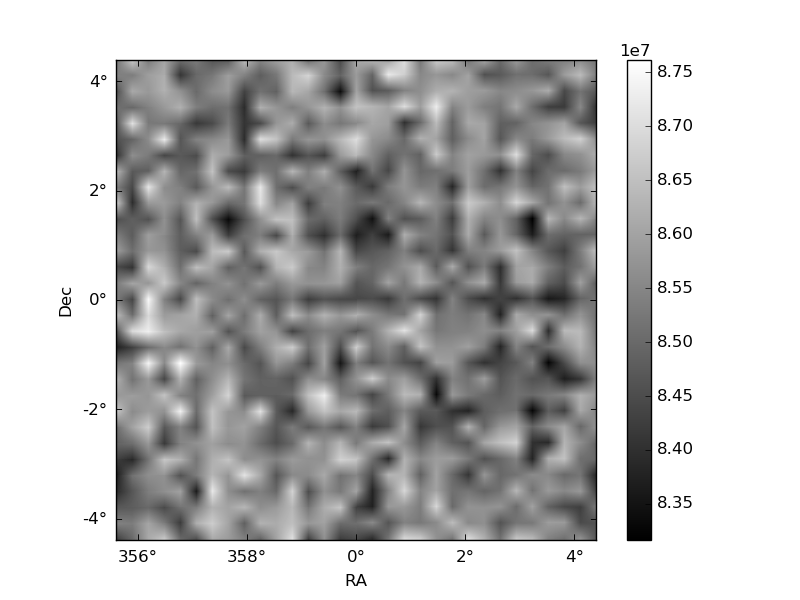
Histogram calculated using DETX and DETY for each event in the final _common_clean file
| Quadrant A | 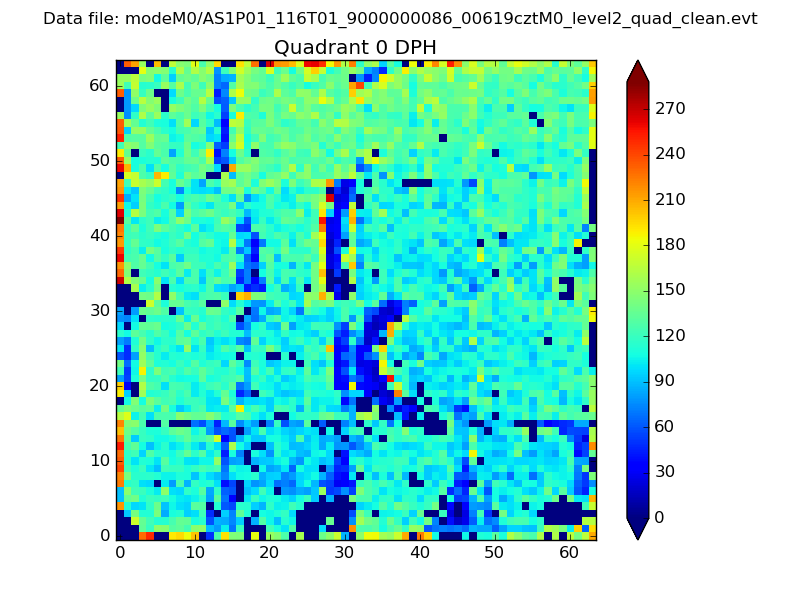 |
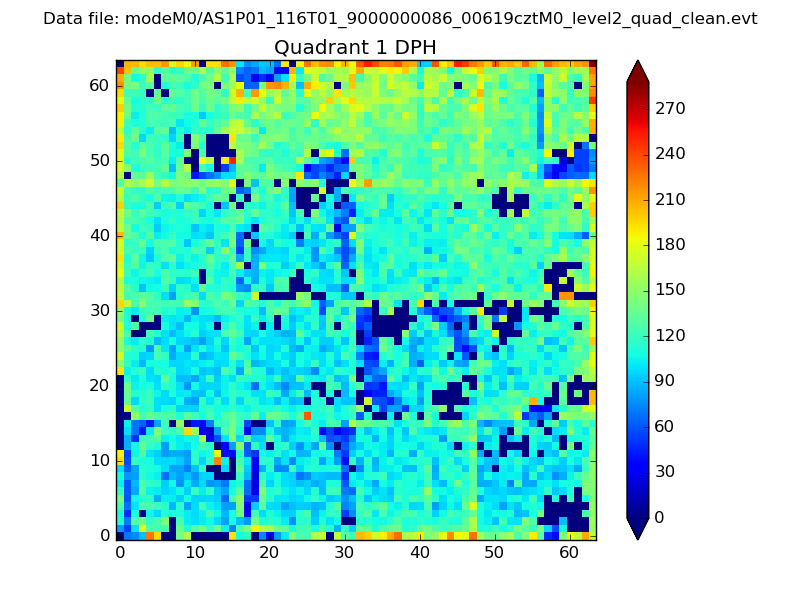 |
Quadrant B |
|---|---|---|---|
| Quadrant D |  |
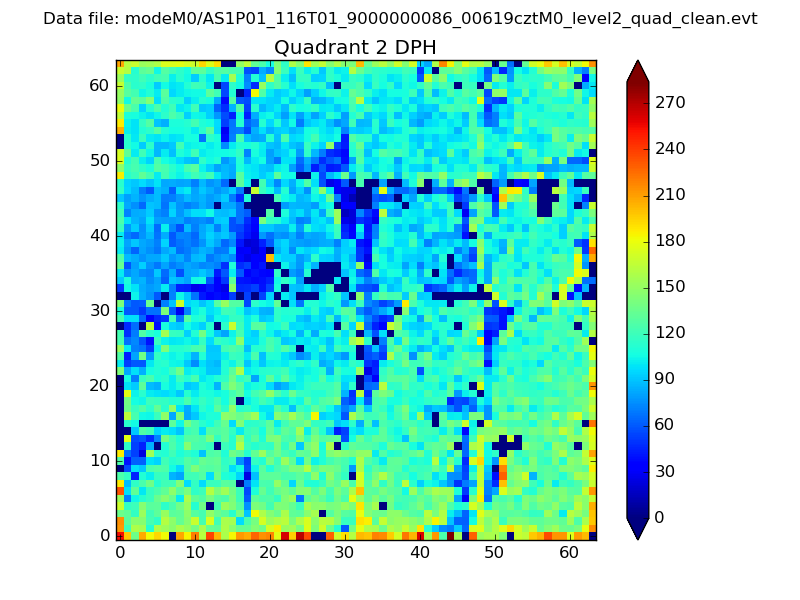 |
Quadrant C |
| Plot type | Count rate plots | Images |
|---|---|---|
| Comparison with Poisson distribution Blue bars denote a histogram of data divided into 1 sec bins. Red curve is a Poisson curve with rate = median count rate of data. |
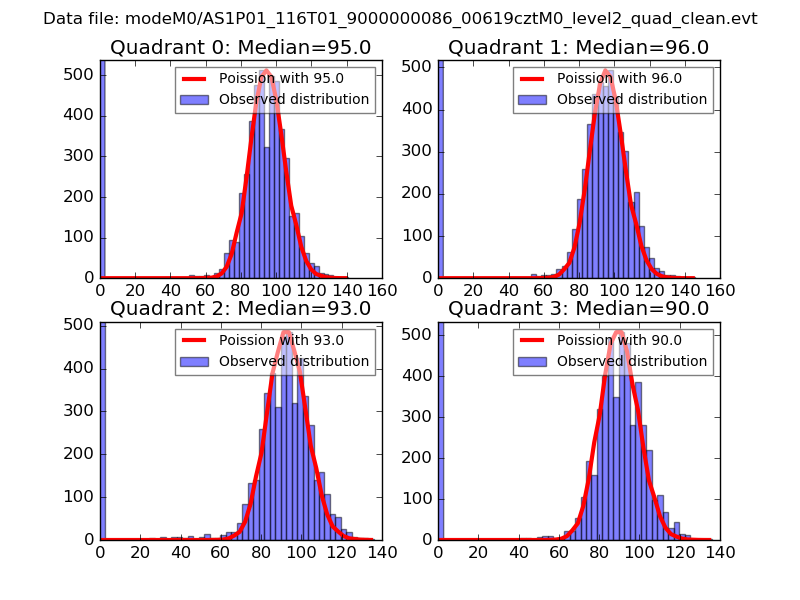 |
 |
| Quadrant-wise count rates Data is divided into 100 sec bins |
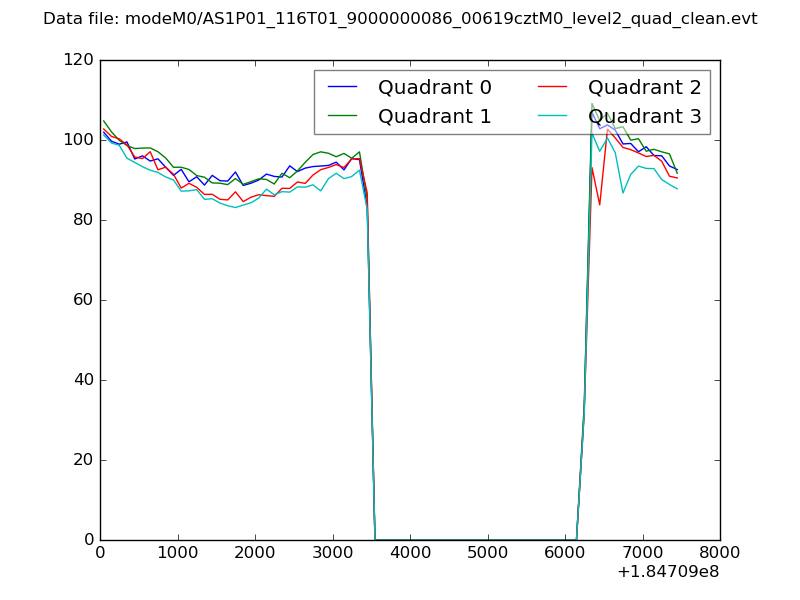 |
|
| Module-wise count rates for Quadrant A Data is divided into 100 sec bins |
 |
 |
| Module-wise count rates for Quadrant B Data is divided into 100 sec bins |
 |
 |
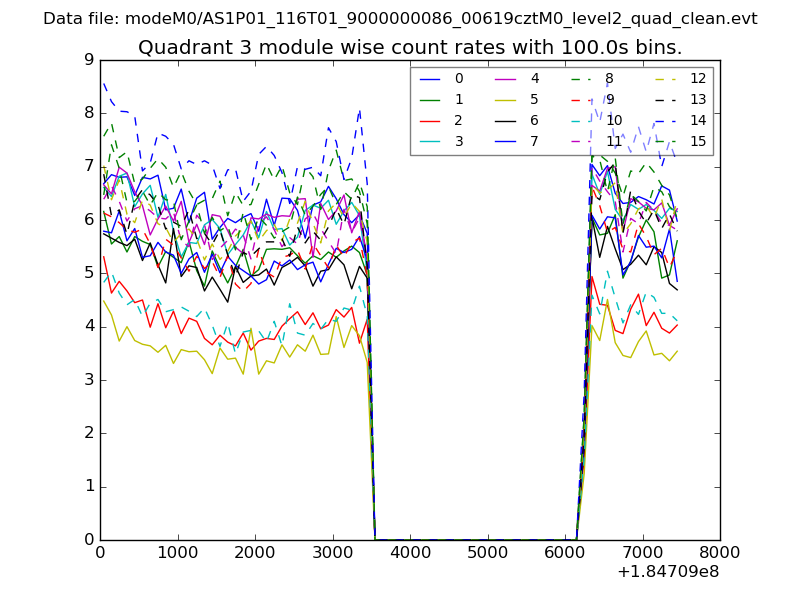
| Module-wise count rates for Quadrant C Data is divided into 100 sec bins |
 |
 |
| Module-wise count rates for Quadrant D Data is divided into 100 sec bins |
 |
 |
| Parameter | Plot |
|---|---|
| CZT HV Monitor |  |
| D_VDD | 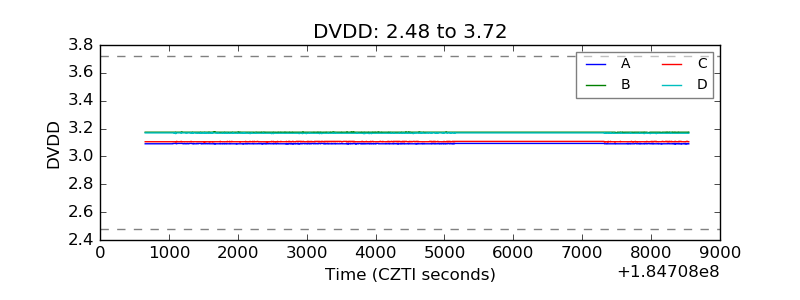 |
| Temperature 1 | 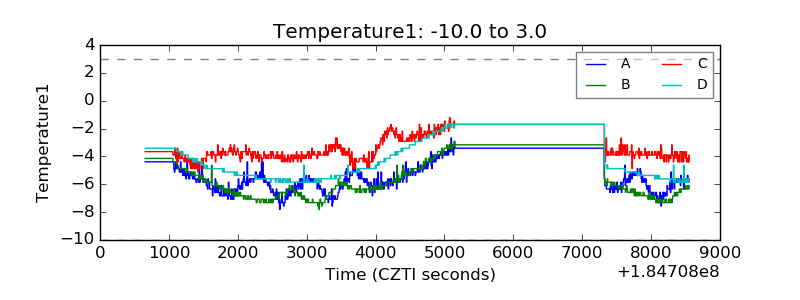 |
| Veto HV Monitor | 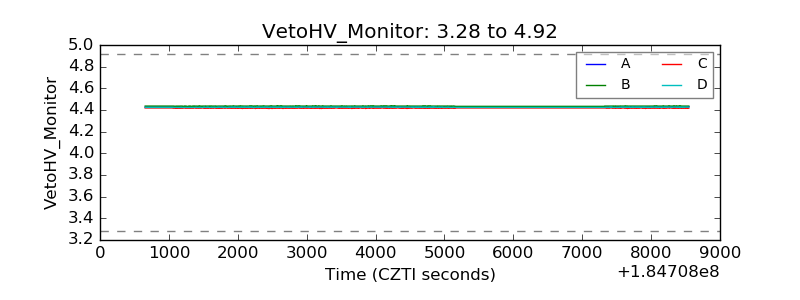 |
| Veto LLD | 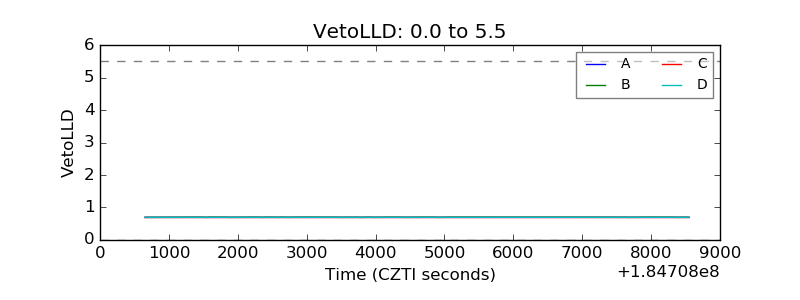 |
| Alpha Counter | 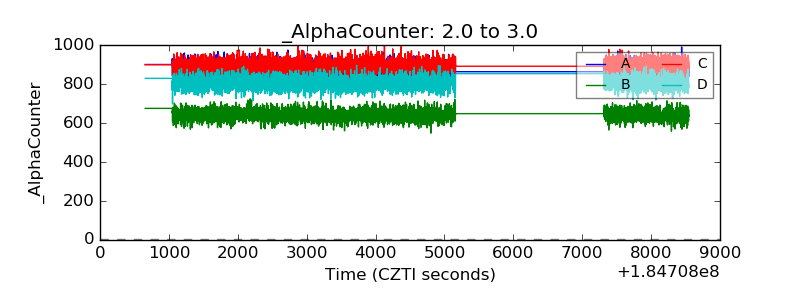 |
| _CPM_Rate | 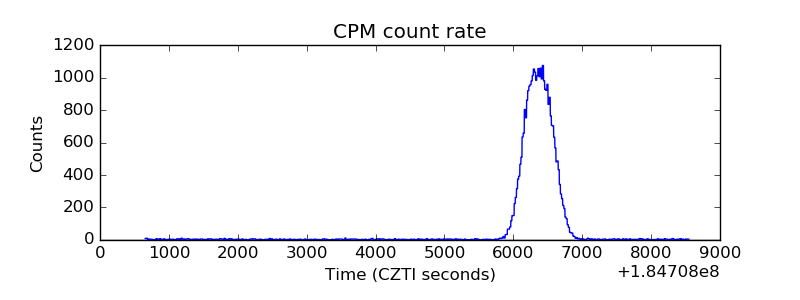 |
| CZT Counter | 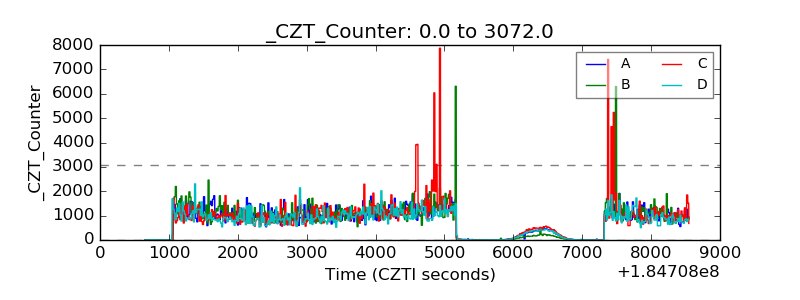 |
| +2.5 Volts monitor |  |
| +5 Volts monitor |  |
| _ROLL_ROT | 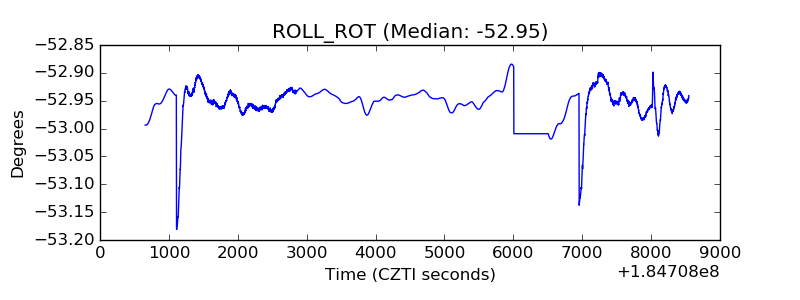 |
| _Roll_DEC | 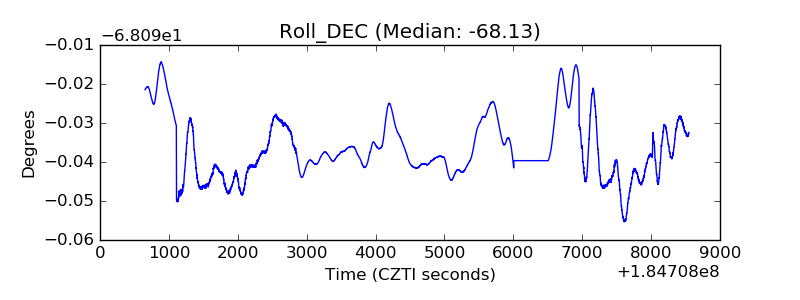 |
| _Roll_RA | 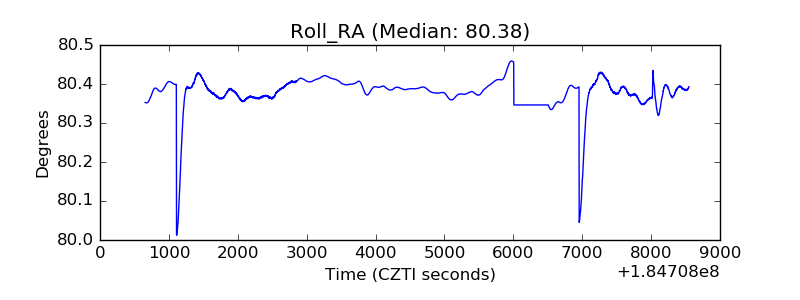 |
| Veto Counter |  |