| Param | Original file | Final file |
|---|---|---|
| Filename | modeM0/AS1P01_116T01_9000000086_00620cztM0_level2.evt | modeM0/AS1P01_116T01_9000000086_00620cztM0_level2_quad_clean.evt |
| Size (bytes) | 801,815,040 | 65,969,280 |
| Size | 764.7 MB | 62.9 MB |
| Events in quadrant A | 5,994,283 | 412,200 |
| Events in quadrant B | 6,232,428 | 420,668 |
| Events in quadrant C | 5,884,696 | 403,384 |
| Events in quadrant D | 5,821,067 | 392,380 |
| Mode M0 | |||
|---|---|---|---|
| Quadrant | BADHDUFLAG | Total packets | Discarded packets |
| A | 0 | 21593 | 3 |
| B | 0 | 22293 | 2 |
| C | 0 | 21226 | 2 |
| D | 0 | 21090 | 2 |
| Mode M9 | |||
|---|---|---|---|
| Quadrant | BADHDUFLAG | Total packets | Discarded packets |
| A | 0 | 29 | 0 |
| B | 0 | 29 | 0 |
| C | 0 | 29 | 0 |
| D | 0 | 30 | 0 |
| Mode SS | |||
|---|---|---|---|
| Quadrant | BADHDUFLAG | Total packets | Discarded packets |
| A | 0 | 106 | 0 |
| B | 0 | 106 | 0 |
| C | 0 | 106 | 0 |
| D | 0 | 106 | 0 |
| Quadrant | Total seconds | Saturated seconds | Saturation percentage |
|---|---|---|---|
| A | 5268 | 6 | 0.113895% |
| B | 5268 | 24 | 0.455581% |
| C | 5268 | 62 | 1.176917% |
| D | 5268 | 106 | 2.012149% |
Noise dominated data is calculated using 1-second bins in cleaned event files. If a bin has >2000 counts, and if more than 50% of those come from <1% of pixels, then it is considered to be noise-dominated and hence unusable.
| Quadrant | # 1 sec bins | Bins with >0 counts | Bins with >2000 counts | High rate bins dominated by noise | Noise dominated (total time) | Noise dominated (detector-on time) | Marked lightcurve |
|---|---|---|---|---|---|---|---|
| A | 7423 | 5269 | 112 | 112 | 1.51% | 2.13% | 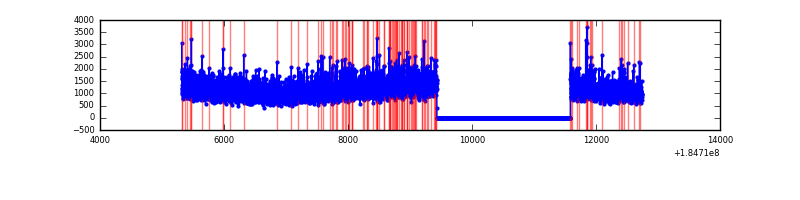 |
| B | 7423 | 5269 | 124 | 124 | 1.67% | 2.35% | 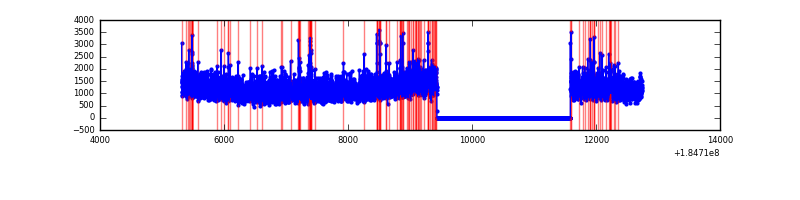 |
| C | 7423 | 5269 | 100 | 100 | 1.35% | 1.90% | 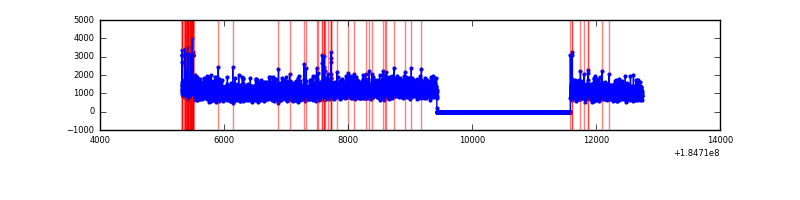 |
| D | 7423 | 5269 | 239 | 239 | 3.22% | 4.54% | 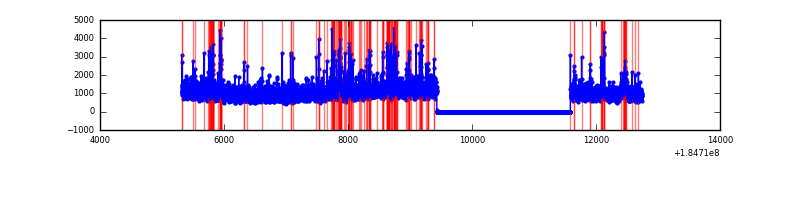 |
Top three noisy pixels from each quadrant. If the there are fewer than three noisy pixels in the level2.evt file, extra rows are filled as -1
| Pixel properties | Quadrant properties | ||||||
|---|---|---|---|---|---|---|---|
| Quadrant | DetID | PixID | Counts | Sigma | Mean | Median | Sigma |
| A | 13 | 160 | 49946 | 142.44 | 1517 | 1498 | 340.1 |
| A | 0 | 238 | 27932 | 77.72 | 1517 | 1498 | 340.1 |
| A | 15 | 171 | 21854 | 59.85 | 1517 | 1498 | 340.1 |
| B | 7 | 221 | 125597 | 347.64 | 1546 | 1553 | 356.8 |
| B | 5 | 191 | 91219 | 251.3 | 1546 | 1553 | 356.8 |
| B | 0 | 220 | 77944 | 214.09 | 1546 | 1553 | 356.8 |
| C | 9 | 83 | 179634 | 450.48 | 1434 | 1489 | 395.5 |
| C | 15 | 241 | 55719 | 137.13 | 1434 | 1489 | 395.5 |
| C | 3 | 159 | 9724 | 20.82 | 1434 | 1489 | 395.5 |
| D | 1 | 4 | 361886 | 861.46 | 1340 | 1393 | 418.5 |
| D | 14 | 52 | 157424 | 372.86 | 1340 | 1393 | 418.5 |
| D | 13 | 221 | 49370 | 114.65 | 1340 | 1393 | 418.5 |
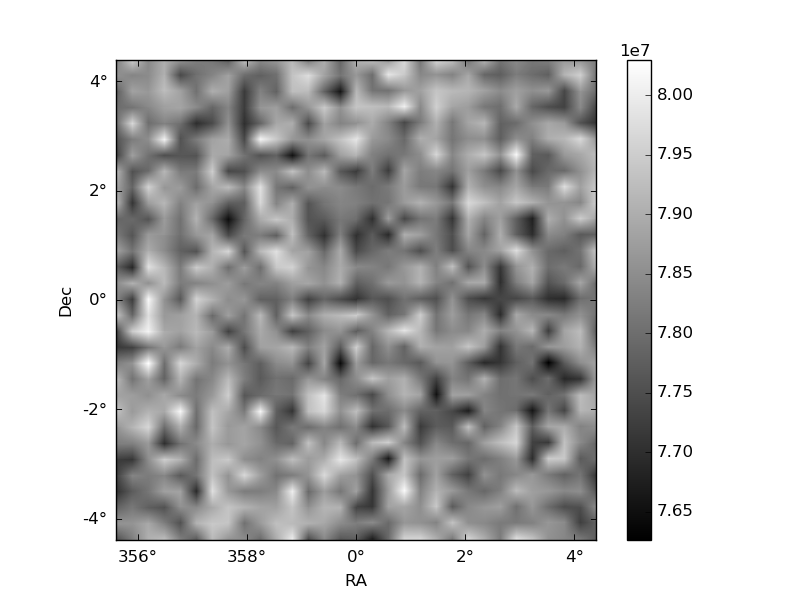
Histogram calculated using DETX and DETY for each event in the final _common_clean file
| Quadrant A | 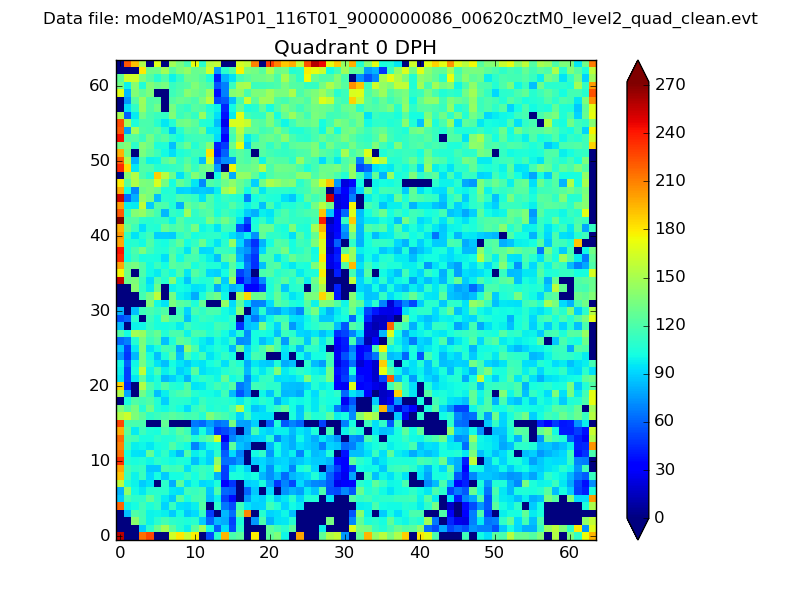 |
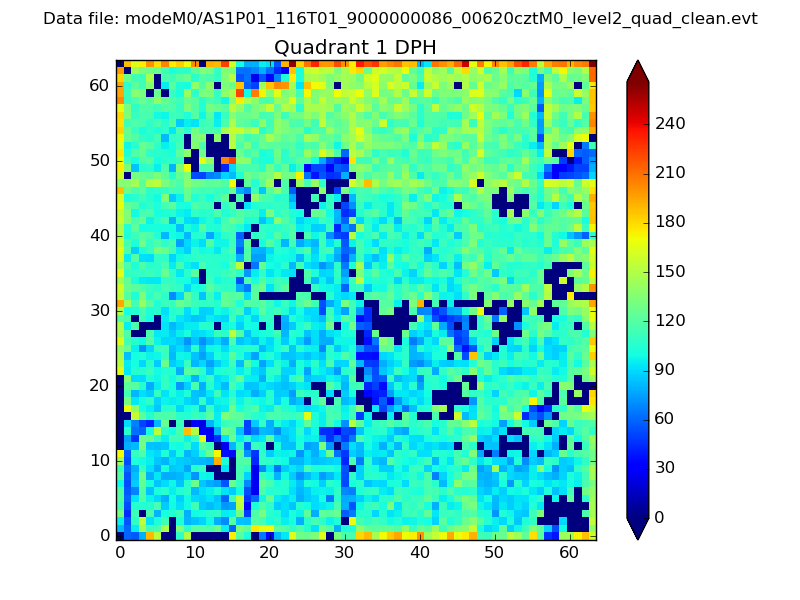 |
Quadrant B |
|---|---|---|---|
| Quadrant D |  |
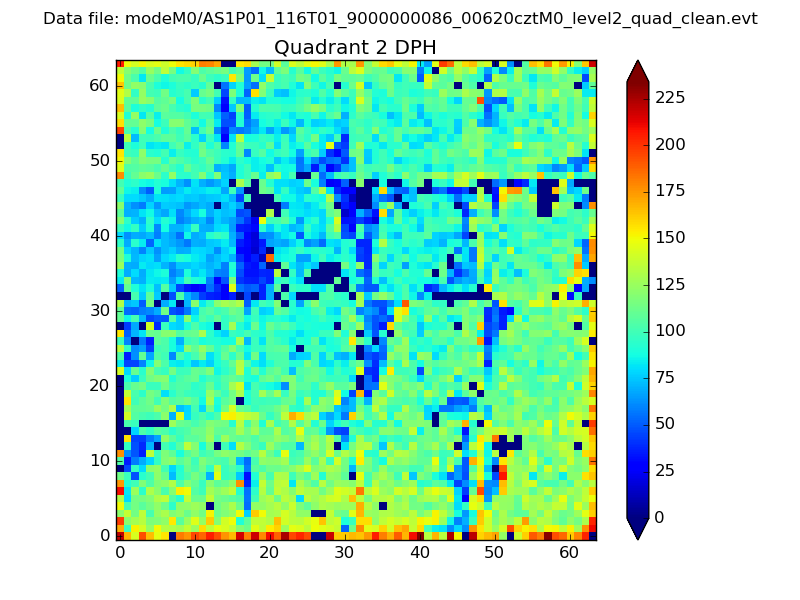 |
Quadrant C |
| Plot type | Count rate plots | Images |
|---|---|---|
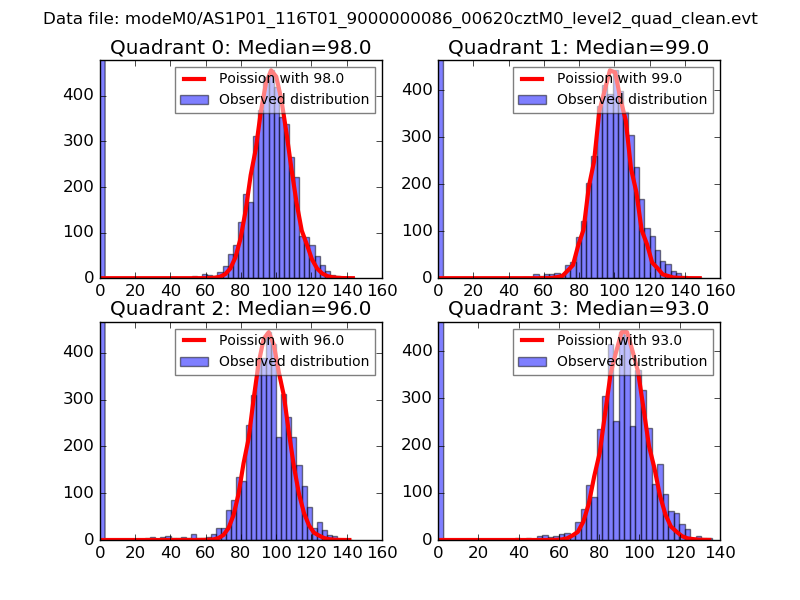
| Comparison with Poisson distribution Blue bars denote a histogram of data divided into 1 sec bins. Red curve is a Poisson curve with rate = median count rate of data. |
 |
 |
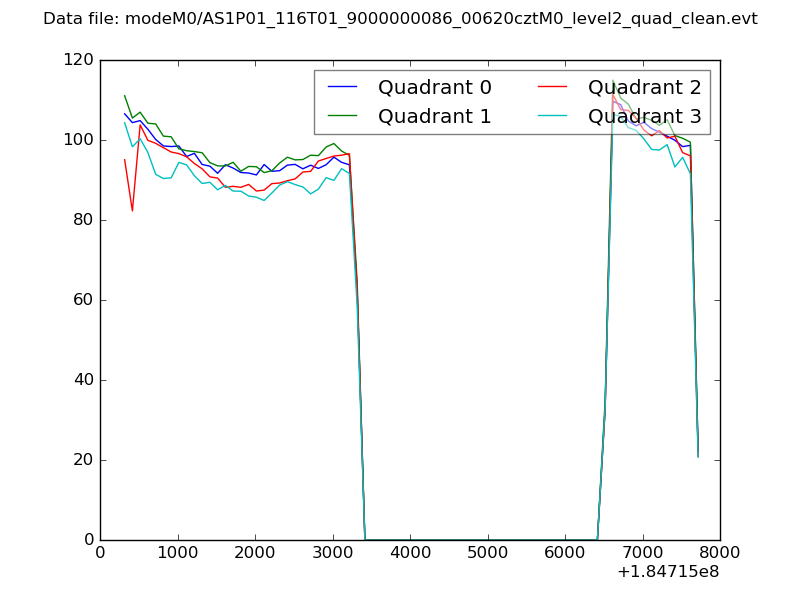
| Quadrant-wise count rates Data is divided into 100 sec bins |
 |
|
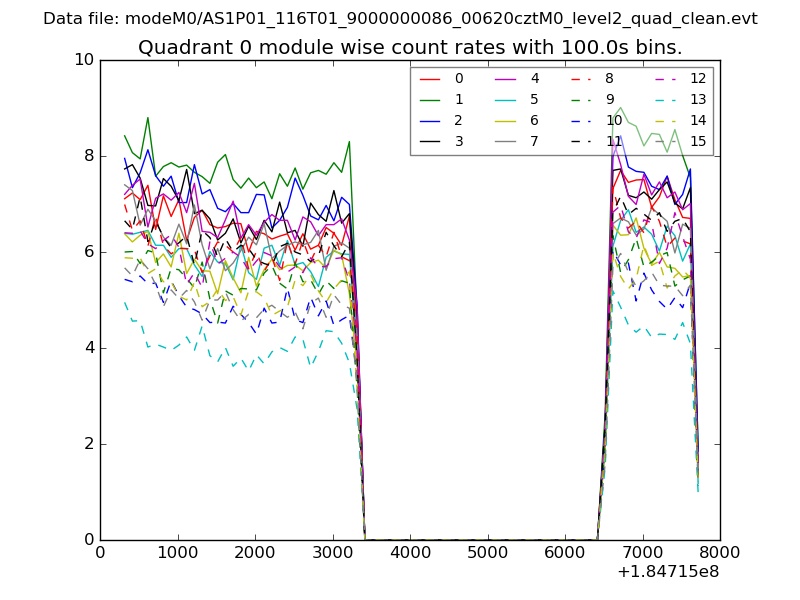
| Module-wise count rates for Quadrant A Data is divided into 100 sec bins |
 |
 |
| Module-wise count rates for Quadrant B Data is divided into 100 sec bins |
 |
 |
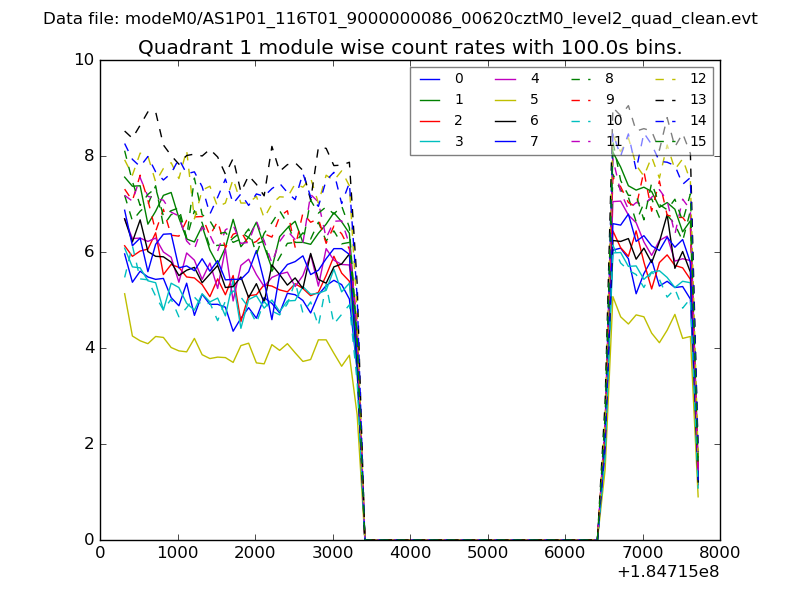
| Module-wise count rates for Quadrant C Data is divided into 100 sec bins |
 |
 |
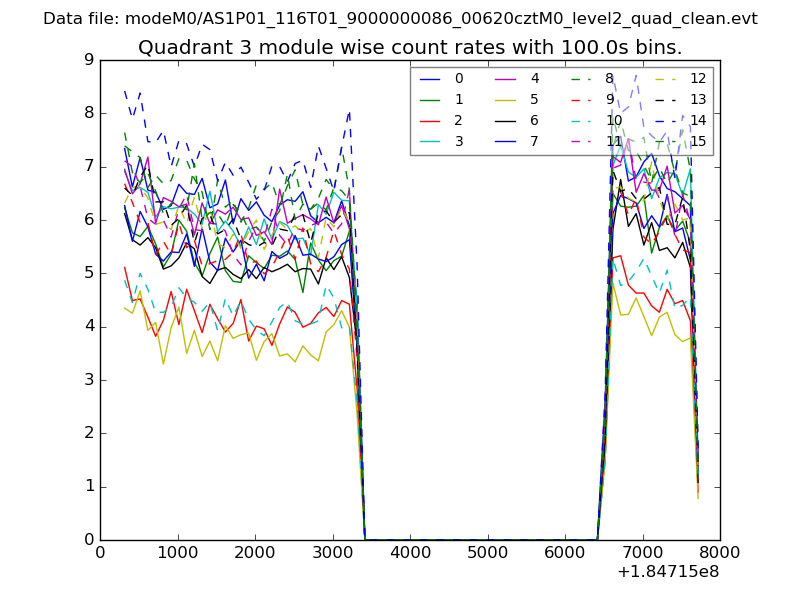
| Module-wise count rates for Quadrant D Data is divided into 100 sec bins |
 |
 |
| Parameter | Plot |
|---|---|
| CZT HV Monitor | 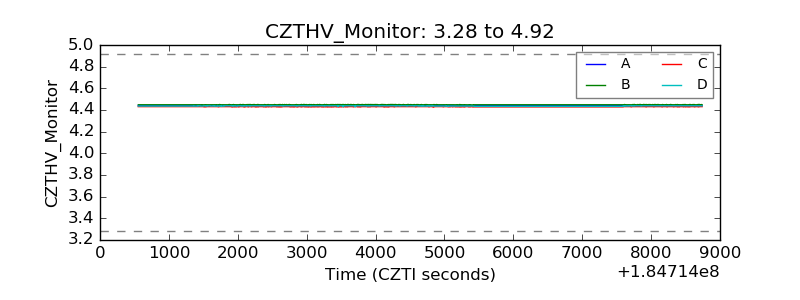 |
| D_VDD | 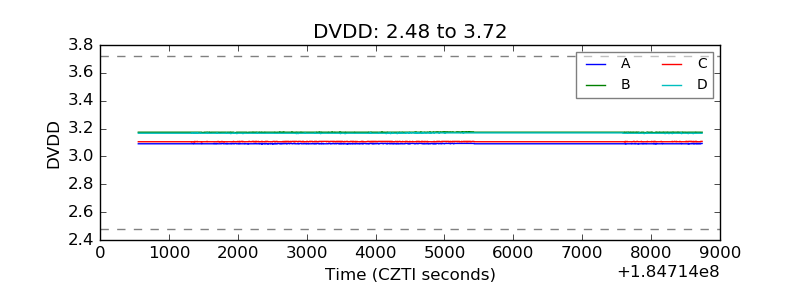 |
| Temperature 1 | 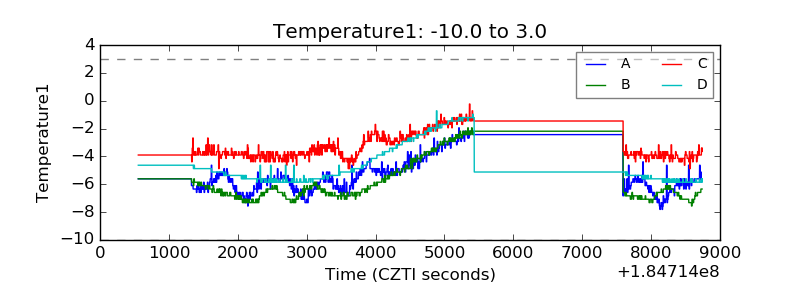 |
| Veto HV Monitor | 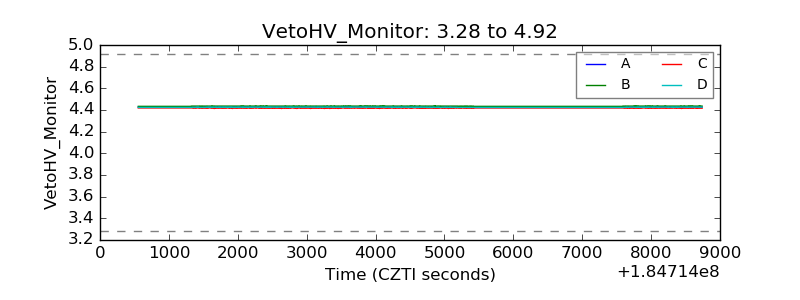 |
| Veto LLD | 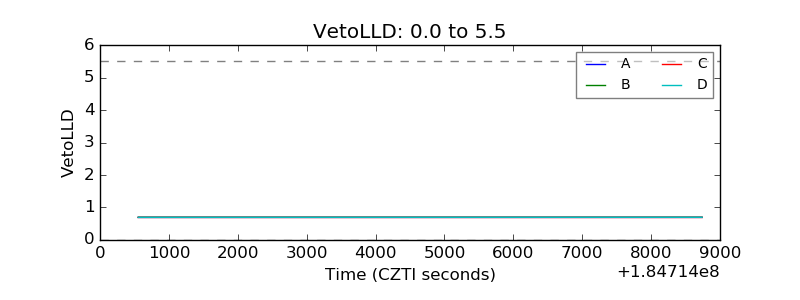 |
| Alpha Counter | 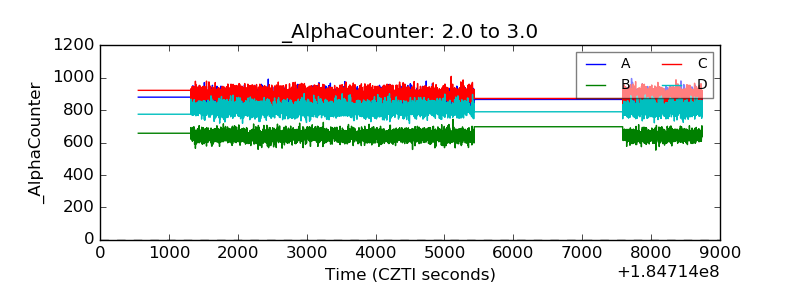 |
| _CPM_Rate |  |
| CZT Counter | 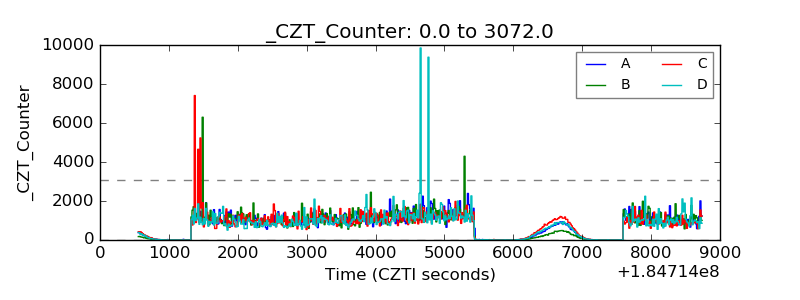 |
| +2.5 Volts monitor |  |
| +5 Volts monitor |  |
| _ROLL_ROT | 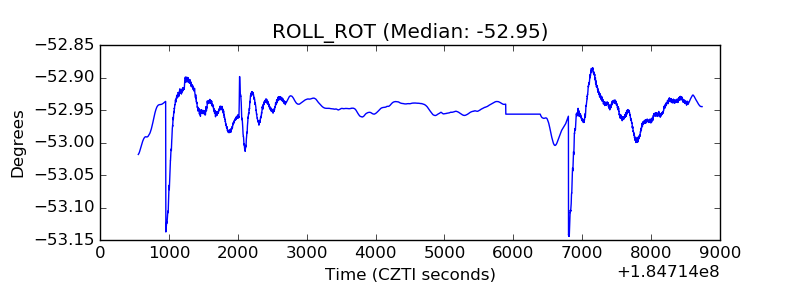 |
| _Roll_DEC | 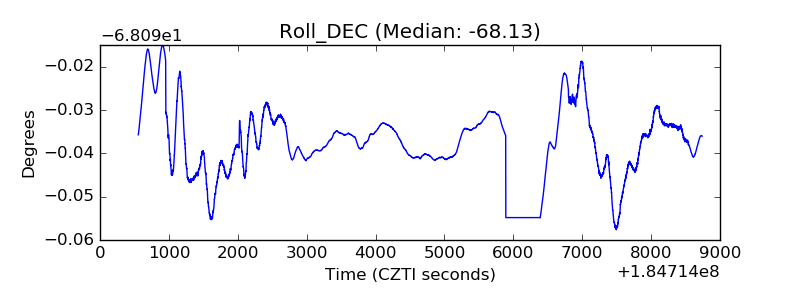 |
| _Roll_RA | 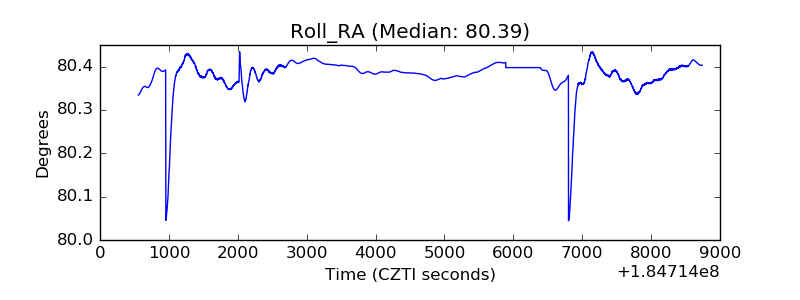 |
| Veto Counter | 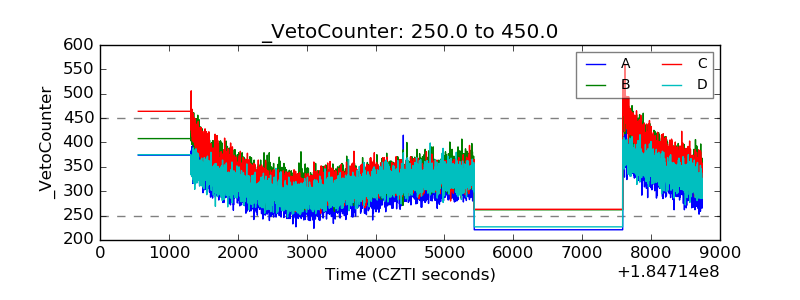 |