| Param | Original file | Final file |
|---|---|---|
| Filename | modeM0/AS1P01_116T01_9000000086_00621cztM0_level2.evt | modeM0/AS1P01_116T01_9000000086_00621cztM0_level2_quad_clean.evt |
| Size (bytes) | 806,912,640 | 67,383,360 |
| Size | 769.5 MB | 64.3 MB |
| Events in quadrant A | 6,070,580 | 420,440 |
| Events in quadrant B | 6,412,161 | 430,250 |
| Events in quadrant C | 5,771,221 | 419,008 |
| Events in quadrant D | 5,833,223 | 402,136 |
| Mode M0 | |||
|---|---|---|---|
| Quadrant | BADHDUFLAG | Total packets | Discarded packets |
| A | 0 | 21771 | 3 |
| B | 0 | 22789 | 2 |
| C | 0 | 20896 | 2 |
| D | 0 | 21131 | 2 |
| Mode M9 | |||
|---|---|---|---|
| Quadrant | BADHDUFLAG | Total packets | Discarded packets |
| A | 0 | 33 | 0 |
| B | 0 | 33 | 0 |
| C | 0 | 33 | 0 |
| D | 0 | 34 | 0 |
| Mode SS | |||
|---|---|---|---|
| Quadrant | BADHDUFLAG | Total packets | Discarded packets |
| A | 0 | 106 | 0 |
| B | 0 | 106 | 0 |
| C | 0 | 106 | 0 |
| D | 0 | 106 | 0 |
| Quadrant | Total seconds | Saturated seconds | Saturation percentage |
|---|---|---|---|
| A | 5265 | 6 | 0.113960% |
| B | 5265 | 22 | 0.417854% |
| C | 5265 | 4 | 0.075973% |
| D | 5265 | 71 | 1.348528% |
Noise dominated data is calculated using 1-second bins in cleaned event files. If a bin has >2000 counts, and if more than 50% of those come from <1% of pixels, then it is considered to be noise-dominated and hence unusable.
| Quadrant | # 1 sec bins | Bins with >0 counts | Bins with >2000 counts | High rate bins dominated by noise | Noise dominated (total time) | Noise dominated (detector-on time) | Marked lightcurve |
|---|---|---|---|---|---|---|---|
| A | 7419 | 5266 | 112 | 112 | 1.51% | 2.13% | 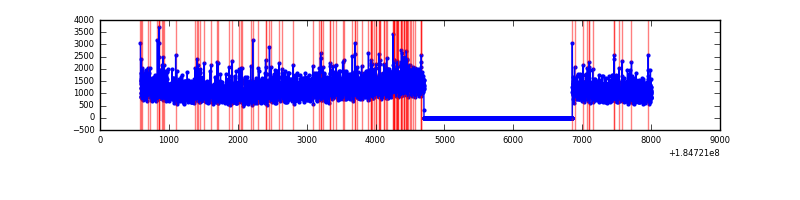 |
| B | 7419 | 5266 | 170 | 170 | 2.29% | 3.23% | 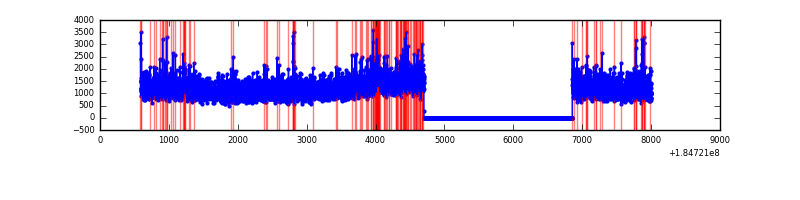 |
| C | 7419 | 5266 | 43 | 43 | 0.58% | 0.82% | 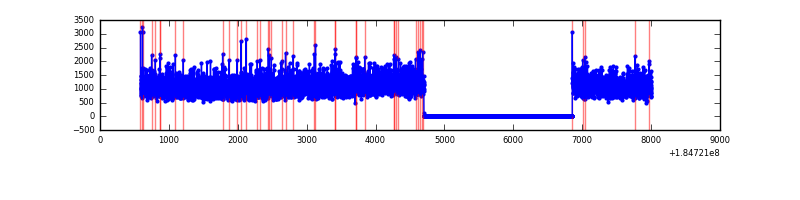 |
| D | 7419 | 5266 | 179 | 179 | 2.41% | 3.40% | 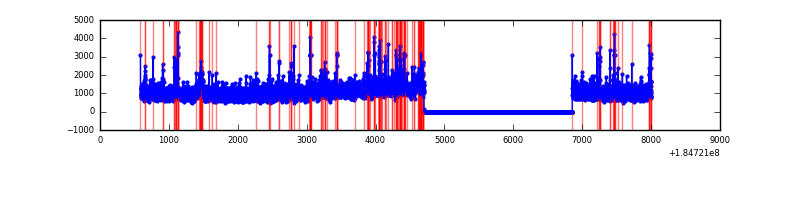 |
Top three noisy pixels from each quadrant. If the there are fewer than three noisy pixels in the level2.evt file, extra rows are filled as -1
| Pixel properties | Quadrant properties | ||||||
|---|---|---|---|---|---|---|---|
| Quadrant | DetID | PixID | Counts | Sigma | Mean | Median | Sigma |
| A | 0 | 238 | 34992 | 99.82 | 1539 | 1525 | 335.3 |
| A | 13 | 160 | 28071 | 79.18 | 1539 | 1525 | 335.3 |
| A | 15 | 171 | 21158 | 58.56 | 1539 | 1525 | 335.3 |
| B | 7 | 221 | 242404 | 669.1 | 1565 | 1570 | 359.9 |
| B | 0 | 220 | 89436 | 244.11 | 1565 | 1570 | 359.9 |
| B | 5 | 191 | 65584 | 177.85 | 1565 | 1570 | 359.9 |
| C | 15 | 241 | 25264 | 58.86 | 1459 | 1517 | 403.5 |
| C | 3 | 159 | 10390 | 21.99 | 1459 | 1517 | 403.5 |
| C | 9 | 206 | 4331 | 6.97 | 1459 | 1517 | 403.5 |
| D | 1 | 4 | 283228 | 650.36 | 1386 | 1438 | 433.3 |
| D | 14 | 52 | 119883 | 273.36 | 1386 | 1438 | 433.3 |
| D | 13 | 221 | 82486 | 187.05 | 1386 | 1438 | 433.3 |
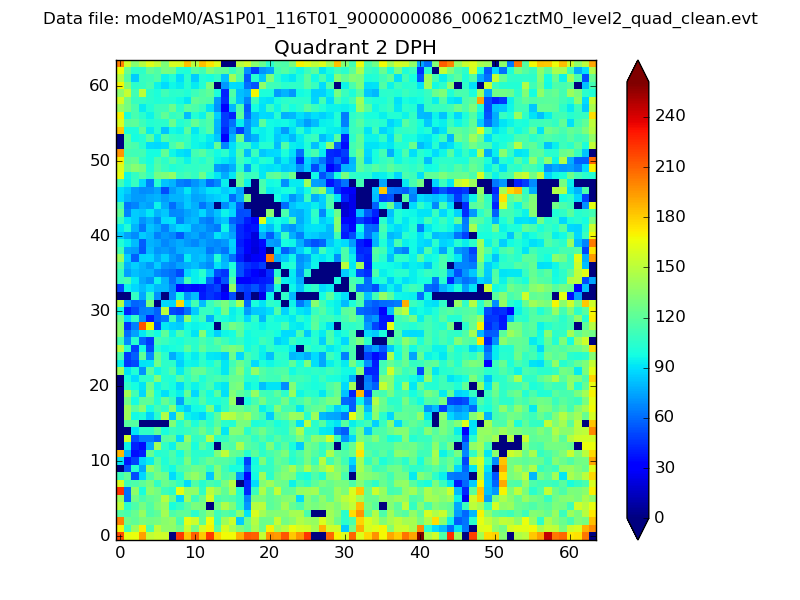
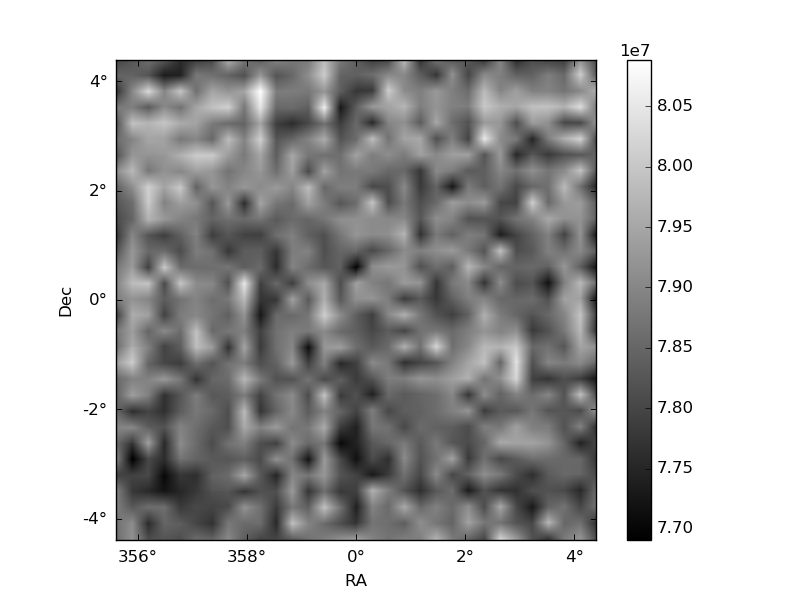
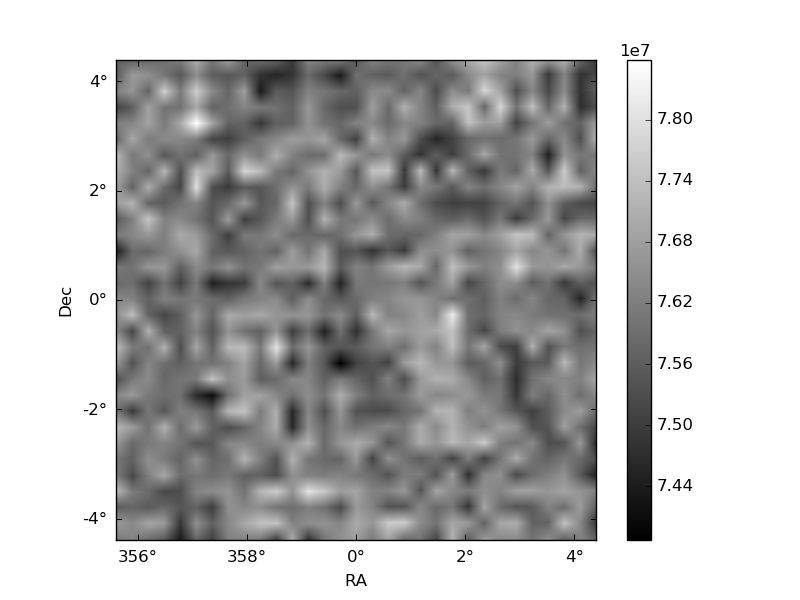
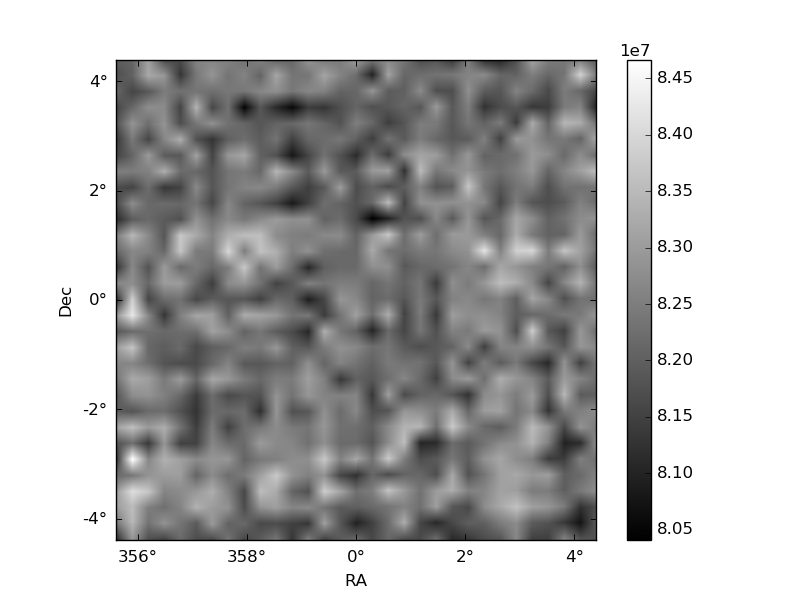
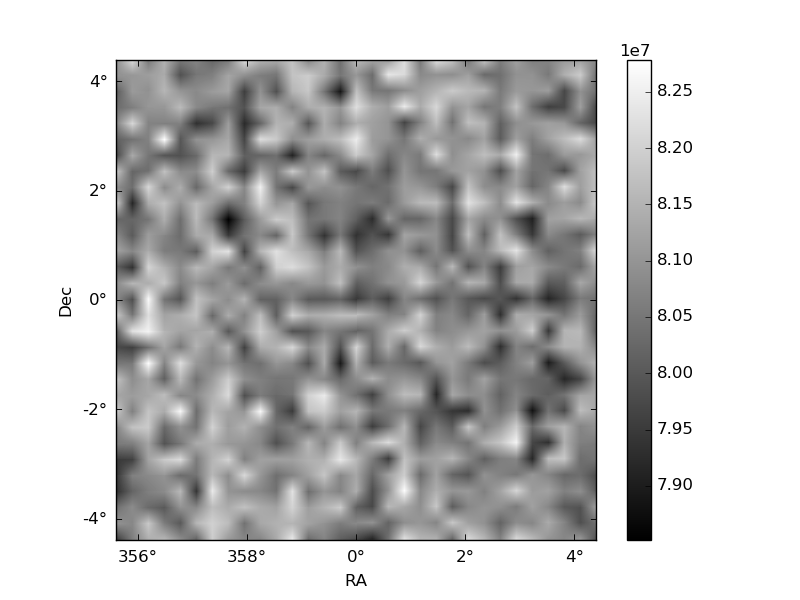
Histogram calculated using DETX and DETY for each event in the final _common_clean file
| Quadrant A | 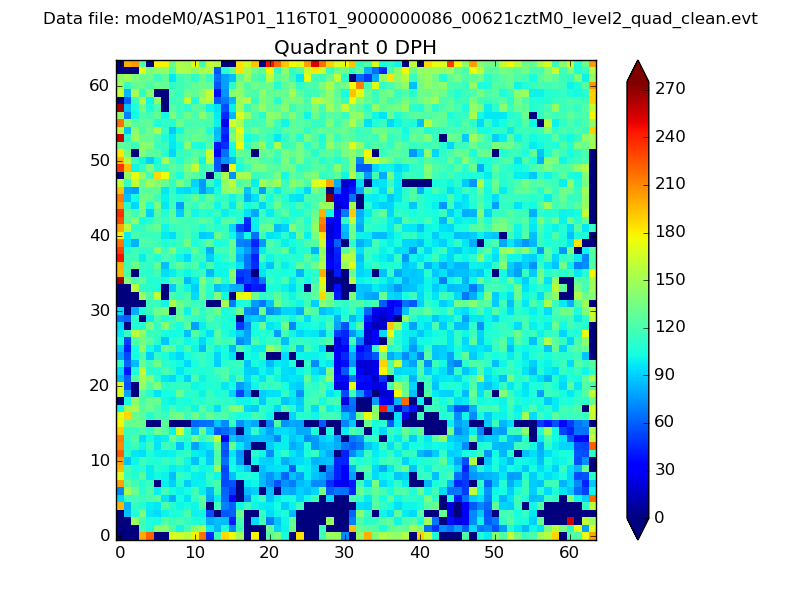 |
 |
Quadrant B |
|---|---|---|---|
| Quadrant D |  |
 |
Quadrant C |
| Plot type | Count rate plots | Images |
|---|---|---|
| Comparison with Poisson distribution Blue bars denote a histogram of data divided into 1 sec bins. Red curve is a Poisson curve with rate = median count rate of data. |
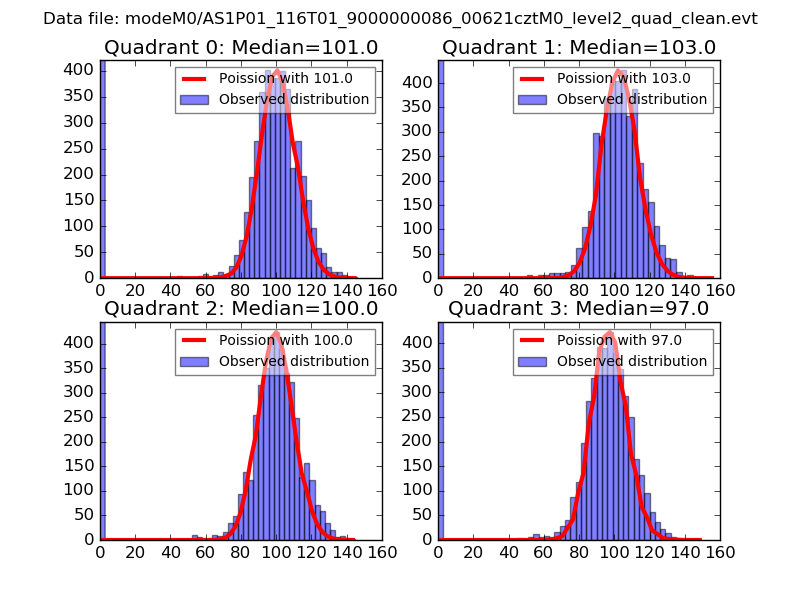 |
 |
| Quadrant-wise count rates Data is divided into 100 sec bins |
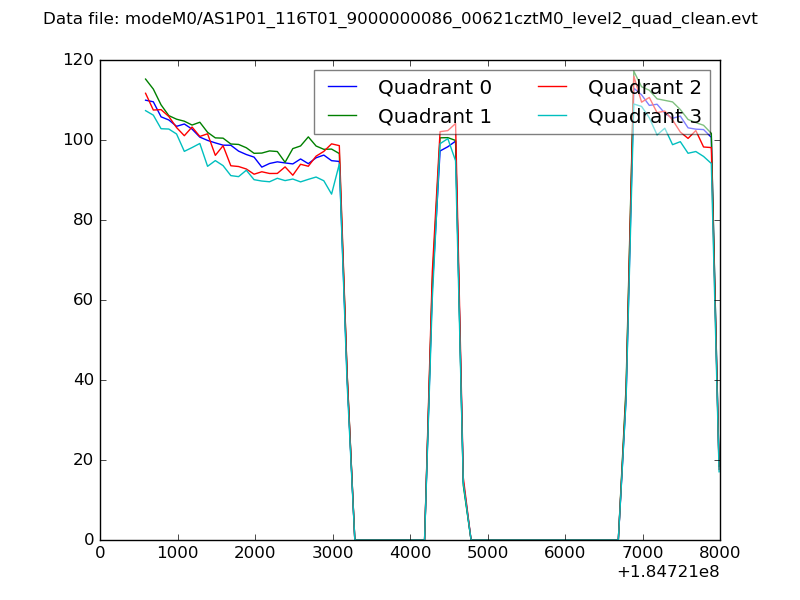 |
|
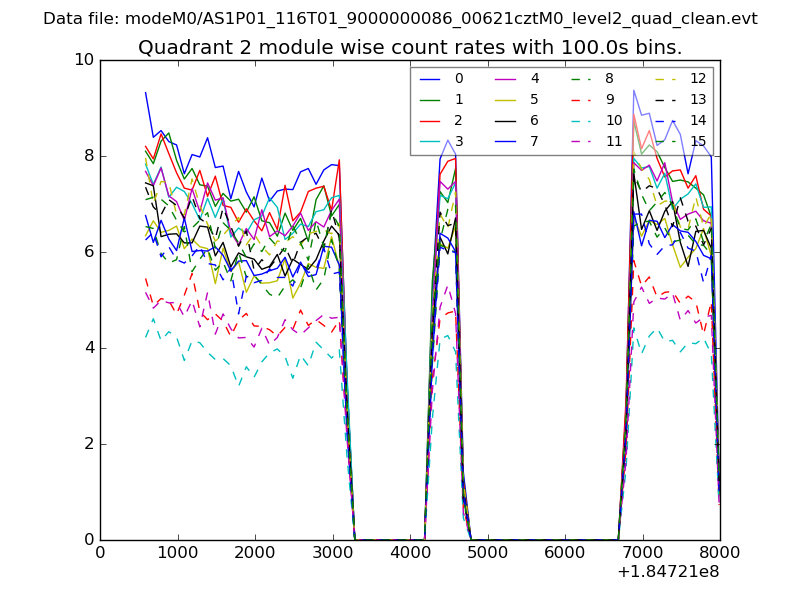
| Module-wise count rates for Quadrant A Data is divided into 100 sec bins |
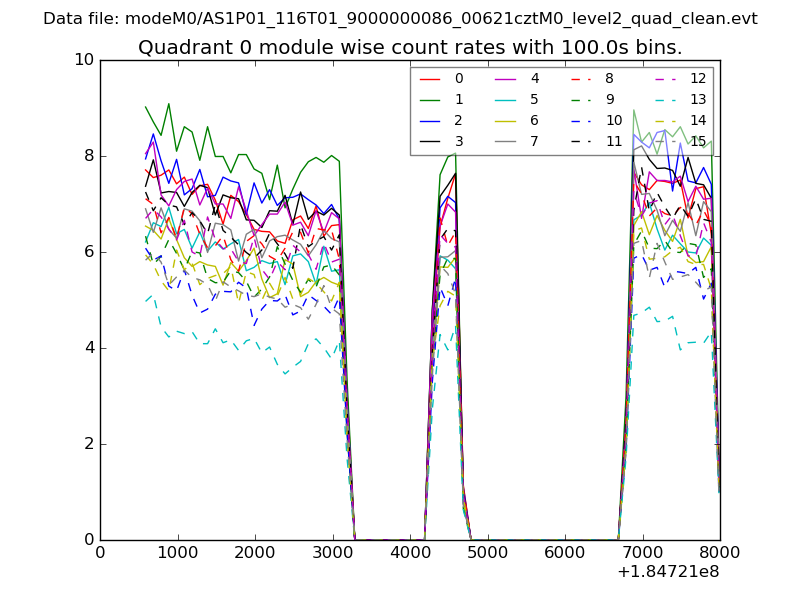 |
 |
| Module-wise count rates for Quadrant B Data is divided into 100 sec bins |
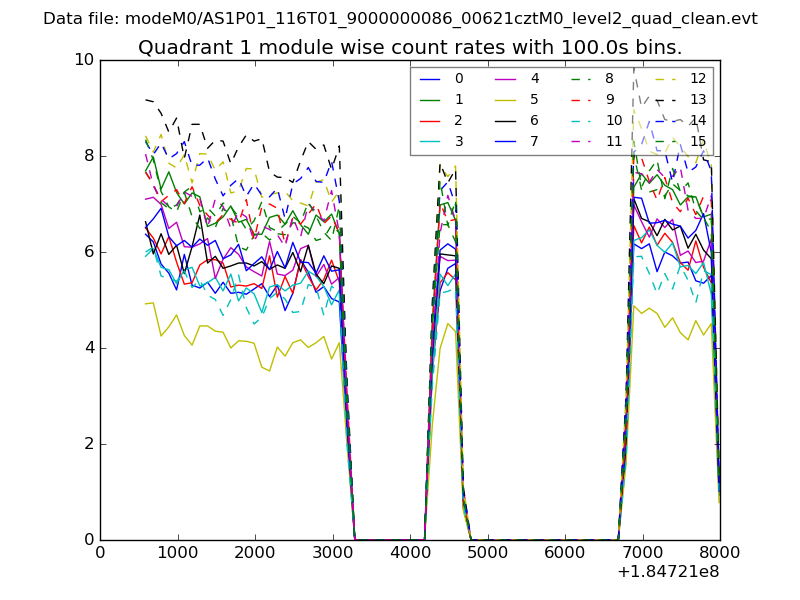 |
 |
| Module-wise count rates for Quadrant C Data is divided into 100 sec bins |
 |
 |
| Module-wise count rates for Quadrant D Data is divided into 100 sec bins |
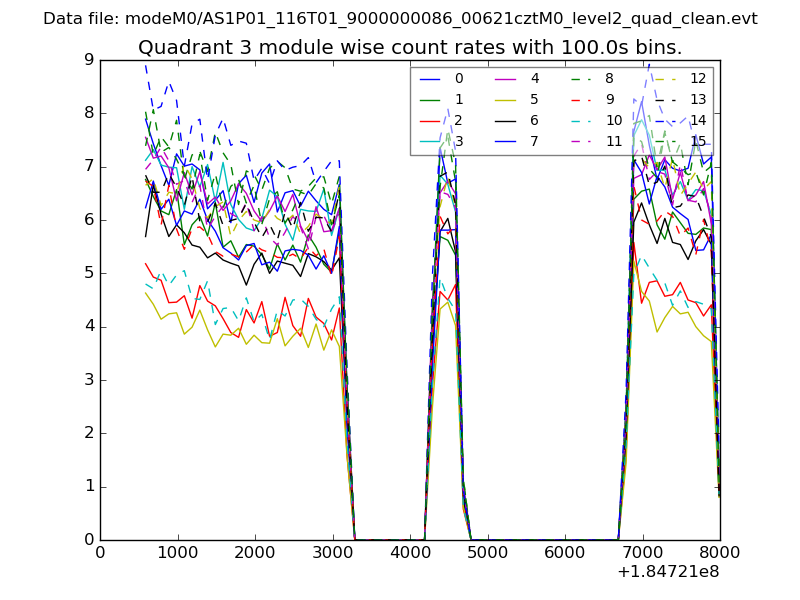 |
 |
| Parameter | Plot |
|---|---|
| CZT HV Monitor | 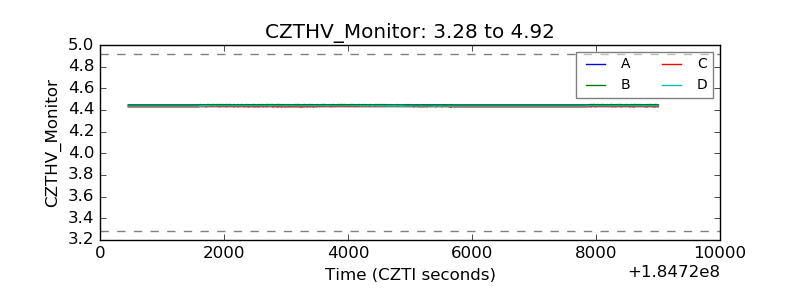 |
| D_VDD |  |
| Temperature 1 | 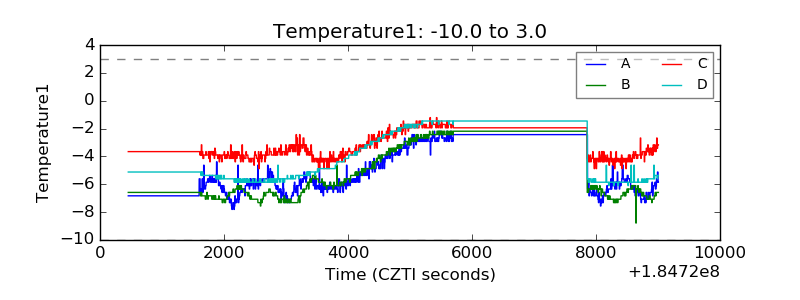 |
| Veto HV Monitor | 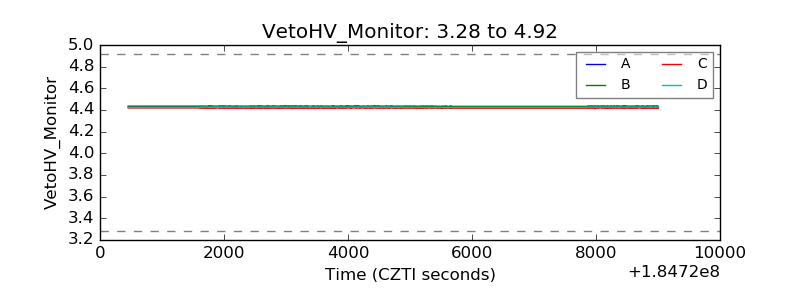 |
| Veto LLD | 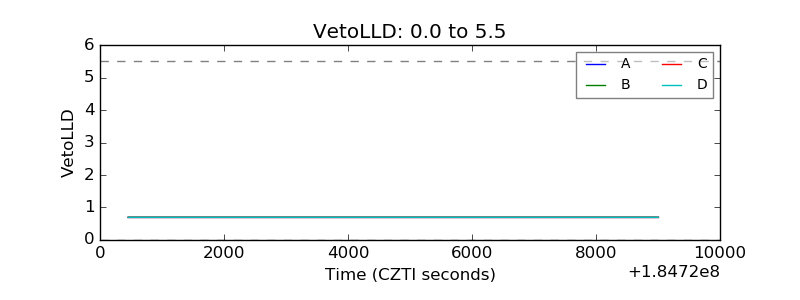 |
| Alpha Counter | 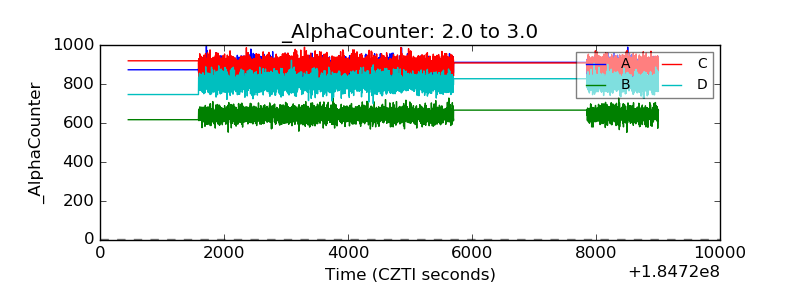 |
| _CPM_Rate | 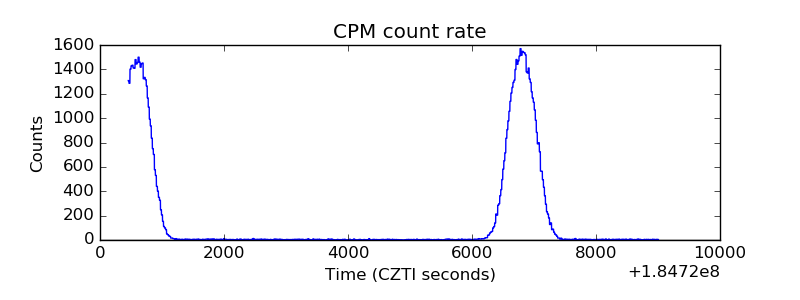 |
| CZT Counter | 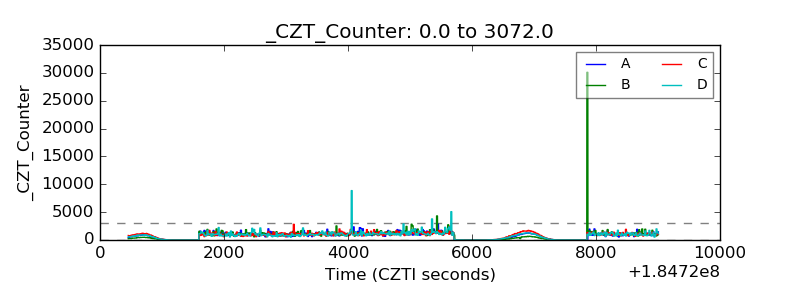 |
| +2.5 Volts monitor |  |
| +5 Volts monitor |  |
| _ROLL_ROT | 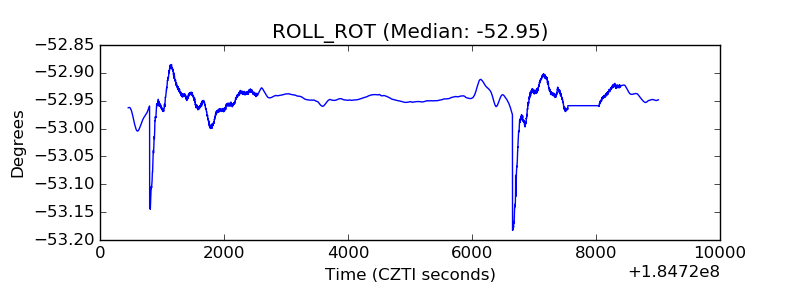 |
| _Roll_DEC | 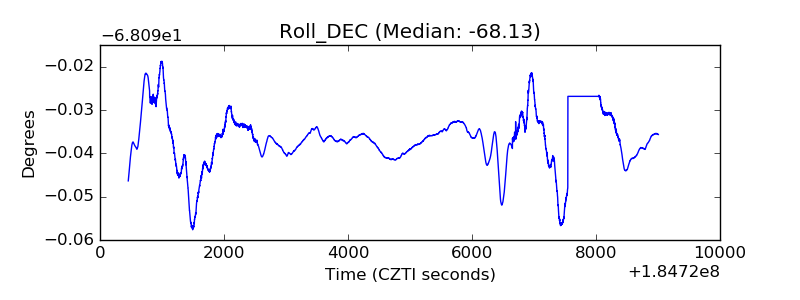 |
| _Roll_RA | 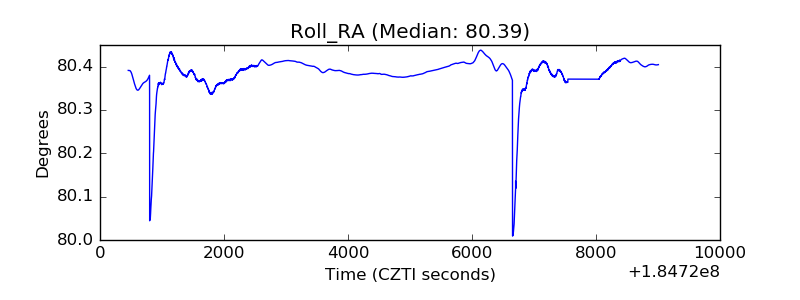 |
| Veto Counter | 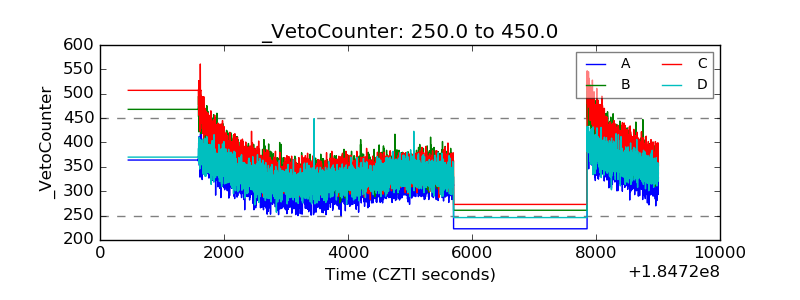 |