| Param | Original file | Final file |
|---|---|---|
| Filename | modeM0/AS1P01_116T01_9000000086_00622cztM0_level2.evt | modeM0/AS1P01_116T01_9000000086_00622cztM0_level2_quad_clean.evt |
| Size (bytes) | 785,442,240 | 64,056,960 |
| Size | 749.1 MB | 61.1 MB |
| Events in quadrant A | 5,884,458 | 396,434 |
| Events in quadrant B | 6,134,591 | 409,221 |
| Events in quadrant C | 5,598,952 | 400,900 |
| Events in quadrant D | 5,834,866 | 380,787 |
| Mode M0 | |||
|---|---|---|---|
| Quadrant | BADHDUFLAG | Total packets | Discarded packets |
| A | 0 | 21052 | 2 |
| B | 0 | 21786 | 1 |
| C | 0 | 20211 | 1 |
| D | 0 | 20963 | 1 |
| Mode M9 | |||
|---|---|---|---|
| Quadrant | BADHDUFLAG | Total packets | Discarded packets |
| A | 0 | 21 | 0 |
| B | 0 | 21 | 0 |
| C | 0 | 21 | 0 |
| D | 0 | 21 | 0 |
| Mode SS | |||
|---|---|---|---|
| Quadrant | BADHDUFLAG | Total packets | Discarded packets |
| A | 0 | 104 | 0 |
| B | 0 | 104 | 0 |
| C | 0 | 104 | 0 |
| D | 0 | 104 | 0 |
| Quadrant | Total seconds | Saturated seconds | Saturation percentage |
|---|---|---|---|
| A | 5017 | 1 | 0.019932% |
| B | 5017 | 21 | 0.418577% |
| C | 5017 | 5 | 0.099661% |
| D | 5017 | 98 | 1.953359% |
Noise dominated data is calculated using 1-second bins in cleaned event files. If a bin has >2000 counts, and if more than 50% of those come from <1% of pixels, then it is considered to be noise-dominated and hence unusable.
| Quadrant | # 1 sec bins | Bins with >0 counts | Bins with >2000 counts | High rate bins dominated by noise | Noise dominated (total time) | Noise dominated (detector-on time) | Marked lightcurve |
|---|---|---|---|---|---|---|---|
| A | 7172 | 5018 | 106 | 106 | 1.48% | 2.11% | 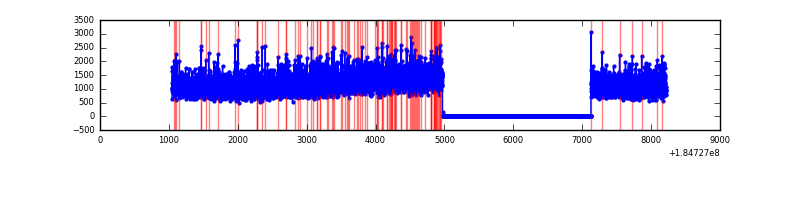 |
| B | 7172 | 5018 | 138 | 138 | 1.92% | 2.75% | 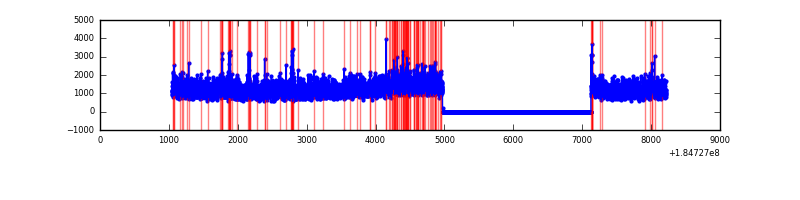 |
| C | 7172 | 5018 | 34 | 34 | 0.47% | 0.68% | 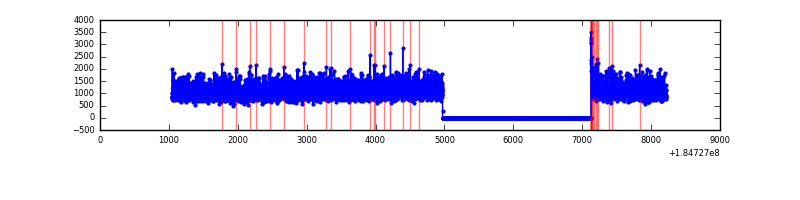 |
| D | 7172 | 5018 | 217 | 217 | 3.03% | 4.32% | 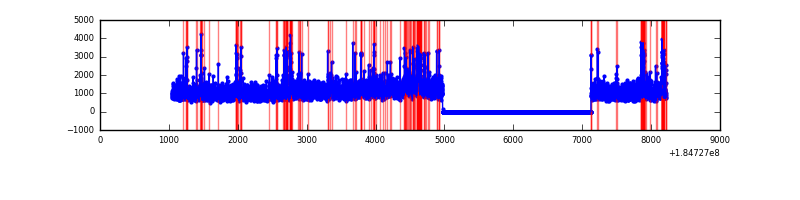 |
Top three noisy pixels from each quadrant. If the there are fewer than three noisy pixels in the level2.evt file, extra rows are filled as -1
| Pixel properties | Quadrant properties | ||||||
|---|---|---|---|---|---|---|---|
| Quadrant | DetID | PixID | Counts | Sigma | Mean | Median | Sigma |
| A | 0 | 238 | 33720 | 98.24 | 1498 | 1480 | 328.2 |
| A | 0 | 117 | 24476 | 70.07 | 1498 | 1480 | 328.2 |
| A | 0 | 69 | 17173 | 47.82 | 1498 | 1480 | 328.2 |
| B | 7 | 221 | 244714 | 700.02 | 1506 | 1510 | 347.4 |
| B | 0 | 220 | 27985 | 76.2 | 1506 | 1510 | 347.4 |
| B | 5 | 191 | 26714 | 72.55 | 1506 | 1510 | 347.4 |
| C | 15 | 241 | 39181 | 96.3 | 1408 | 1461 | 391.7 |
| C | 3 | 159 | 29854 | 72.48 | 1408 | 1461 | 391.7 |
| C | 9 | 206 | 4452 | 7.63 | 1408 | 1461 | 391.7 |
| D | 1 | 4 | 356928 | 852.2 | 1348 | 1401 | 417.2 |
| D | 13 | 221 | 106317 | 251.48 | 1348 | 1401 | 417.2 |
| D | 13 | 155 | 56942 | 133.13 | 1348 | 1401 | 417.2 |
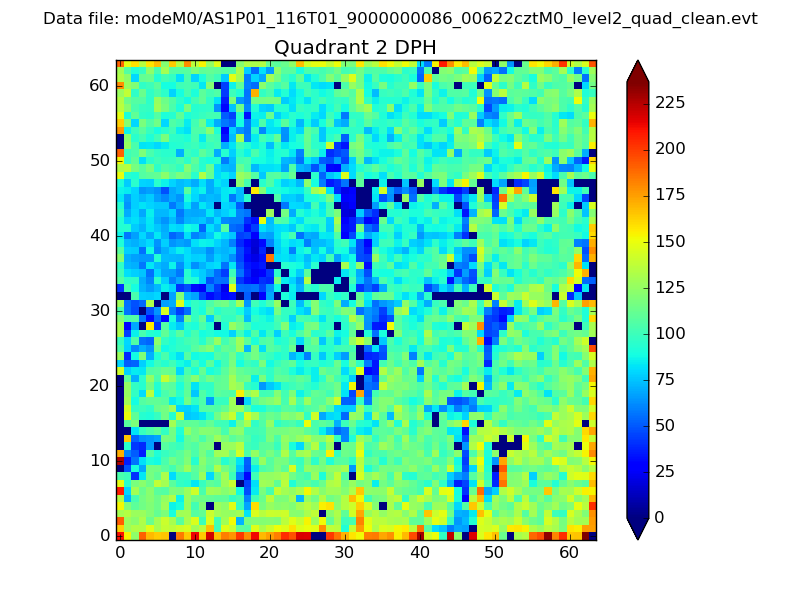
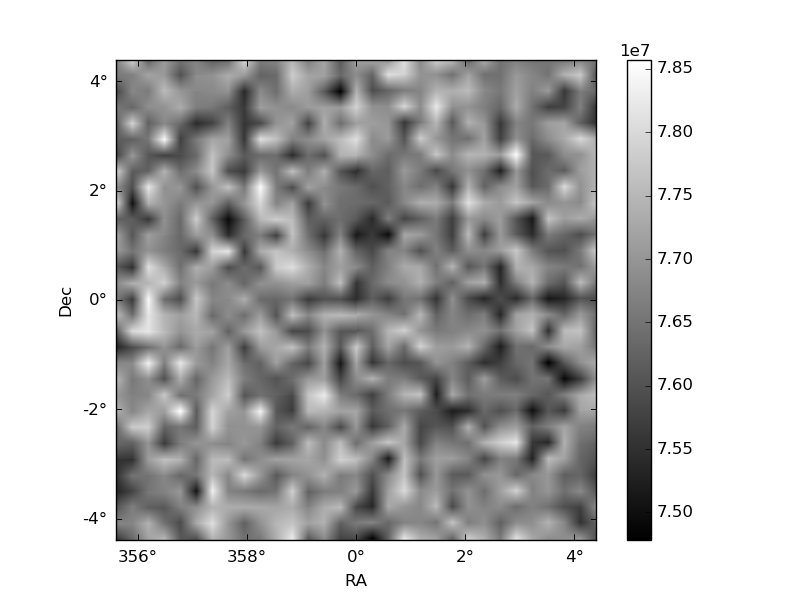
Histogram calculated using DETX and DETY for each event in the final _common_clean file
| Quadrant A | 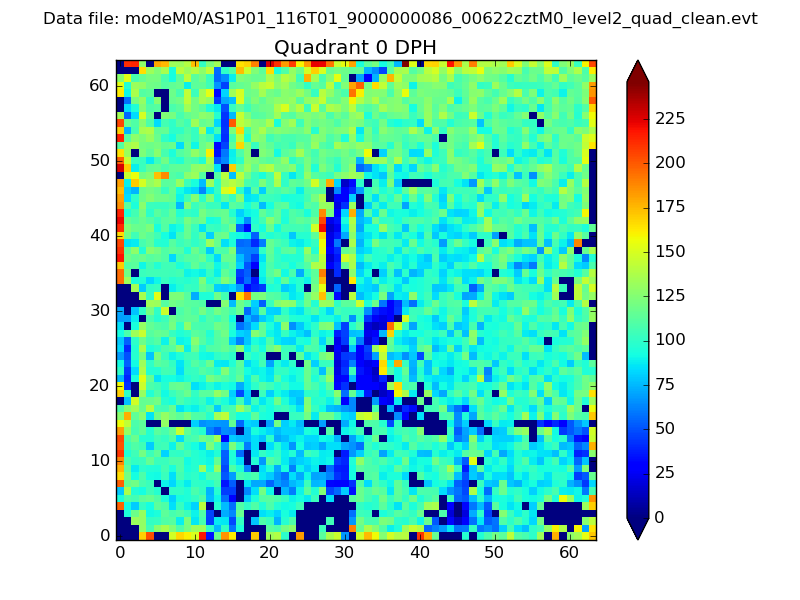 |
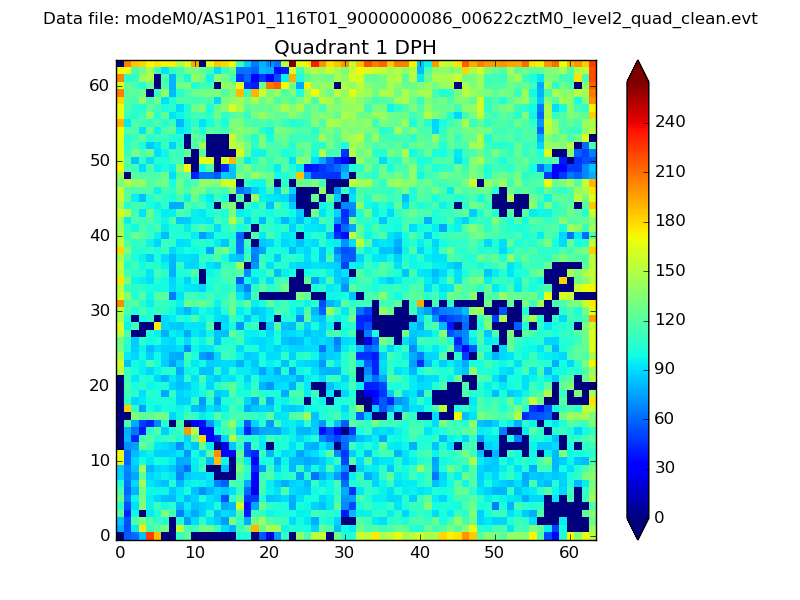 |
Quadrant B |
|---|---|---|---|
| Quadrant D | 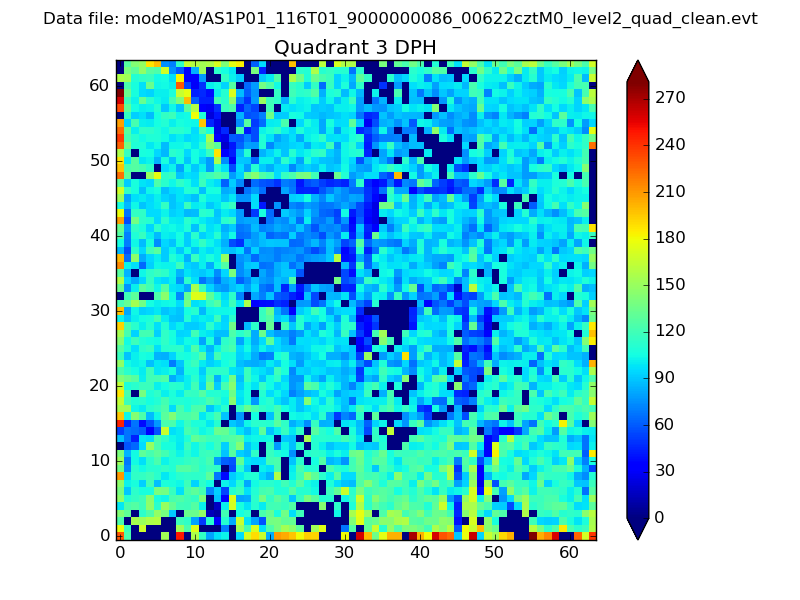 |
 |
Quadrant C |
| Plot type | Count rate plots | Images |
|---|---|---|
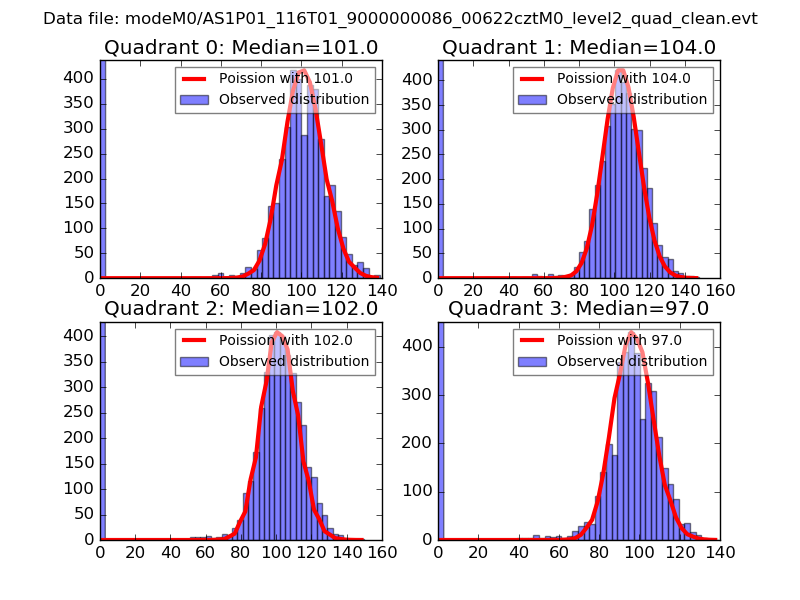
| Comparison with Poisson distribution Blue bars denote a histogram of data divided into 1 sec bins. Red curve is a Poisson curve with rate = median count rate of data. |
 |
 |
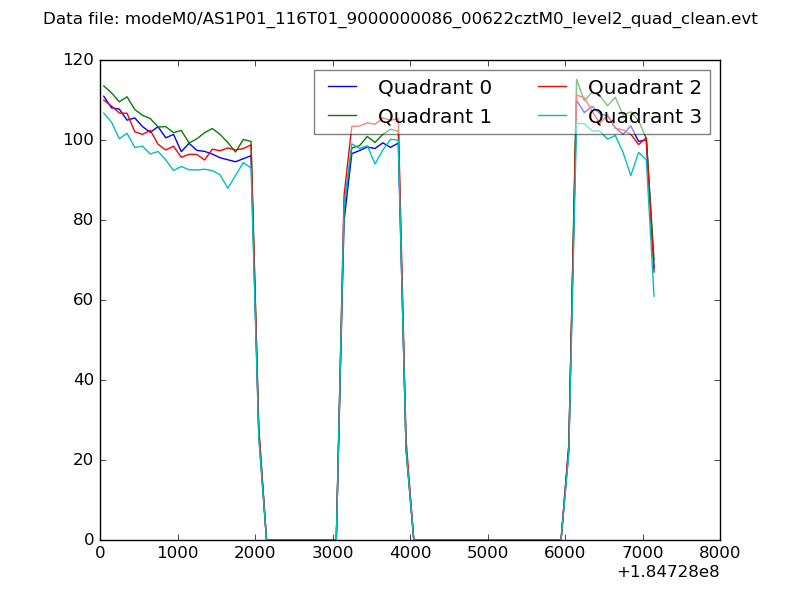
| Quadrant-wise count rates Data is divided into 100 sec bins |
 |
|
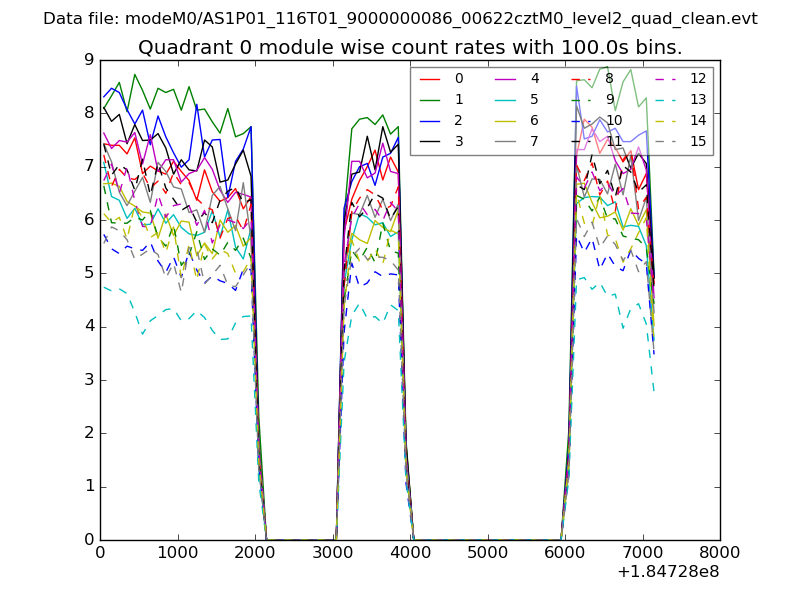
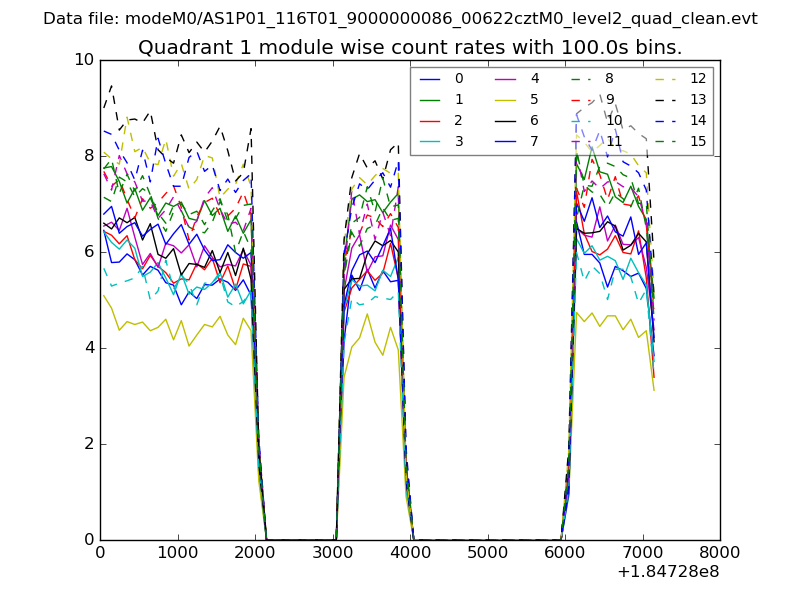
| Module-wise count rates for Quadrant A Data is divided into 100 sec bins |
 |
 |
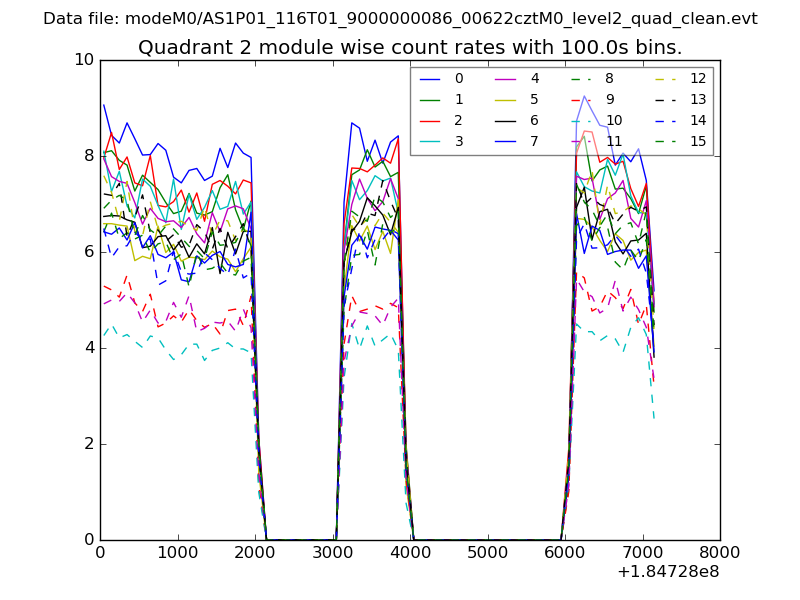
| Module-wise count rates for Quadrant B Data is divided into 100 sec bins |
 |
 |
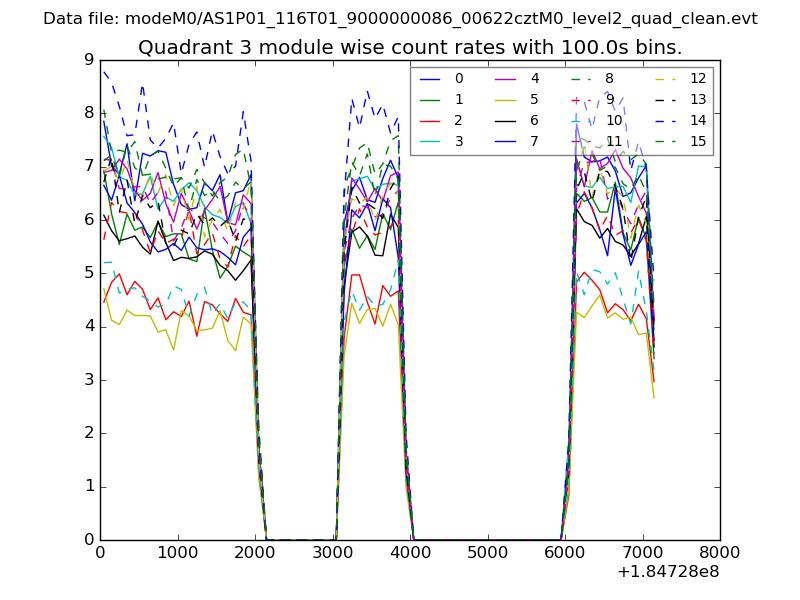
| Module-wise count rates for Quadrant C Data is divided into 100 sec bins |
 |
 |
| Module-wise count rates for Quadrant D Data is divided into 100 sec bins |
 |
 |
| Parameter | Plot |
|---|---|
| CZT HV Monitor | 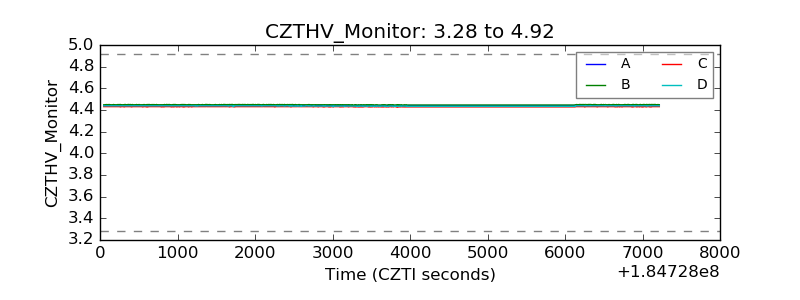 |
| D_VDD | 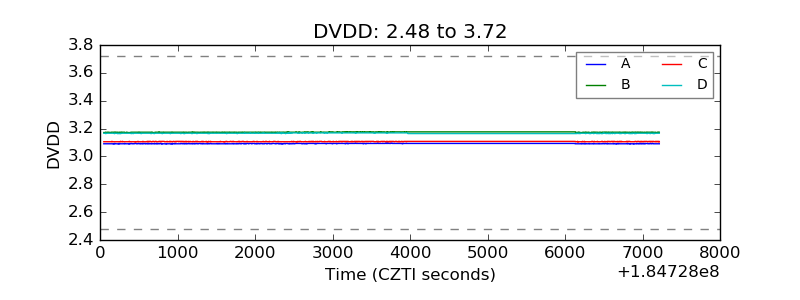 |
| Temperature 1 | 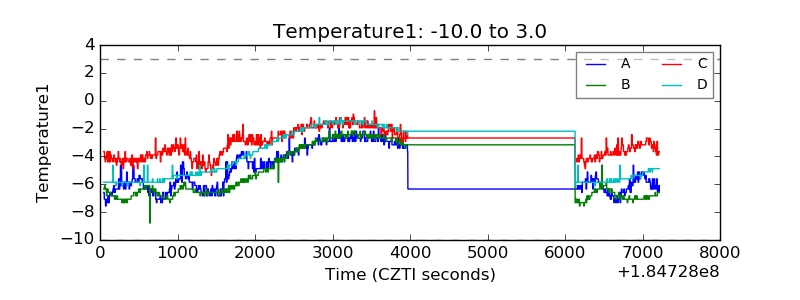 |
| Veto HV Monitor | 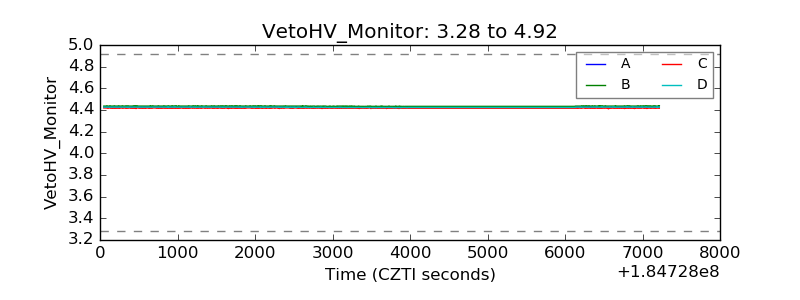 |
| Veto LLD | 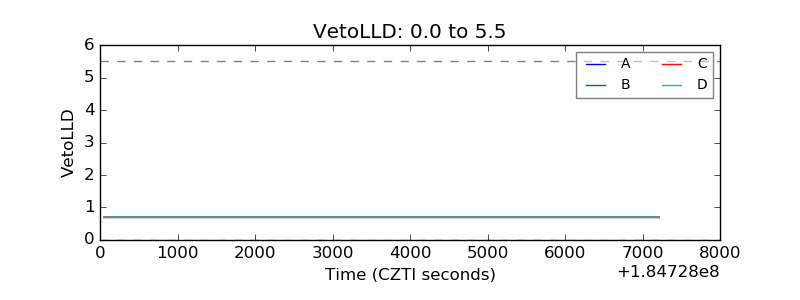 |
| Alpha Counter | 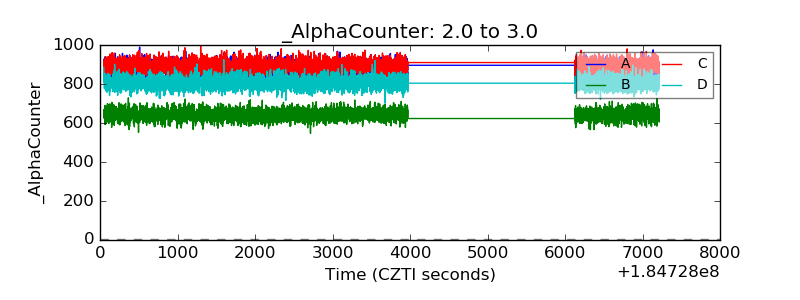 |
| _CPM_Rate | 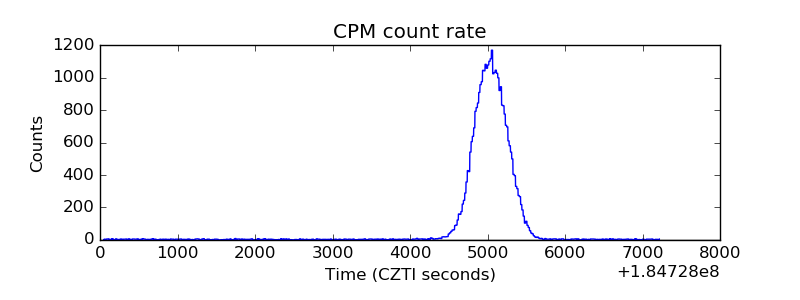 |
| CZT Counter | 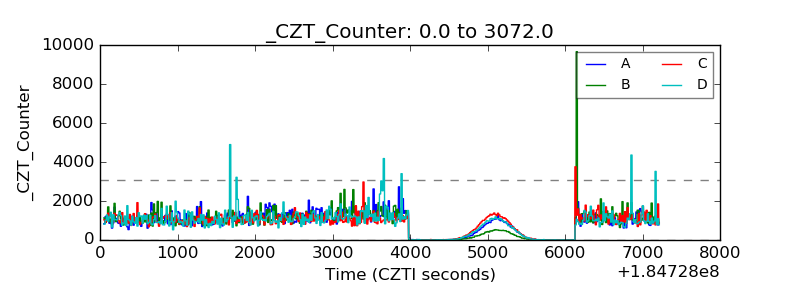 |
| +2.5 Volts monitor |  |
| +5 Volts monitor |  |
| _ROLL_ROT | 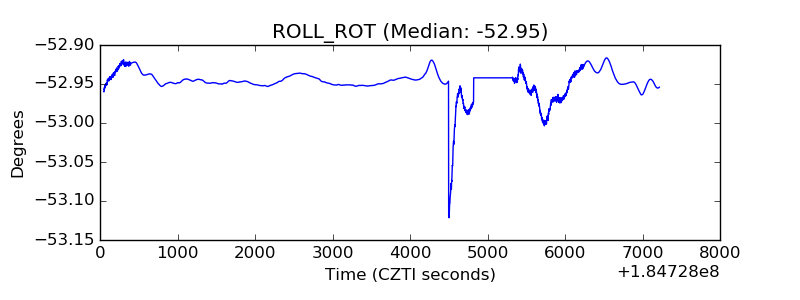 |
| _Roll_DEC | 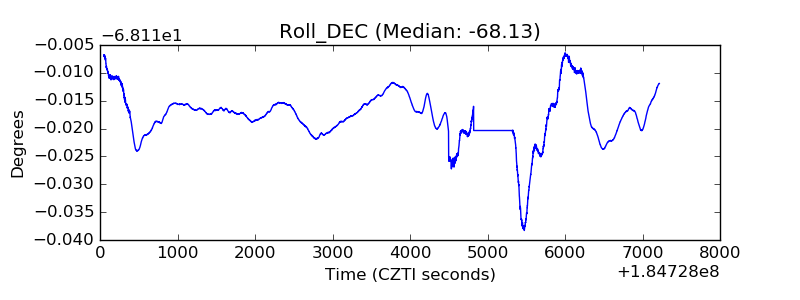 |
| _Roll_RA | 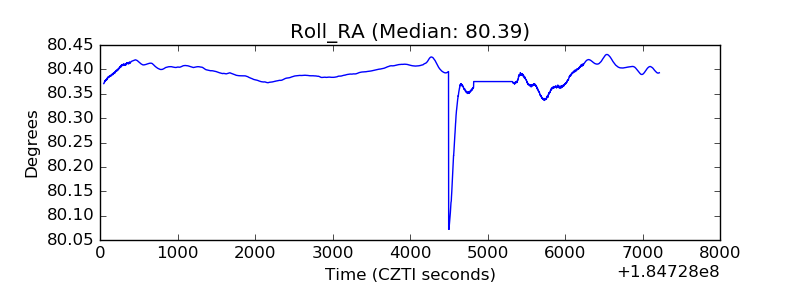 |
| Veto Counter | 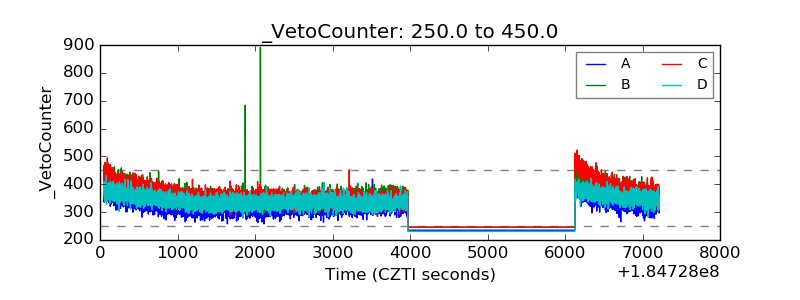 |