| Param | Original file | Final file |
|---|---|---|
| Filename | modeM0/AS1P01_116T01_9000000086_00630cztM0_level2.evt | modeM0/AS1P01_116T01_9000000086_00630cztM0_level2_quad_clean.evt |
| Size (bytes) | 2,186,674,560 | 177,960,960 |
| Size | 2.0 GB | 169.7 MB |
| Events in quadrant A | 15,582,268 | 1,146,138 |
| Events in quadrant B | 15,686,341 | 1,153,817 |
| Events in quadrant C | 14,142,432 | 1,149,997 |
| Events in quadrant D | 19,933,761 | 1,020,295 |
| Mode M0 | |||
|---|---|---|---|
| Quadrant | BADHDUFLAG | Total packets | Discarded packets |
| A | 0 | 55777 | 3 |
| B | 0 | 56054 | 3 |
| C | 0 | 51551 | 3 |
| D | 0 | 68902 | 4 |
| Mode M9 | |||
|---|---|---|---|
| Quadrant | BADHDUFLAG | Total packets | Discarded packets |
| A | 0 | 63 | 0 |
| B | 0 | 63 | 0 |
| C | 0 | 63 | 0 |
| D | 0 | 63 | 0 |
| Mode SS | |||
|---|---|---|---|
| Quadrant | BADHDUFLAG | Total packets | Discarded packets |
| A | 0 | 274 | 0 |
| B | 0 | 274 | 0 |
| C | 0 | 274 | 0 |
| D | 0 | 274 | 0 |
| Quadrant | Total seconds | Saturated seconds | Saturation percentage |
|---|---|---|---|
| A | 13298 | 11 | 0.082719% |
| B | 13298 | 25 | 0.187998% |
| C | 13299 | 43 | 0.323333% |
| D | 13298 | 1543 | 11.603249% |
Noise dominated data is calculated using 1-second bins in cleaned event files. If a bin has >2000 counts, and if more than 50% of those come from <1% of pixels, then it is considered to be noise-dominated and hence unusable.
| Quadrant | # 1 sec bins | Bins with >0 counts | Bins with >2000 counts | High rate bins dominated by noise | Noise dominated (total time) | Noise dominated (detector-on time) | Marked lightcurve |
|---|---|---|---|---|---|---|---|
| A | 19675 | 13301 | 273 | 273 | 1.39% | 2.05% | 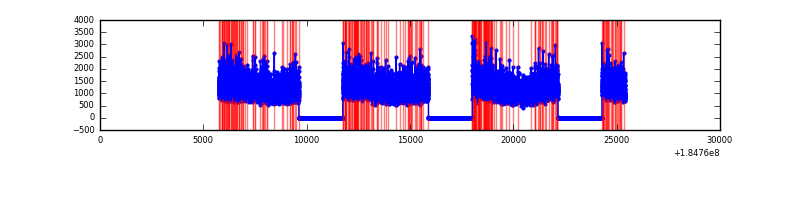 |
| B | 19675 | 13301 | 235 | 235 | 1.19% | 1.77% | 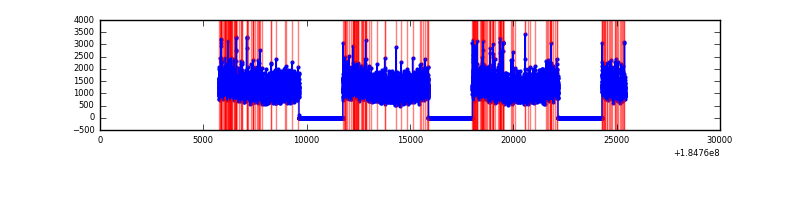 |
| C | 19676 | 13302 | 167 | 167 | 0.85% | 1.26% | 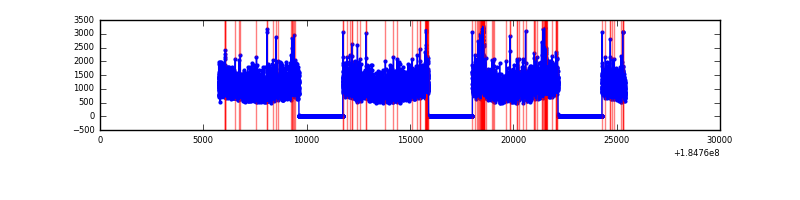 |
| D | 19675 | 13301 | 2718 | 2718 | 13.81% | 20.43% | 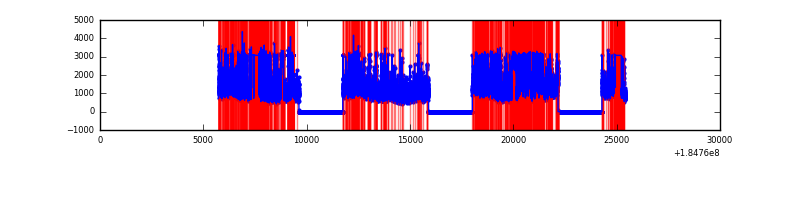 |
Top three noisy pixels from each quadrant. If the there are fewer than three noisy pixels in the level2.evt file, extra rows are filled as -1
| Pixel properties | Quadrant properties | ||||||
|---|---|---|---|---|---|---|---|
| Quadrant | DetID | PixID | Counts | Sigma | Mean | Median | Sigma |
| A | 0 | 238 | 101814 | 110.72 | 3946 | 3895 | 884.4 |
| A | 0 | 69 | 91030 | 98.53 | 3946 | 3895 | 884.4 |
| A | 13 | 160 | 36721 | 37.12 | 3946 | 3895 | 884.4 |
| B | 0 | 220 | 96781 | 98.4 | 3978 | 4002 | 942.8 |
| B | 5 | 249 | 84522 | 85.4 | 3978 | 4002 | 942.8 |
| B | 7 | 221 | 80545 | 81.18 | 3978 | 4002 | 942.8 |
| C | 9 | 52 | 316608 | 319.62 | 3500 | 3615 | 979.3 |
| C | 15 | 241 | 32543 | 29.54 | 3500 | 3615 | 979.3 |
| C | 9 | 54 | 24863 | 21.7 | 3500 | 3615 | 979.3 |
| D | 13 | 25 | 3429715 | 3411.27 | 3171 | 3297 | 1004.4 |
| D | 1 | 4 | 1247924 | 1239.12 | 3171 | 3297 | 1004.4 |
| D | 12 | 237 | 1165469 | 1157.03 | 3171 | 3297 | 1004.4 |
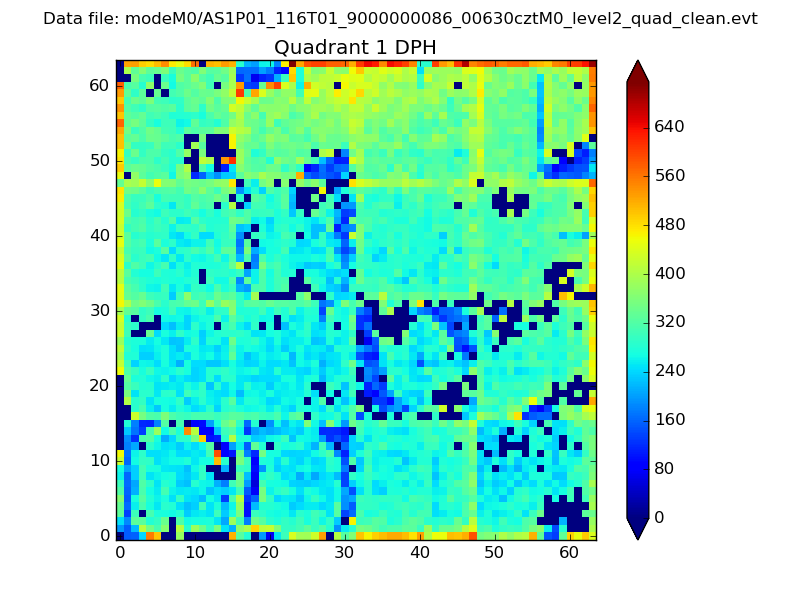
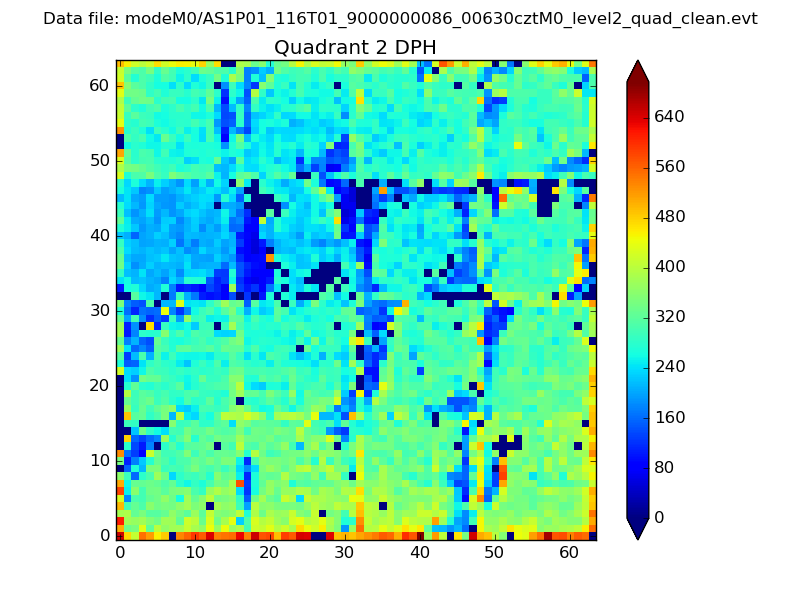
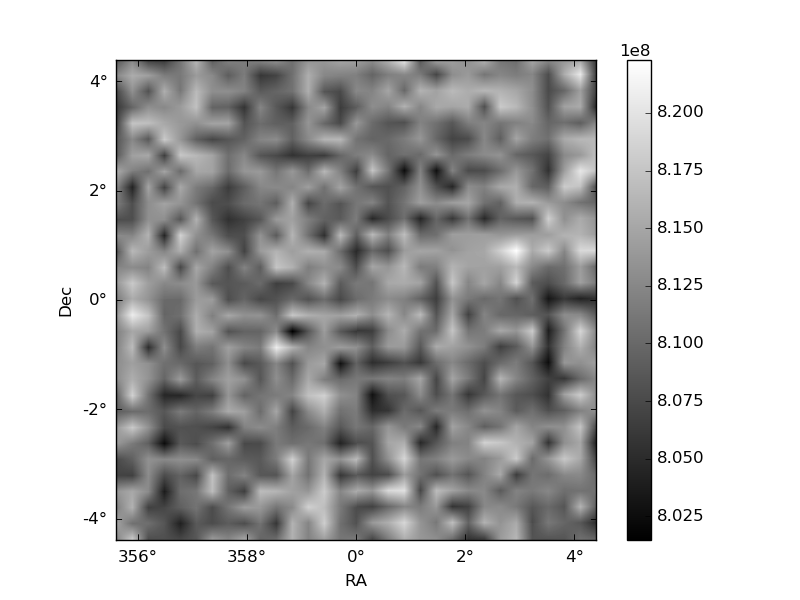
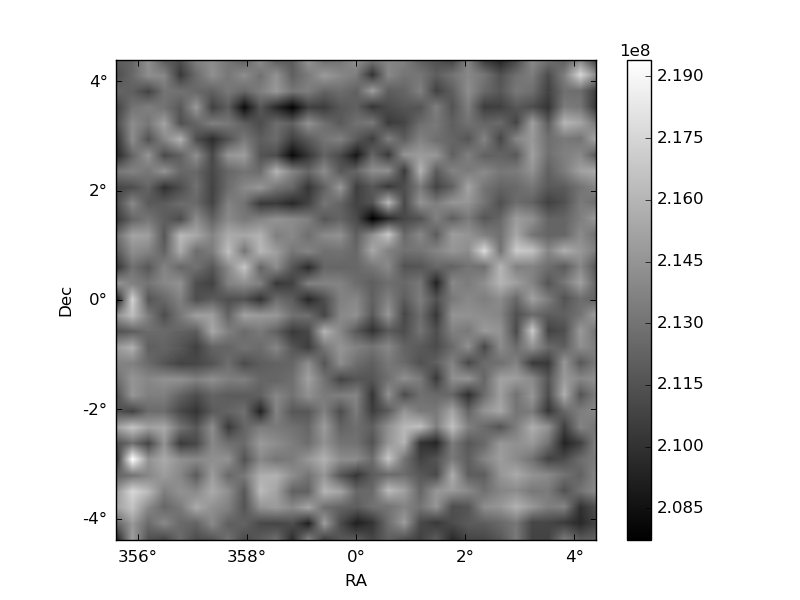
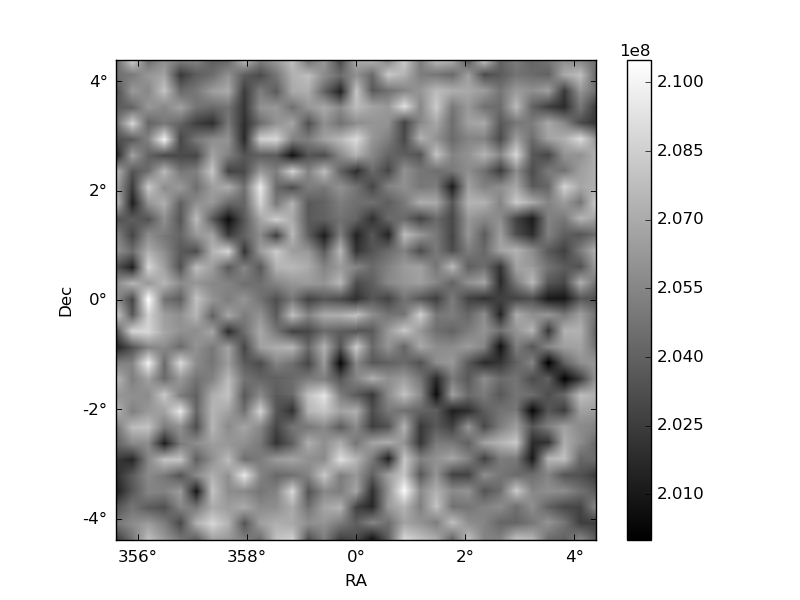
Histogram calculated using DETX and DETY for each event in the final _common_clean file
| Quadrant A |  |
 |
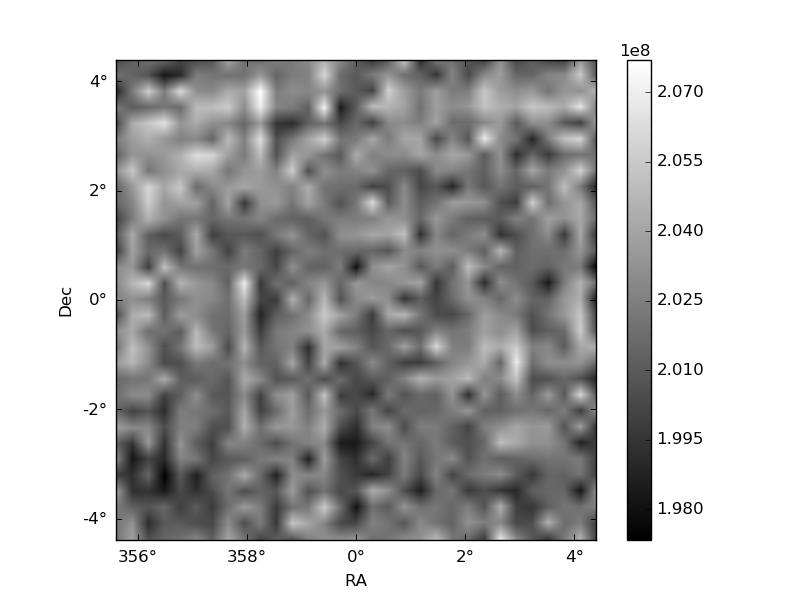
Quadrant B |
|---|---|---|---|
| Quadrant D | 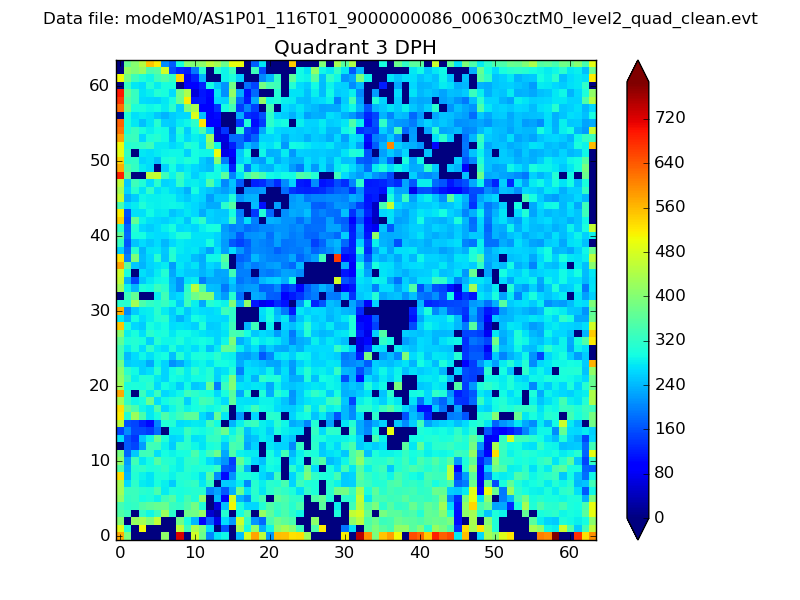 |
 |
Quadrant C |
| Plot type | Count rate plots | Images |
|---|---|---|
| Comparison with Poisson distribution Blue bars denote a histogram of data divided into 1 sec bins. Red curve is a Poisson curve with rate = median count rate of data. |
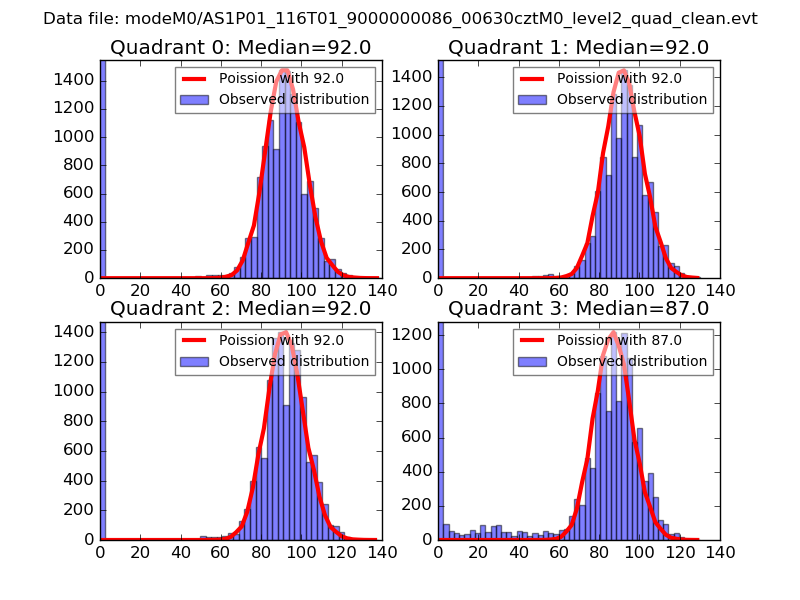 |
 |
| Quadrant-wise count rates Data is divided into 100 sec bins |
 |
|
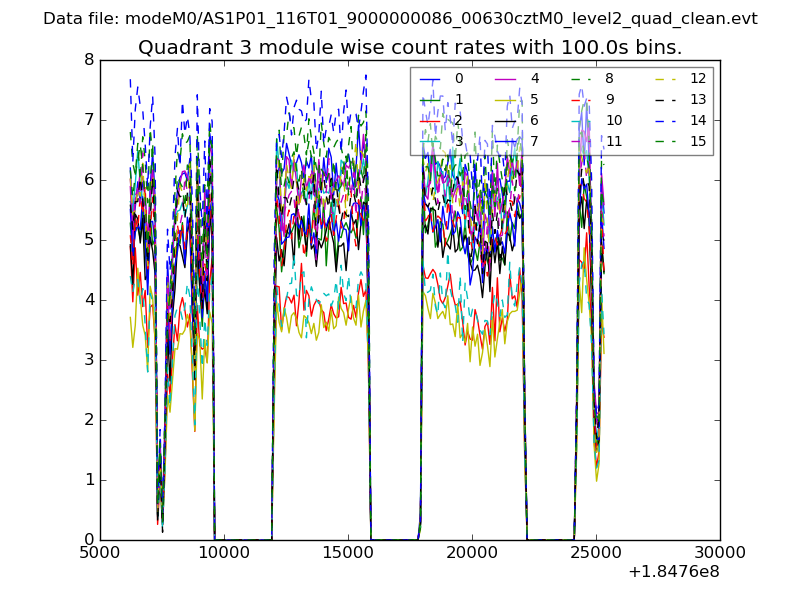
| Module-wise count rates for Quadrant A Data is divided into 100 sec bins |
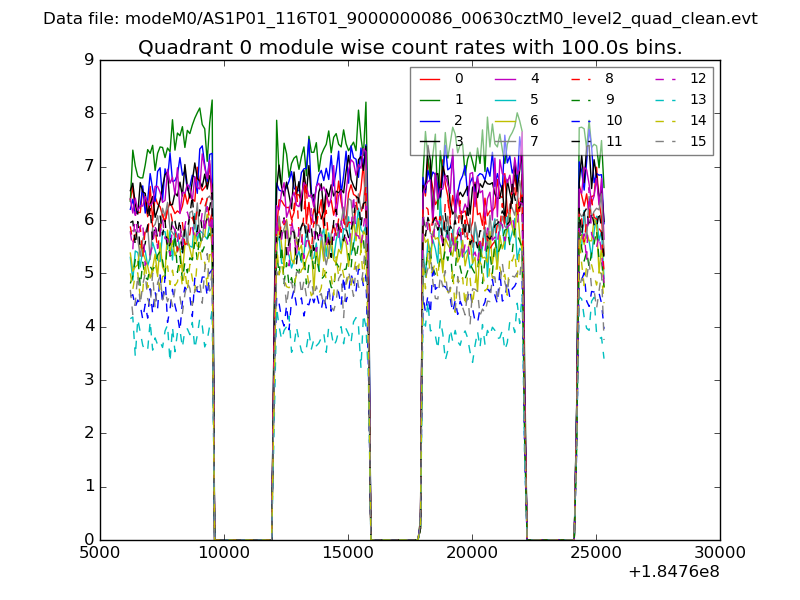 |
 |
| Module-wise count rates for Quadrant B Data is divided into 100 sec bins |
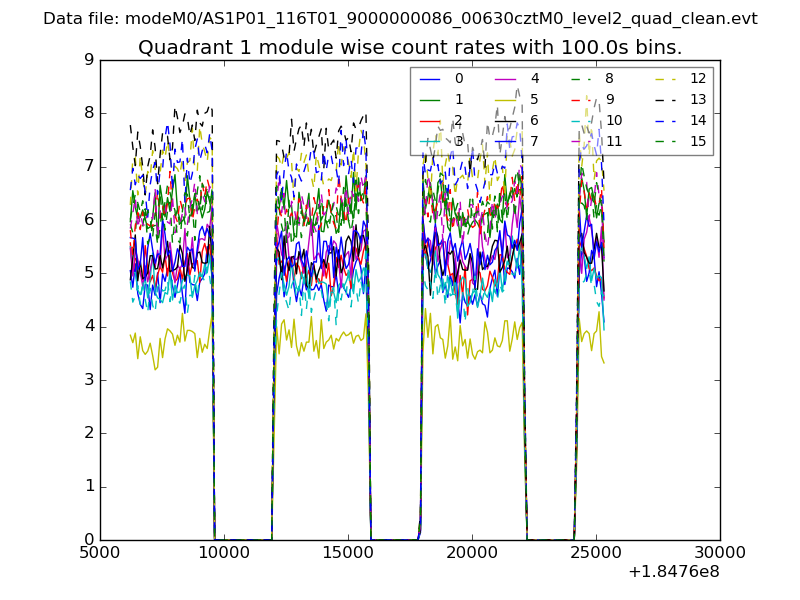 |
 |
| Module-wise count rates for Quadrant C Data is divided into 100 sec bins |
 |
 |
| Module-wise count rates for Quadrant D Data is divided into 100 sec bins |
 |
 |
| Parameter | Plot |
|---|---|
| CZT HV Monitor |  |
| D_VDD | 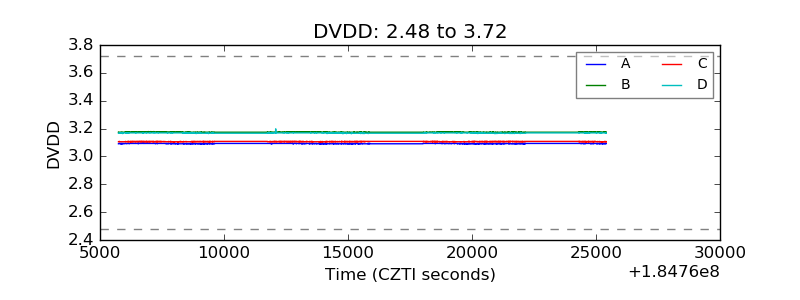 |
| Temperature 1 | 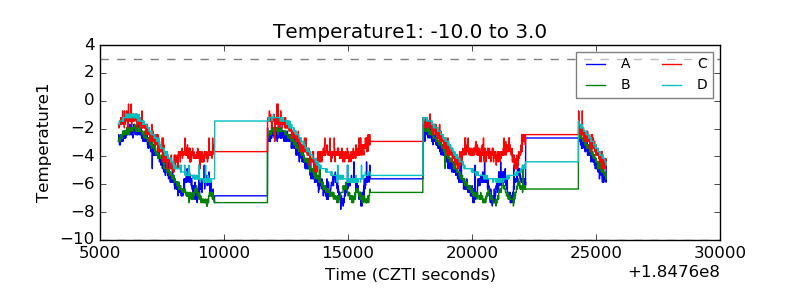 |
| Veto HV Monitor | 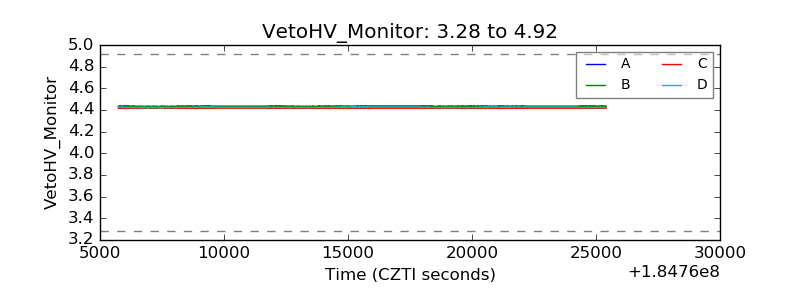 |
| Veto LLD | 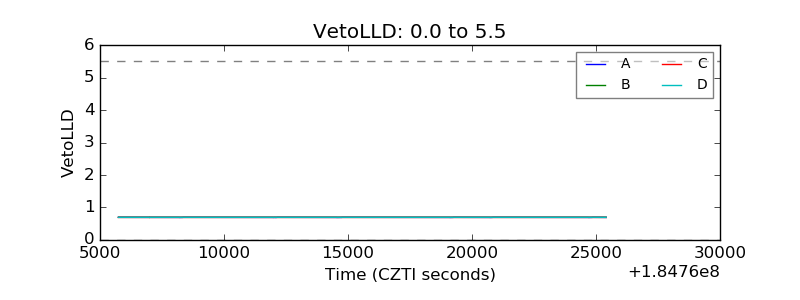 |
| Alpha Counter | 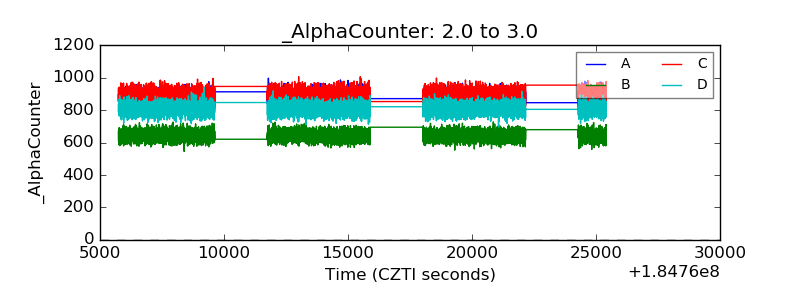 |
| _CPM_Rate | 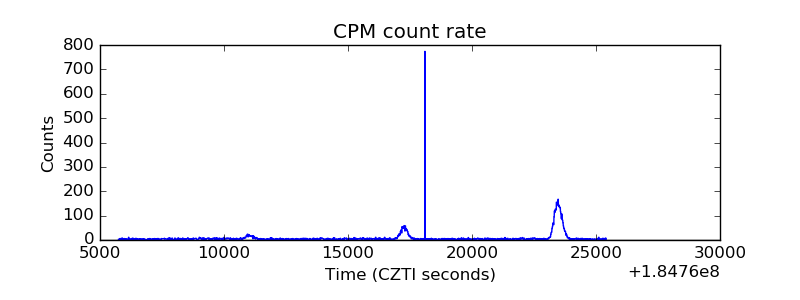 |
| CZT Counter | 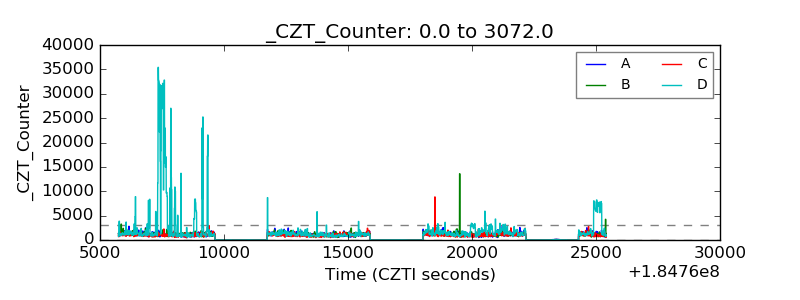 |
| +2.5 Volts monitor |  |
| +5 Volts monitor |  |
| _ROLL_ROT | 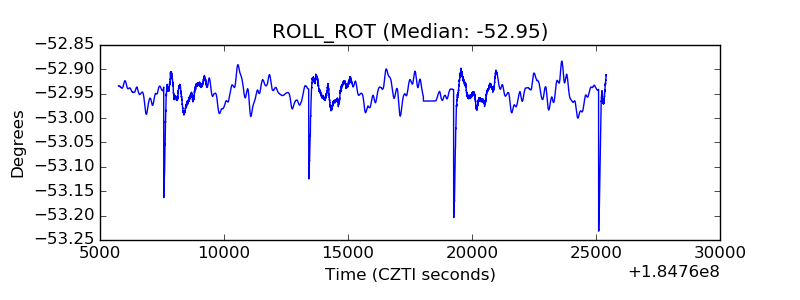 |
| _Roll_DEC | 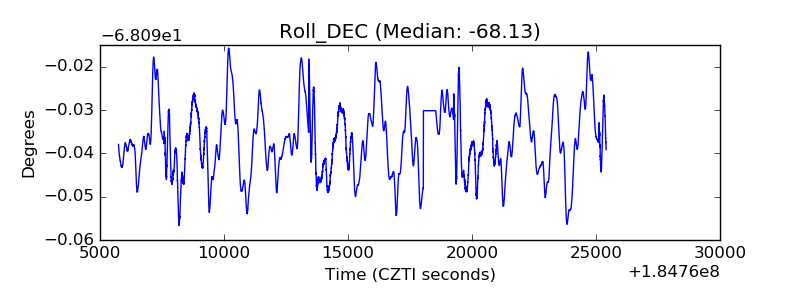 |
| _Roll_RA | 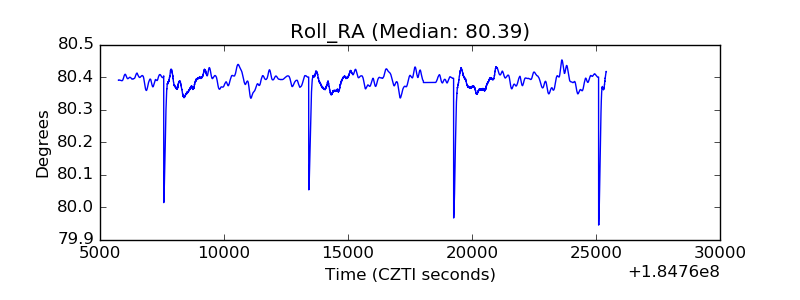 |
| Veto Counter |  |