| Param | Original file | Final file |
|---|---|---|
| Filename | modeM0/AS1P01_116T01_9000000086_00631cztM0_level2.evt | modeM0/AS1P01_116T01_9000000086_00631cztM0_level2_quad_clean.evt |
| Size (bytes) | 537,966,720 | 49,279,680 |
| Size | 513.0 MB | 47.0 MB |
| Events in quadrant A | 3,936,661 | 319,823 |
| Events in quadrant B | 3,927,747 | 322,975 |
| Events in quadrant C | 3,617,204 | 315,038 |
| Events in quadrant D | 4,576,583 | 286,524 |
| Mode M0 | |||
|---|---|---|---|
| Quadrant | BADHDUFLAG | Total packets | Discarded packets |
| A | 0 | 14154 | 1 |
| B | 0 | 14131 | 1 |
| C | 0 | 13231 | 1 |
| D | 0 | 16160 | 1 |
| Mode M9 | |||
|---|---|---|---|
| Quadrant | BADHDUFLAG | Total packets | Discarded packets |
| A | 0 | 2 | 0 |
| B | 0 | 2 | 0 |
| C | 0 | 2 | 0 |
| D | 0 | 2 | 0 |
| Mode SS | |||
|---|---|---|---|
| Quadrant | BADHDUFLAG | Total packets | Discarded packets |
| A | 0 | 70 | 0 |
| B | 0 | 70 | 0 |
| C | 0 | 70 | 0 |
| D | 0 | 70 | 0 |
| Quadrant | Total seconds | Saturated seconds | Saturation percentage |
|---|---|---|---|
| A | 3492 | 1 | 0.028637% |
| B | 3492 | 5 | 0.143184% |
| C | 3492 | 5 | 0.143184% |
| D | 3492 | 371 | 10.624284% |
Noise dominated data is calculated using 1-second bins in cleaned event files. If a bin has >2000 counts, and if more than 50% of those come from <1% of pixels, then it is considered to be noise-dominated and hence unusable.
| Quadrant | # 1 sec bins | Bins with >0 counts | Bins with >2000 counts | High rate bins dominated by noise | Noise dominated (total time) | Noise dominated (detector-on time) | Marked lightcurve |
|---|---|---|---|---|---|---|---|
| A | 3492 | 3492 | 55 | 55 | 1.58% | 1.58% | 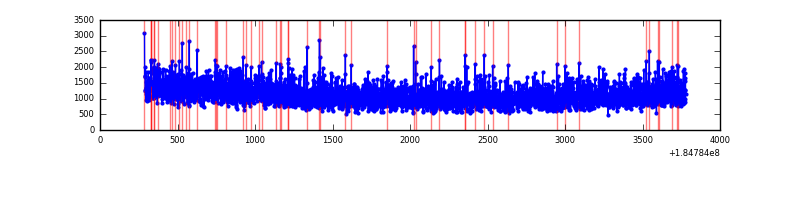 |
| B | 3492 | 3492 | 44 | 44 | 1.26% | 1.26% | 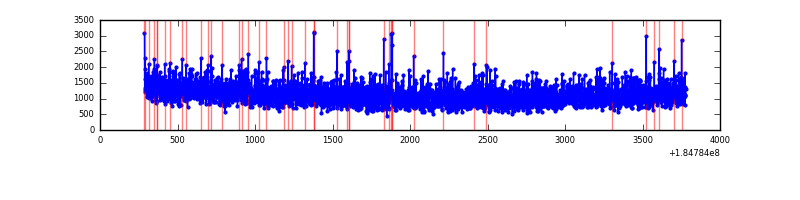 |
| C | 3492 | 3492 | 26 | 26 | 0.74% | 0.74% | 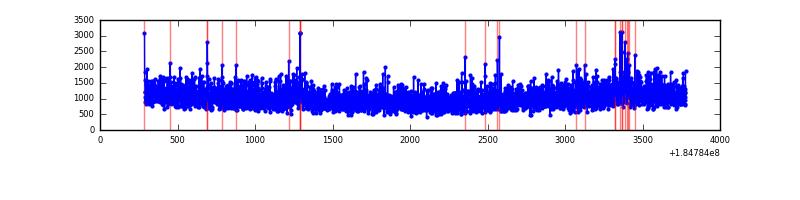 |
| D | 3492 | 3492 | 489 | 489 | 14.00% | 14.00% | 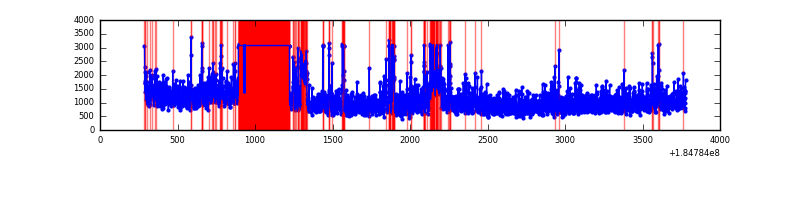 |
Top three noisy pixels from each quadrant. If the there are fewer than three noisy pixels in the level2.evt file, extra rows are filled as -1
| Pixel properties | Quadrant properties | ||||||
|---|---|---|---|---|---|---|---|
| Quadrant | DetID | PixID | Counts | Sigma | Mean | Median | Sigma |
| A | 0 | 238 | 34700 | 150.74 | 990 | 978 | 223.7 |
| A | 13 | 240 | 25056 | 107.63 | 990 | 978 | 223.7 |
| A | 13 | 160 | 21136 | 90.11 | 990 | 978 | 223.7 |
| B | 5 | 249 | 25835 | 102.83 | 1015 | 1021 | 241.3 |
| B | 4 | 250 | 6434 | 22.43 | 1015 | 1021 | 241.3 |
| B | 0 | 220 | 6210 | 21.5 | 1015 | 1021 | 241.3 |
| C | 9 | 52 | 72009 | 280.87 | 900 | 929 | 253.1 |
| C | 15 | 241 | 7072 | 24.27 | 900 | 929 | 253.1 |
| C | 9 | 83 | 5419 | 17.74 | 900 | 929 | 253.1 |
| D | 12 | 22 | 808991 | 3215.16 | 796 | 823 | 251.4 |
| D | 1 | 4 | 249428 | 989.03 | 796 | 823 | 251.4 |
| D | 12 | 237 | 131620 | 520.35 | 796 | 823 | 251.4 |
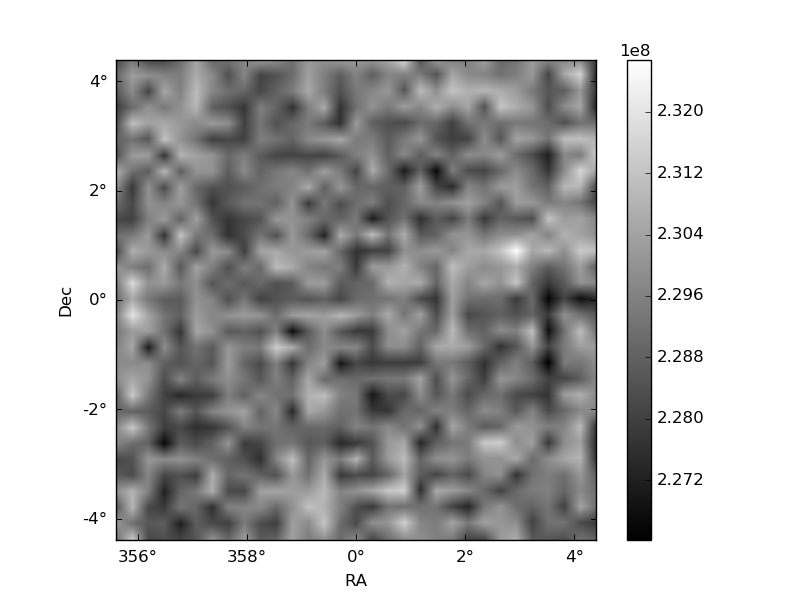
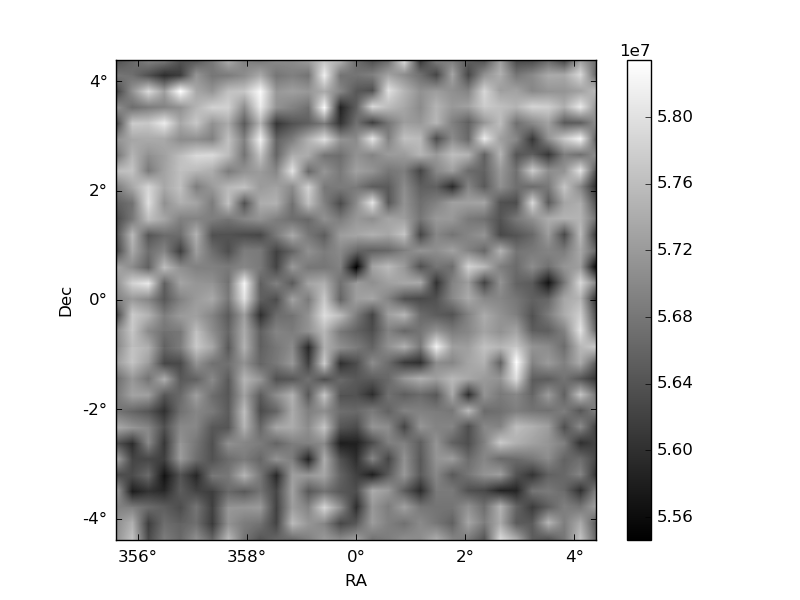
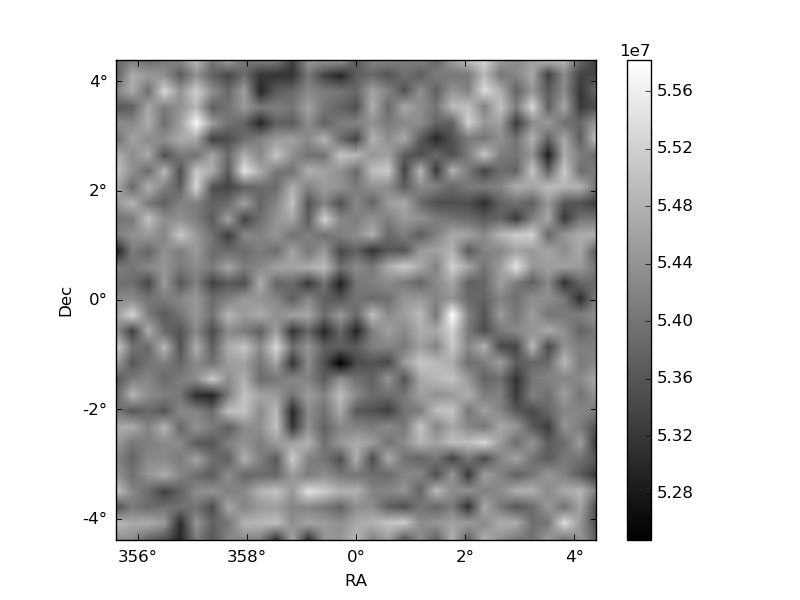
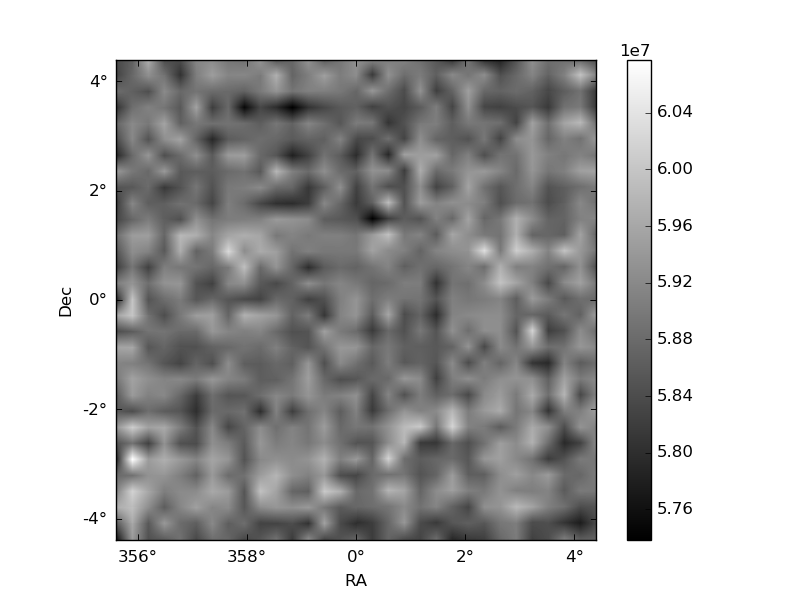
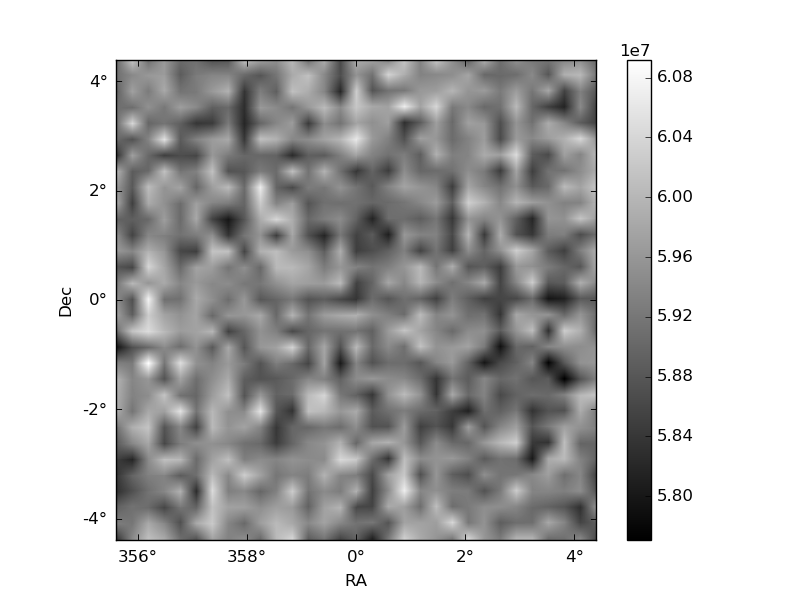
Histogram calculated using DETX and DETY for each event in the final _common_clean file
| Quadrant A | 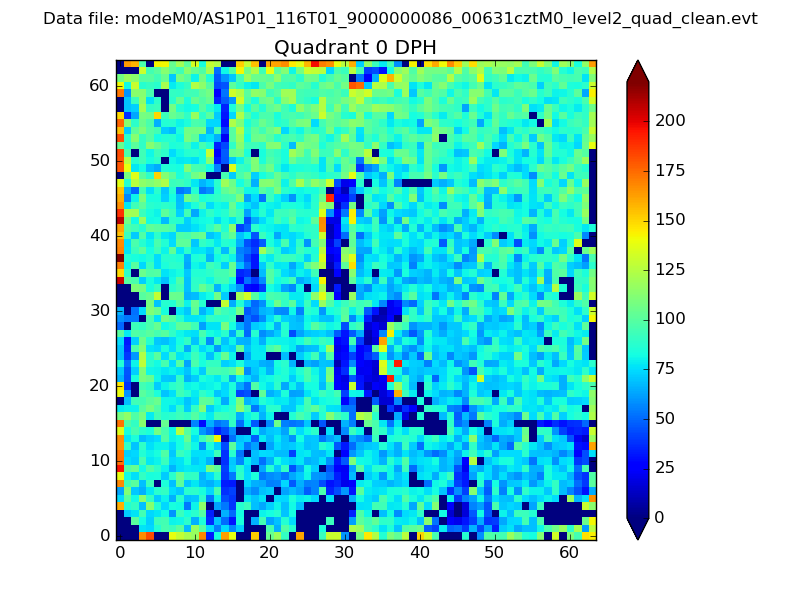 |
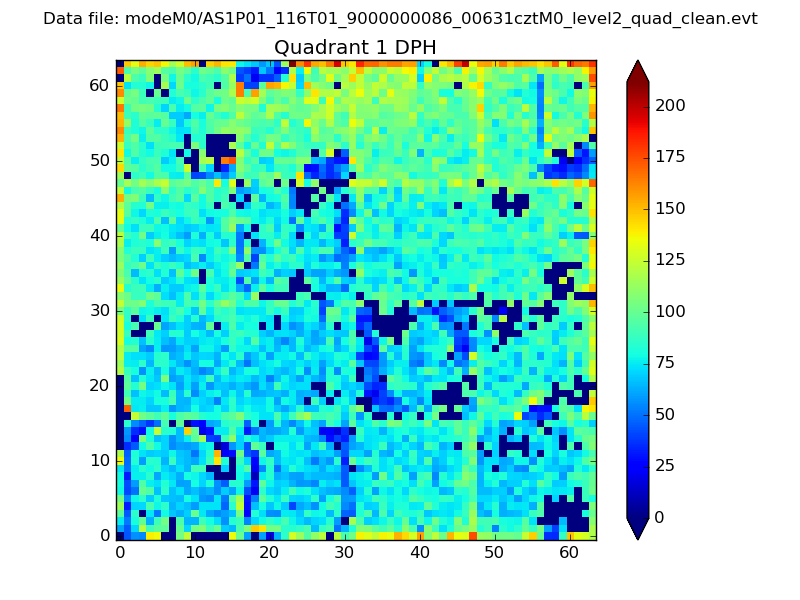 |
Quadrant B |
|---|---|---|---|
| Quadrant D | 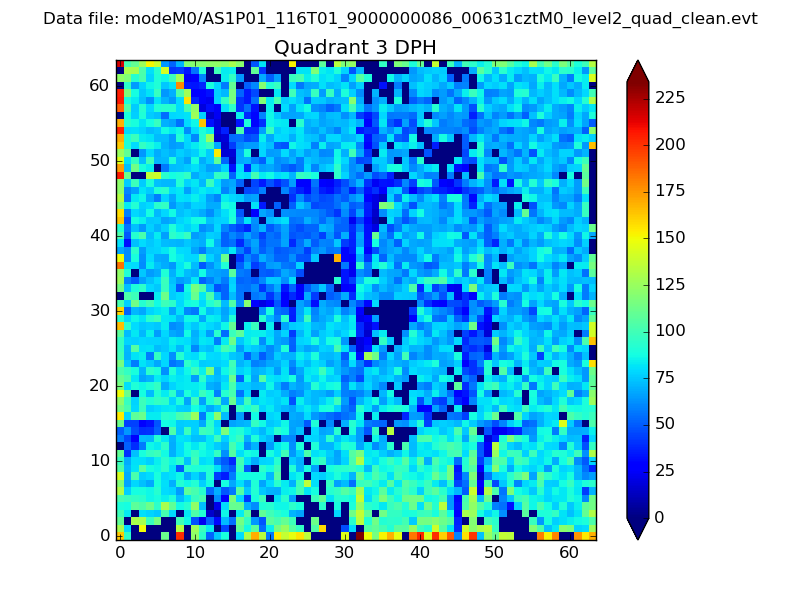 |
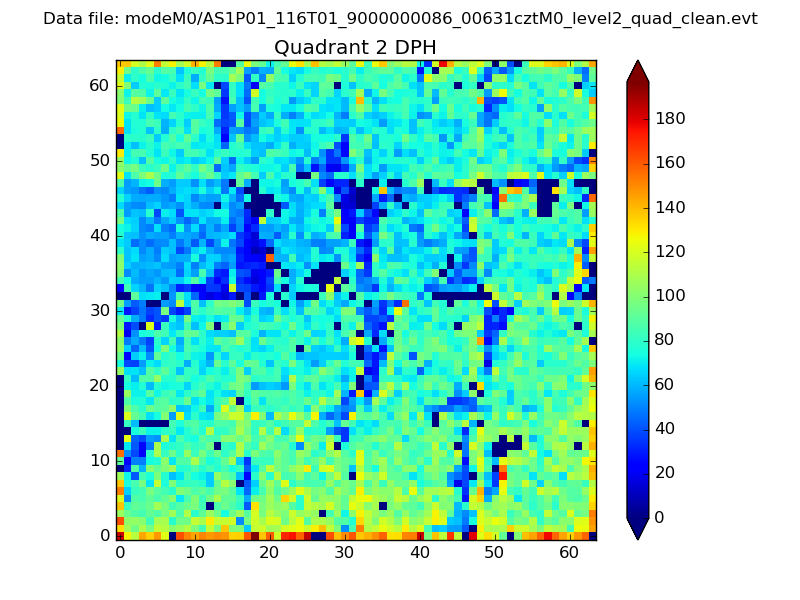 |
Quadrant C |
| Plot type | Count rate plots | Images |
|---|---|---|
| Comparison with Poisson distribution Blue bars denote a histogram of data divided into 1 sec bins. Red curve is a Poisson curve with rate = median count rate of data. |
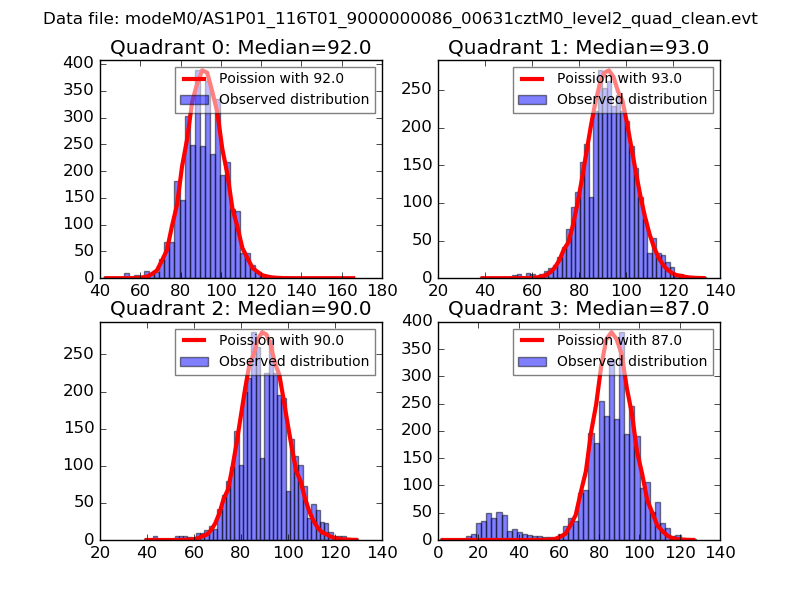 |
 |
| Quadrant-wise count rates Data is divided into 100 sec bins |
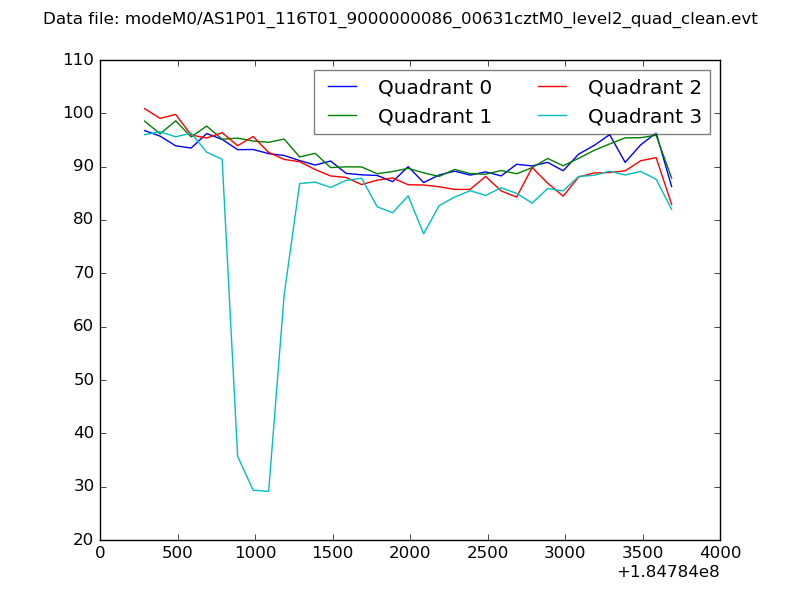 |
|
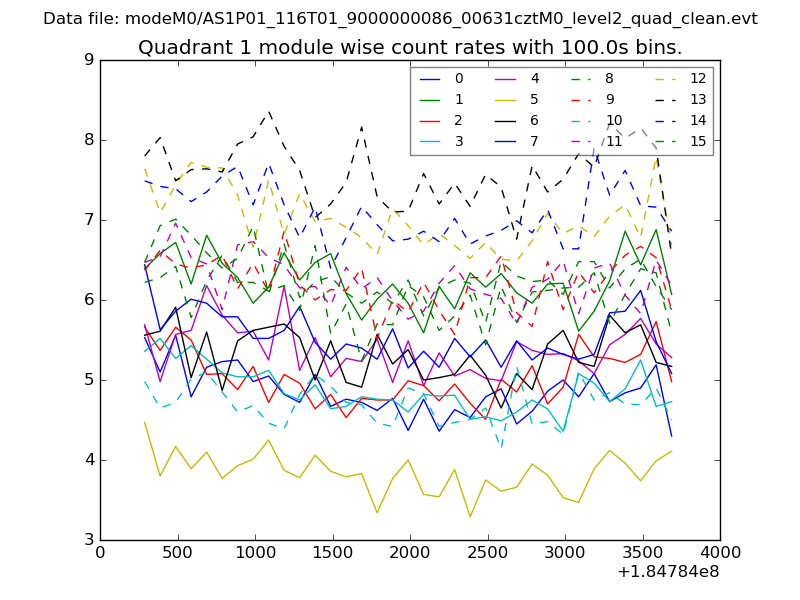
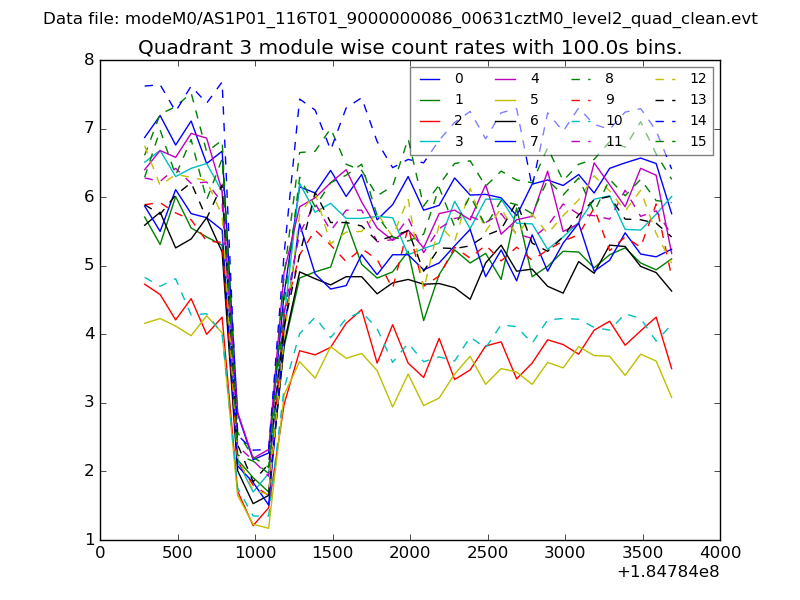
| Module-wise count rates for Quadrant A Data is divided into 100 sec bins |
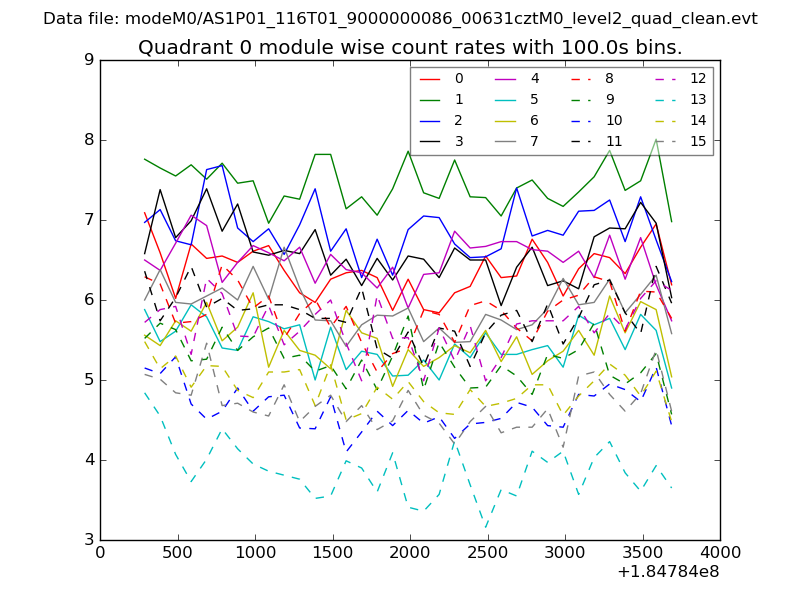 |
 |
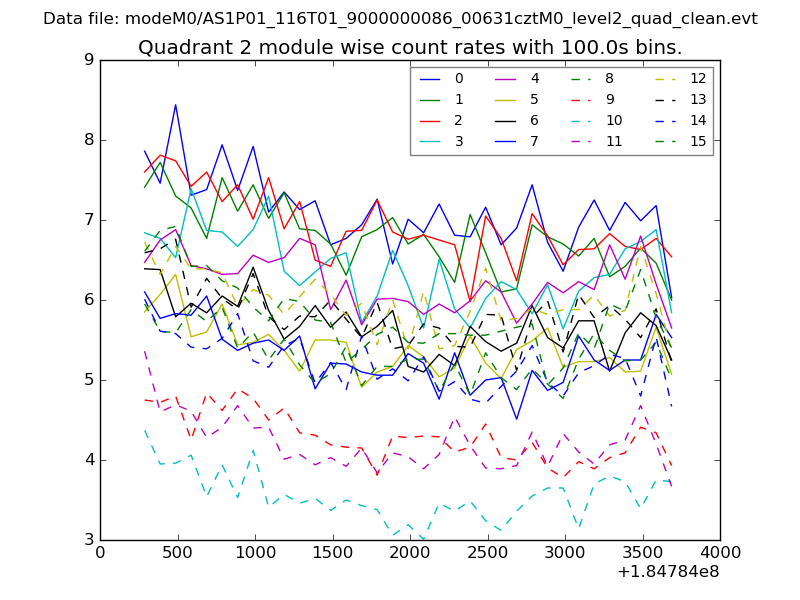
| Module-wise count rates for Quadrant B Data is divided into 100 sec bins |
 |
 |
| Module-wise count rates for Quadrant C Data is divided into 100 sec bins |
 |
 |
| Module-wise count rates for Quadrant D Data is divided into 100 sec bins |
 |
 |
| Parameter | Plot |
|---|---|
| CZT HV Monitor | 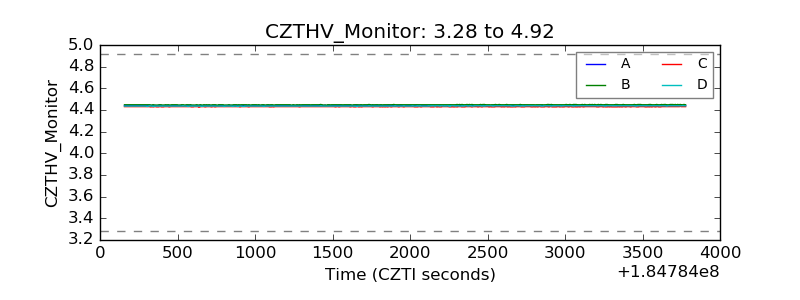 |
| D_VDD | 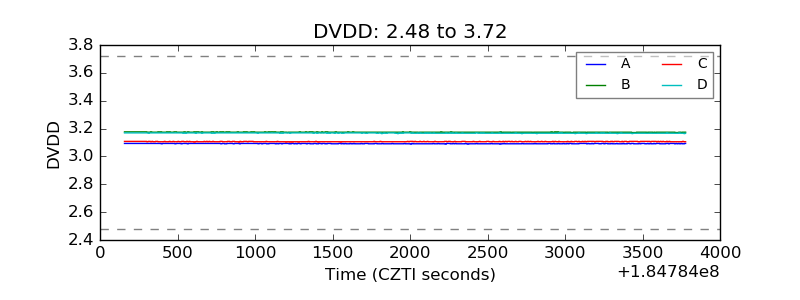 |
| Temperature 1 | 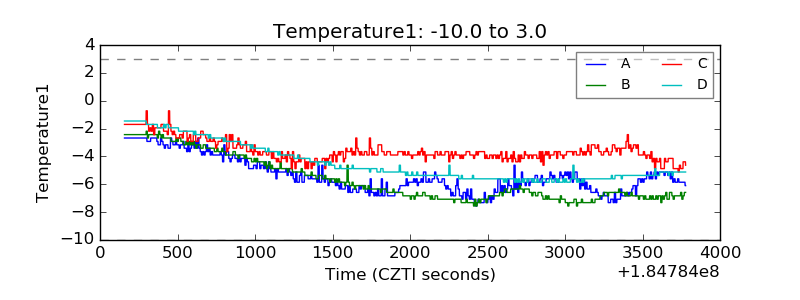 |
| Veto HV Monitor | 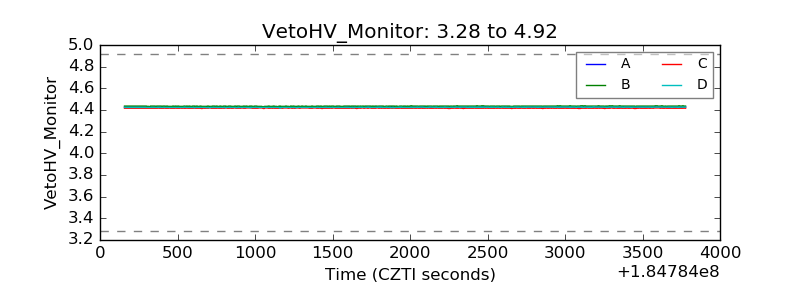 |
| Veto LLD | 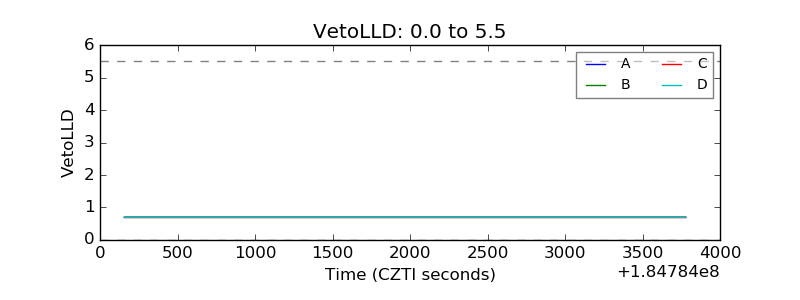 |
| Alpha Counter | 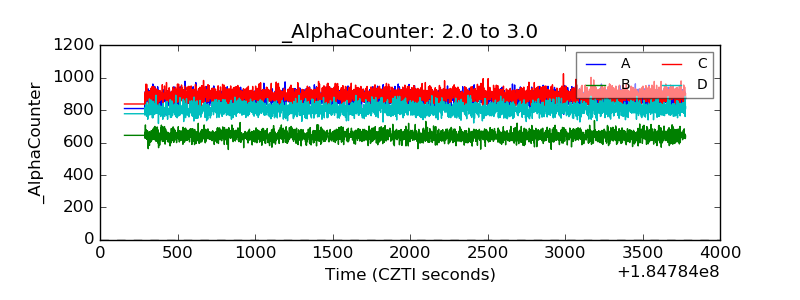 |
| _CPM_Rate | 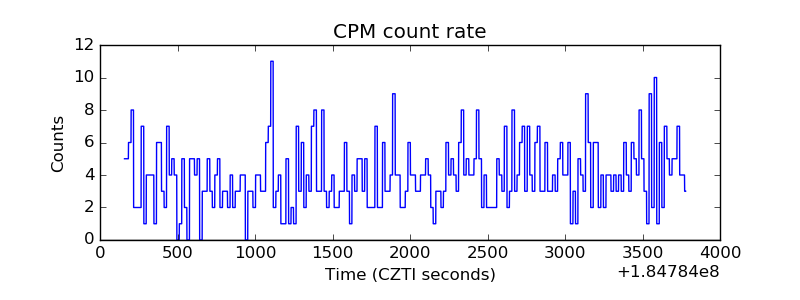 |
| CZT Counter |  |
| +2.5 Volts monitor |  |
| +5 Volts monitor | 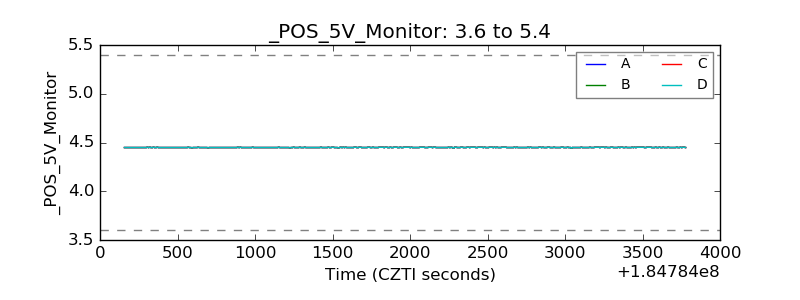 |
| _ROLL_ROT | 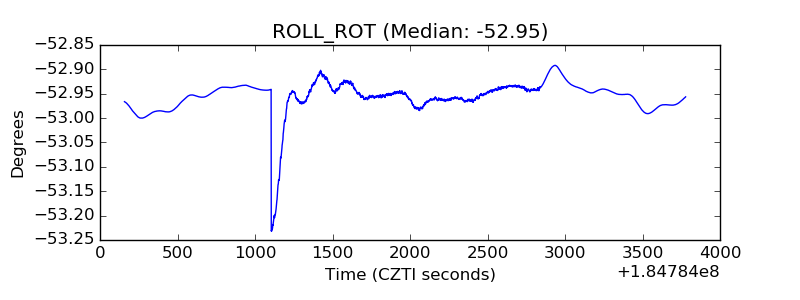 |
| _Roll_DEC | 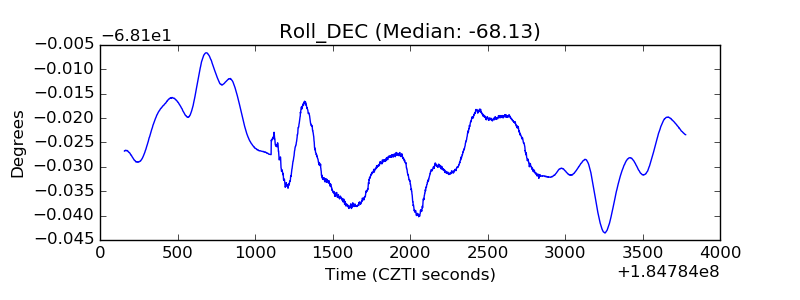 |
| _Roll_RA | 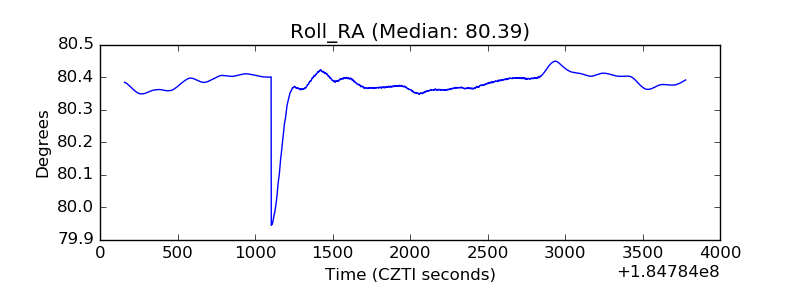 |
| Veto Counter | 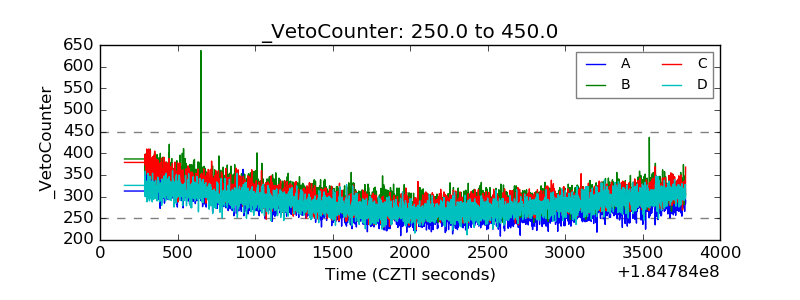 |