| Param | Original file | Final file |
|---|---|---|
| Filename | modeM0/AS1P01_126T03_9000000088cztM0_level2.fits | modeM0/AS1P01_126T03_9000000088cztM0_level2_quad_clean.evt |
| Size (bytes) | 237,882,240 | 263,119,680 |
| Size | 226.9 MB | 250.9 MB |
| Events in quadrant A | 1,353,046 | 1,537,921 |
| Events in quadrant B | 1,362,772 | 1,587,428 |
| Events in quadrant C | 1,346,676 | 1,490,001 |
| Events in quadrant D | 1,142,760 | 1,353,961 |
| Mode SS | |||
|---|---|---|---|
| Quadrant | BADHDUFLAG | Total packets | Discarded packets |
| A | 0 | 594 | 0 |
| B | 0 | 594 | 0 |
| C | 0 | 594 | 0 |
| D | 0 | 594 | 0 |
| Mode M9 | |||
|---|---|---|---|
| Quadrant | BADHDUFLAG | Total packets | Discarded packets |
| A | 0 | 168 | 0 |
| B | 0 | 168 | 0 |
| C | 0 | 168 | 0 |
| D | 0 | 168 | 0 |
| Mode M0 | |||
|---|---|---|---|
| Quadrant | BADHDUFLAG | Total packets | Discarded packets |
| A | 0 | 125212 | 0 |
| B | 0 | 120465 | 0 |
| C | 0 | 113604 | 0 |
| D | 0 | 121835 | 0 |
| Quadrant | Total seconds | Saturated seconds | Saturation percentage |
|---|---|---|---|
| A | 29081 | 180 | 0.618961% |
| B | 29081 | 33 | 0.113476% |
| C | 29081 | 130 | 0.447027% |
| D | 29081 | 534 | 1.836250% |
Noise dominated data is calculated using 1-second bins in cleaned event files. If a bin has >2000 counts, and if more than 50% of those come from <1% of pixels, then it is considered to be noise-dominated and hence unusable.
| Quadrant | # 1 sec bins | Bins with >0 counts | Bins with >2000 counts | High rate bins dominated by noise | Noise dominated (total time) | Noise dominated (detector-on time) | Marked lightcurve |
|---|---|---|---|---|---|---|---|
| A | 44020 | 29074 | 0 | 0 | 0.00% | 0.00% |  |
| B | 44020 | 29072 | 0 | 0 | 0.00% | 0.00% |  |
| C | 44020 | 29065 | 0 | 0 | 0.00% | 0.00% |  |
| D | 44020 | 29071 | 0 | 0 | 0.00% | 0.00% |  |
Top three noisy pixels from each quadrant. If the there are fewer than three noisy pixels in the level2.evt file, extra rows are filled as -1
| Pixel properties | Quadrant properties | ||||||
|---|---|---|---|---|---|---|---|
| Quadrant | DetID | PixID | Counts | Sigma | Mean | Median | Sigma |
| A | 0 | 29 | 1258 | 11.01 | 351 | 329 | 84.3 |
| A | 7 | 110 | 1227 | 10.65 | 351 | 329 | 84.3 |
| A | 14 | 30 | 978 | 7.69 | 351 | 329 | 84.3 |
| B | 2 | 9 | 1182 | 13.14 | 359 | 343 | 63.9 |
| B | 14 | 254 | 913 | 8.93 | 359 | 343 | 63.9 |
| B | 5 | 225 | 852 | 7.97 | 359 | 343 | 63.9 |
| C | 12 | 241 | 919 | 6.63 | 356 | 331 | 88.7 |
| C | 1 | 81 | 916 | 6.6 | 356 | 331 | 88.7 |
| C | 2 | 191 | 913 | 6.57 | 356 | 331 | 88.7 |
| D | 6 | 231 | 897 | 7.48 | 326 | 298 | 80.1 |
| D | 11 | 82 | 856 | 6.97 | 326 | 298 | 80.1 |
| D | 6 | 44 | 836 | 6.72 | 326 | 298 | 80.1 |
Histogram calculated using DETX and DETY for each event in the final _common_clean file
| Quadrant A | 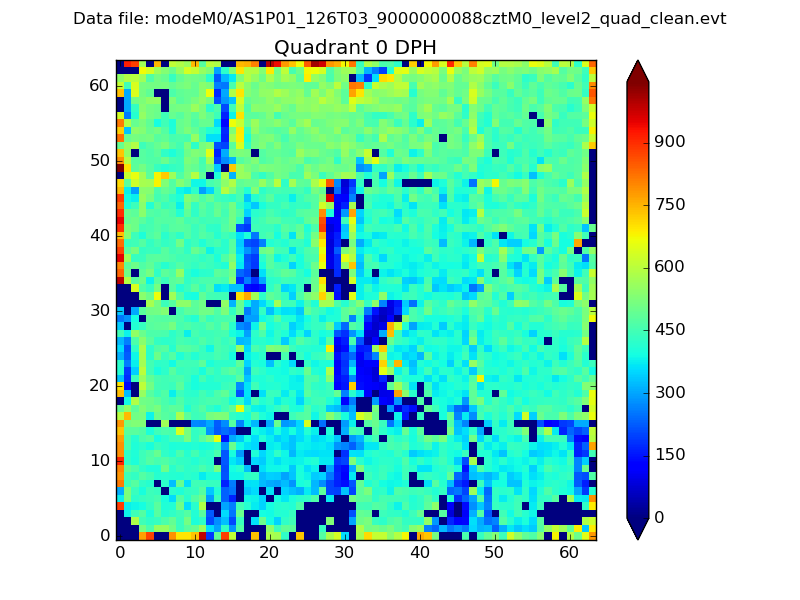 |
 |
Quadrant B |
|---|---|---|---|
| Quadrant D |  |
 |
Quadrant C |
| Plot type | Count rate plots | Images |
|---|---|---|
| Comparison with Poisson distribution Blue bars denote a histogram of data divided into 1 sec bins. Red curve is a Poisson curve with rate = median count rate of data. |
 |
 |
| Quadrant-wise count rates Data is divided into 100 sec bins |
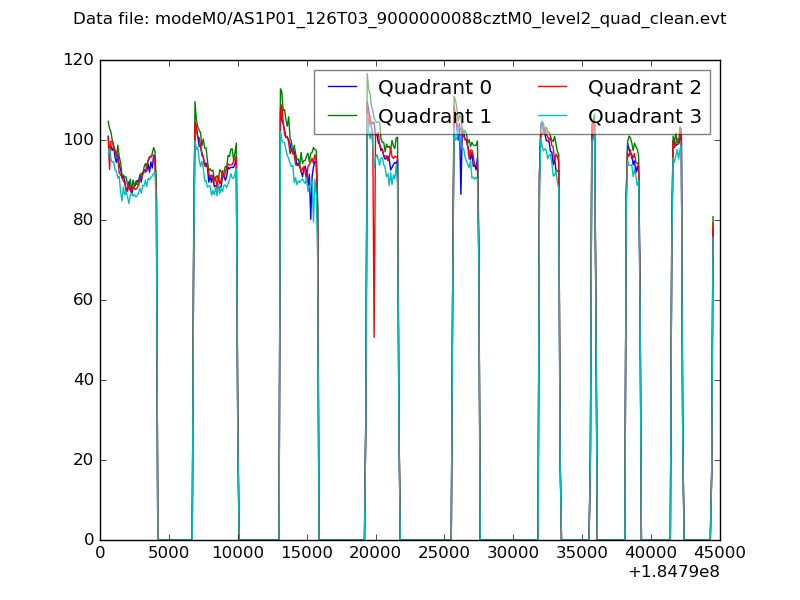 |
|
| Module-wise count rates for Quadrant A Data is divided into 100 sec bins |
 |
 |
| Module-wise count rates for Quadrant B Data is divided into 100 sec bins |
 |
 |
| Module-wise count rates for Quadrant C Data is divided into 100 sec bins |
 |
 |
| Module-wise count rates for Quadrant D Data is divided into 100 sec bins |
 |
 |
| Parameter | Plot |
|---|---|
| CZT HV Monitor |  |
| D_VDD | 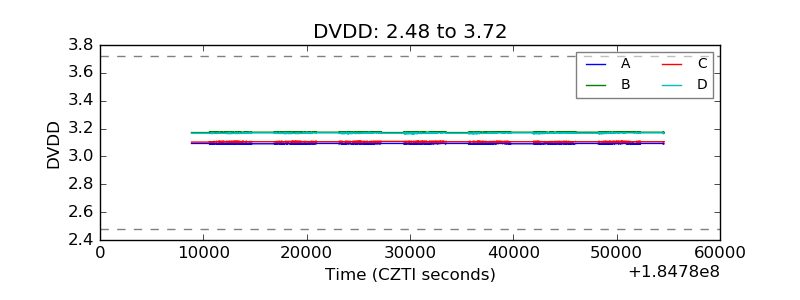 |
| Temperature 1 |  |
| Veto HV Monitor |  |
| Veto LLD |  |
| Alpha Counter |  |
| _CPM_Rate |  |
| CZT Counter | 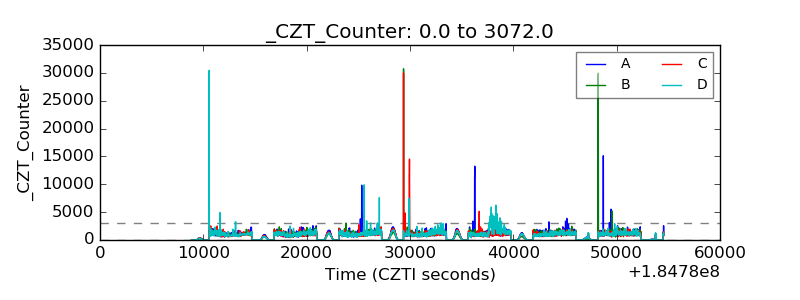 |
| +2.5 Volts monitor |  |
| +5 Volts monitor |  |
| _ROLL_ROT |  |
| _Roll_DEC |  |
| _Roll_RA |  |
| Veto Counter |  |