| Param | Original file | Final file |
|---|---|---|
| Filename | modeM0/AS1P01_126T03_9000000088_00632cztM0_level2.evt | modeM0/AS1P01_126T03_9000000088_00632cztM0_level2_quad_clean.evt |
| Size (bytes) | 759,928,320 | 68,382,720 |
| Size | 724.7 MB | 65.2 MB |
| Events in quadrant A | 5,792,643 | 429,775 |
| Events in quadrant B | 5,835,081 | 439,233 |
| Events in quadrant C | 5,457,021 | 428,723 |
| Events in quadrant D | 5,588,429 | 414,255 |
| Mode SS | |||
|---|---|---|---|
| Quadrant | BADHDUFLAG | Total packets | Discarded packets |
| A | 0 | 104 | 0 |
| B | 0 | 104 | 0 |
| C | 0 | 104 | 0 |
| D | 0 | 104 | 0 |
| Mode M9 | |||
|---|---|---|---|
| Quadrant | BADHDUFLAG | Total packets | Discarded packets |
| A | 0 | 39 | 0 |
| B | 0 | 39 | 0 |
| C | 0 | 39 | 0 |
| D | 0 | 39 | 0 |
| Mode M0 | |||
|---|---|---|---|
| Quadrant | BADHDUFLAG | Total packets | Discarded packets |
| A | 0 | 20842 | 2 |
| B | 0 | 20984 | 2 |
| C | 0 | 19905 | 2 |
| D | 0 | 20222 | 2 |
| Quadrant | Total seconds | Saturated seconds | Saturation percentage |
|---|---|---|---|
| A | 5118 | 8 | 0.156311% |
| B | 5118 | 5 | 0.097694% |
| C | 5118 | 18 | 0.351700% |
| D | 5118 | 17 | 0.332161% |
Noise dominated data is calculated using 1-second bins in cleaned event files. If a bin has >2000 counts, and if more than 50% of those come from <1% of pixels, then it is considered to be noise-dominated and hence unusable.
| Quadrant | # 1 sec bins | Bins with >0 counts | Bins with >2000 counts | High rate bins dominated by noise | Noise dominated (total time) | Noise dominated (detector-on time) | Marked lightcurve |
|---|---|---|---|---|---|---|---|
| A | 7244 | 5119 | 88 | 88 | 1.21% | 1.72% | 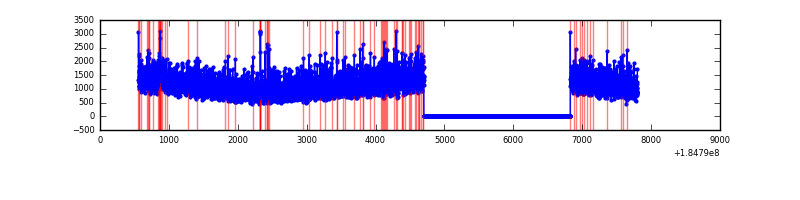 |
| B | 7243 | 5118 | 72 | 72 | 0.99% | 1.41% | 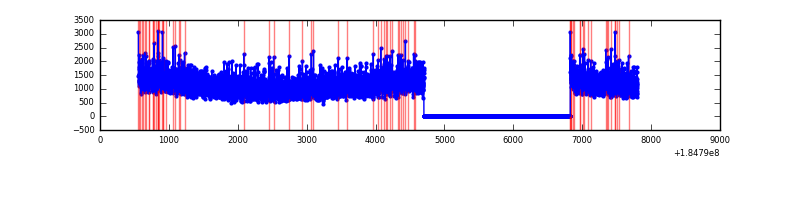 |
| C | 7243 | 5118 | 60 | 60 | 0.83% | 1.17% | 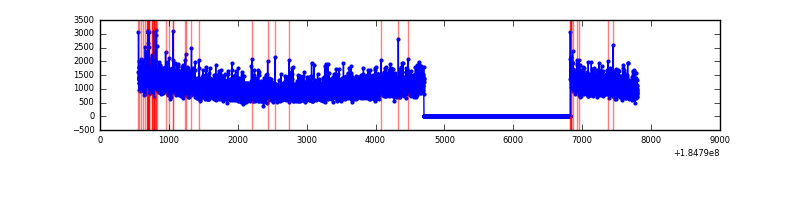 |
| D | 7244 | 5119 | 69 | 69 | 0.95% | 1.35% | 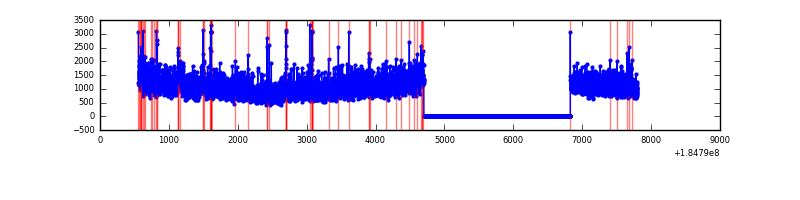 |
Top three noisy pixels from each quadrant. If the there are fewer than three noisy pixels in the level2.evt file, extra rows are filled as -1
| Pixel properties | Quadrant properties | ||||||
|---|---|---|---|---|---|---|---|
| Quadrant | DetID | PixID | Counts | Sigma | Mean | Median | Sigma |
| A | 13 | 240 | 50926 | 152.08 | 1473 | 1463 | 325.3 |
| A | 0 | 238 | 23233 | 66.93 | 1473 | 1463 | 325.3 |
| A | 13 | 190 | 13549 | 37.16 | 1473 | 1463 | 325.3 |
| B | 5 | 191 | 38015 | 103.03 | 1504 | 1516 | 354.2 |
| B | 4 | 185 | 20371 | 53.23 | 1504 | 1516 | 354.2 |
| B | 8 | 4 | 9939 | 23.78 | 1504 | 1516 | 354.2 |
| C | 3 | 159 | 78870 | 204.61 | 1354 | 1405 | 378.6 |
| C | 9 | 52 | 31256 | 78.85 | 1354 | 1405 | 378.6 |
| C | 8 | 208 | 10378 | 23.7 | 1354 | 1405 | 378.6 |
| D | 13 | 216 | 285104 | 691.14 | 1286 | 1341 | 410.6 |
| D | 1 | 4 | 230810 | 558.9 | 1286 | 1341 | 410.6 |
| D | 12 | 237 | 55243 | 131.28 | 1286 | 1341 | 410.6 |
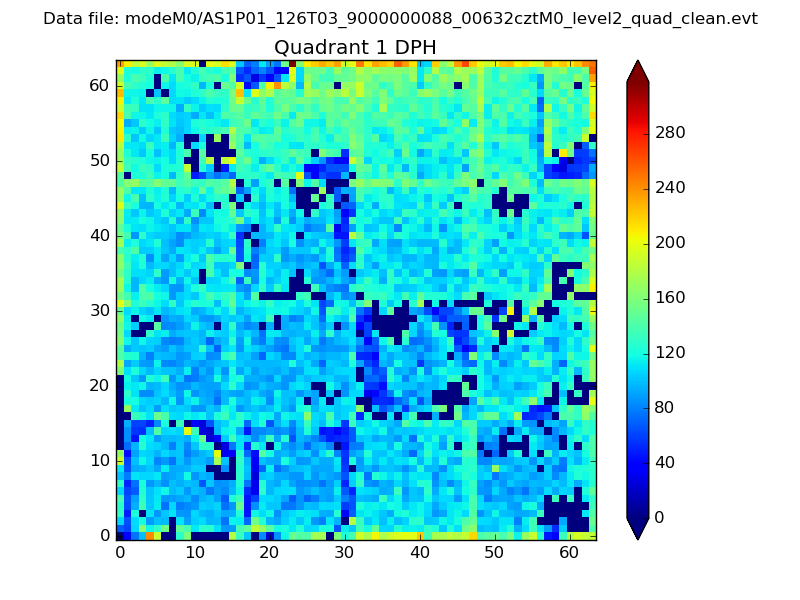
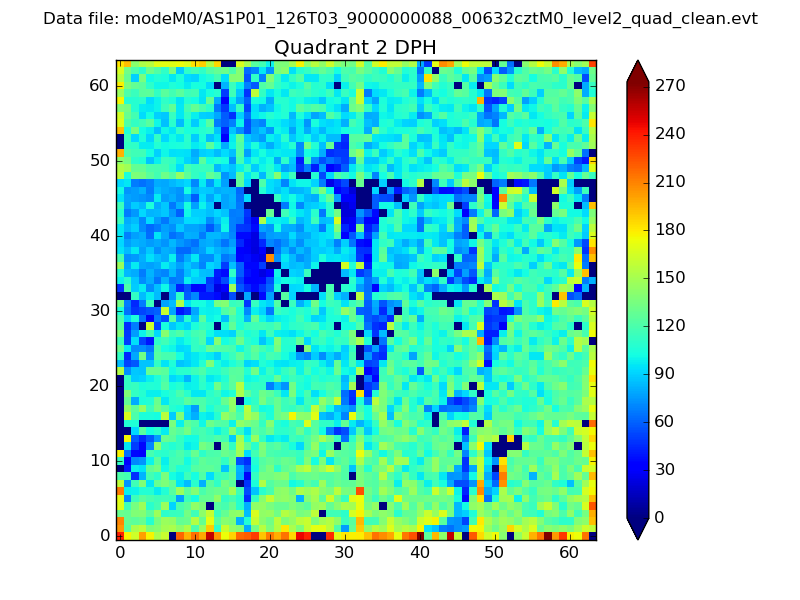
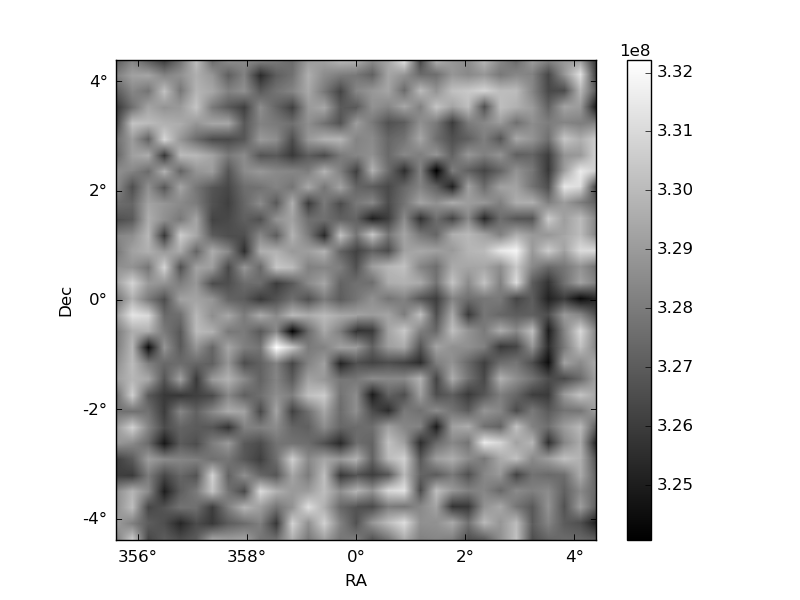
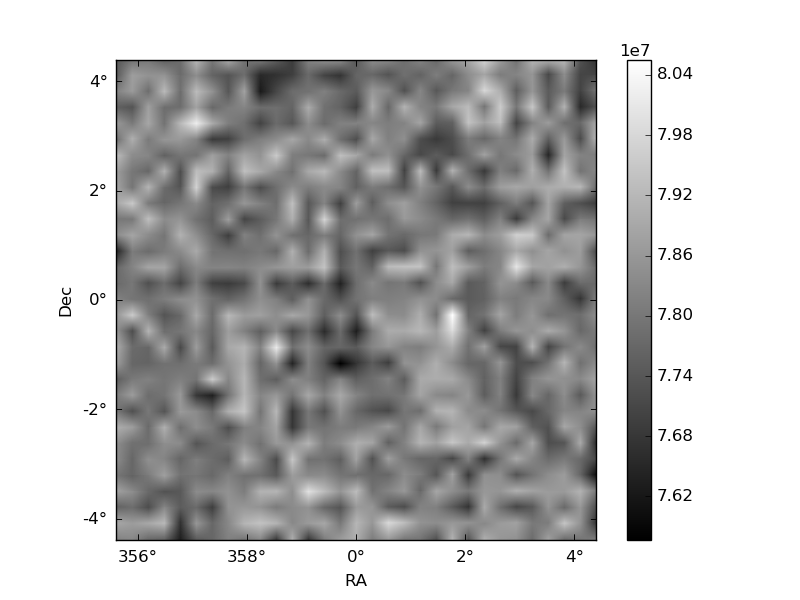
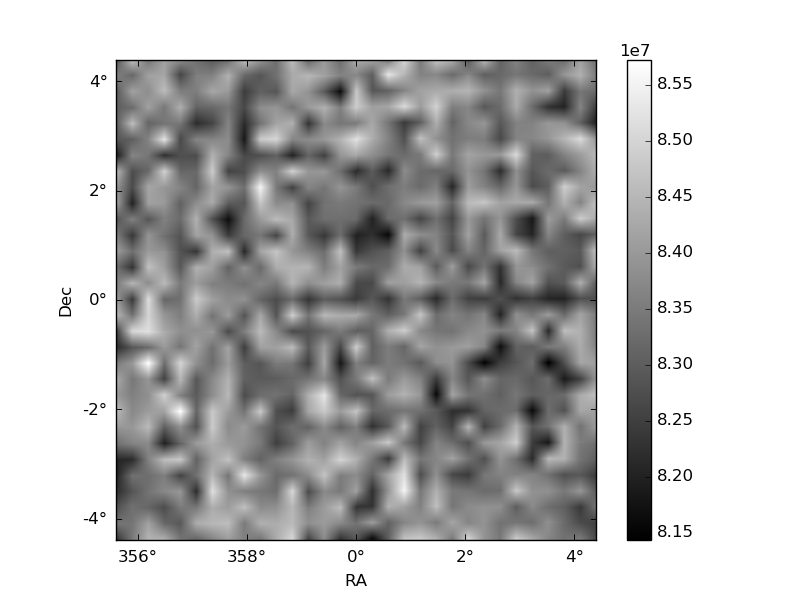
Histogram calculated using DETX and DETY for each event in the final _common_clean file
| Quadrant A |  |
 |
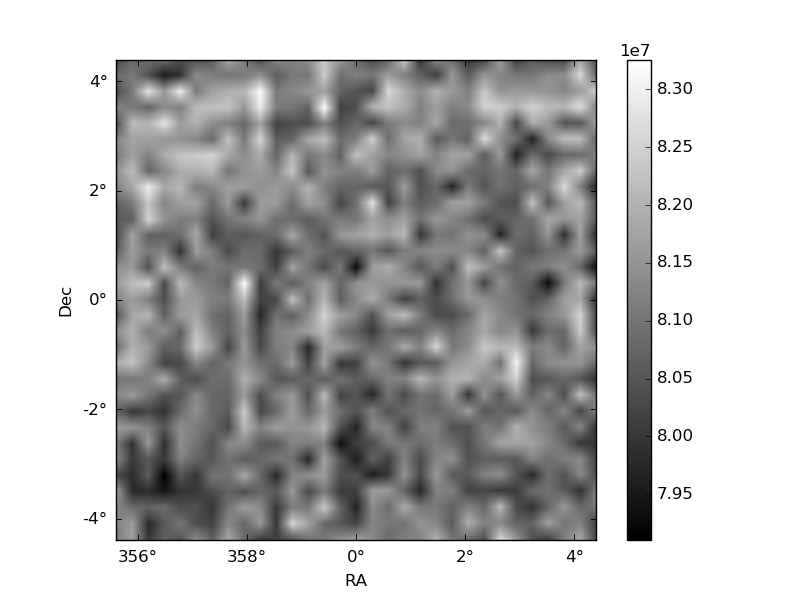
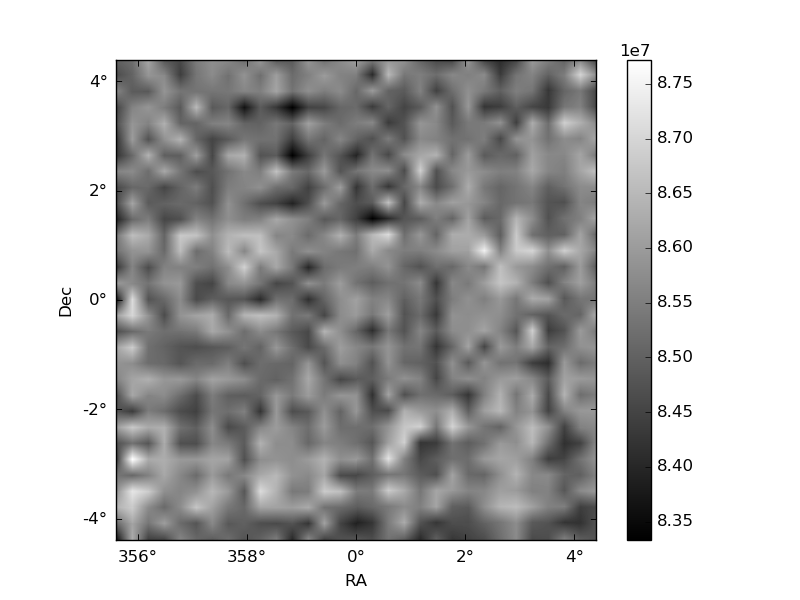
Quadrant B |
|---|---|---|---|
| Quadrant D | 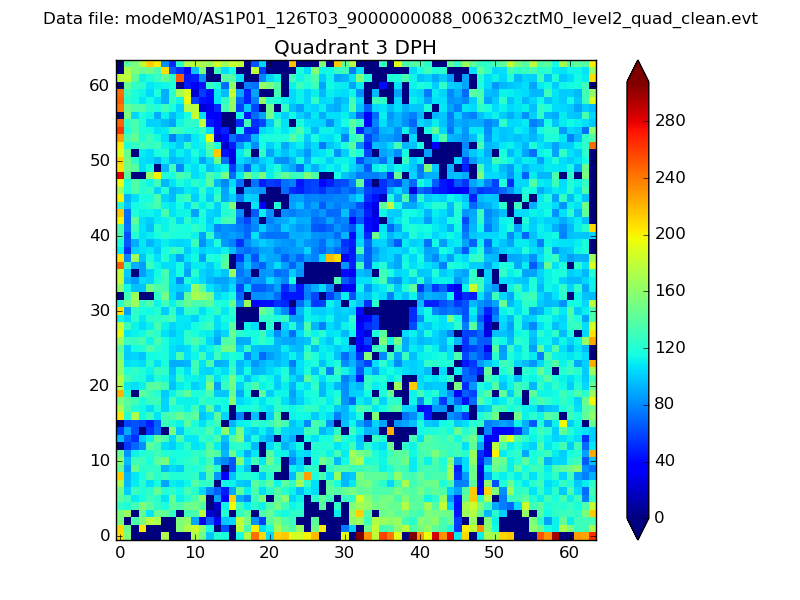 |
 |
Quadrant C |
| Plot type | Count rate plots | Images |
|---|---|---|
| Comparison with Poisson distribution Blue bars denote a histogram of data divided into 1 sec bins. Red curve is a Poisson curve with rate = median count rate of data. |
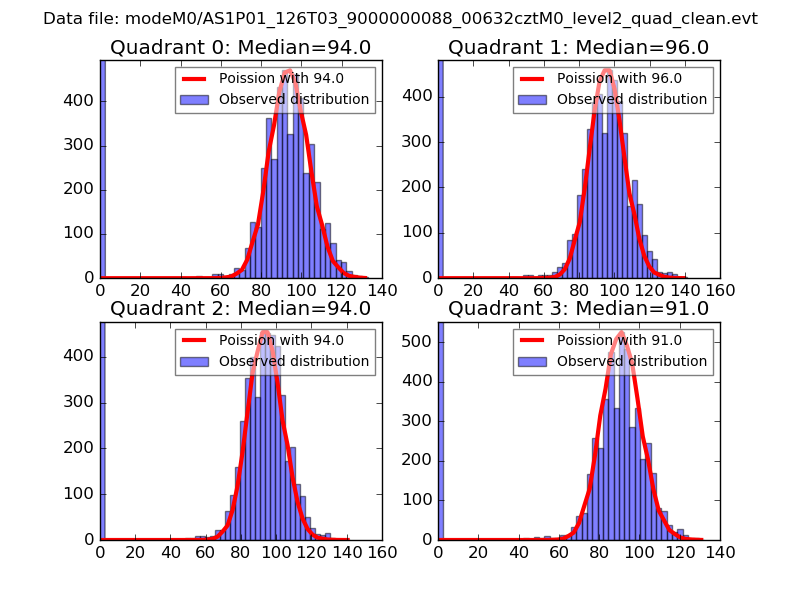 |
 |
| Quadrant-wise count rates Data is divided into 100 sec bins |
 |
|
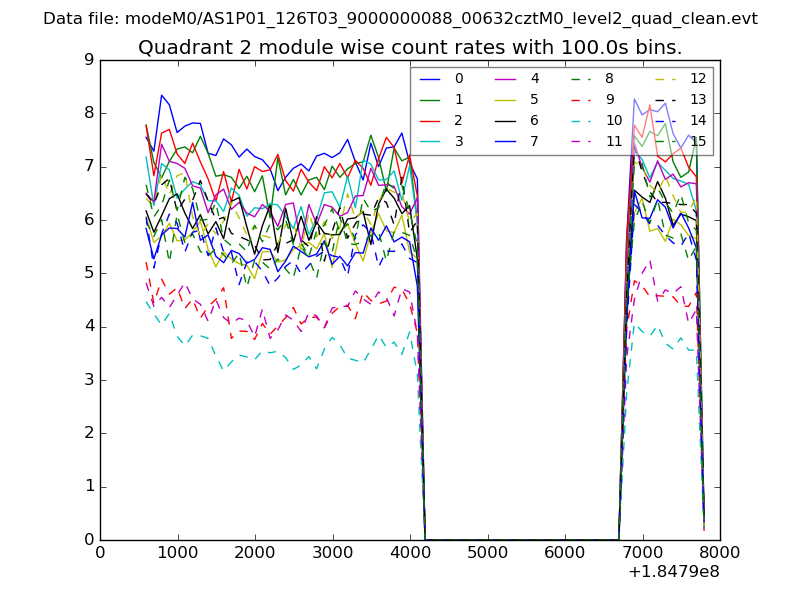
| Module-wise count rates for Quadrant A Data is divided into 100 sec bins |
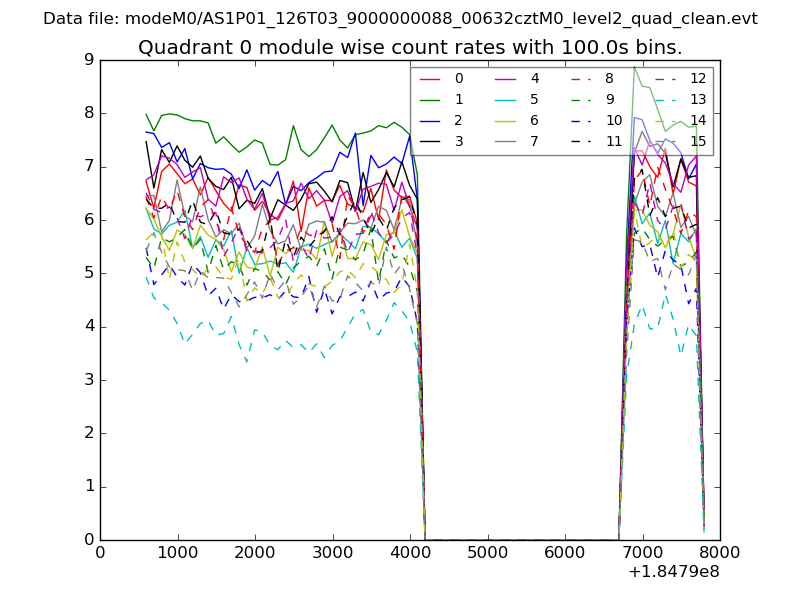 |
 |
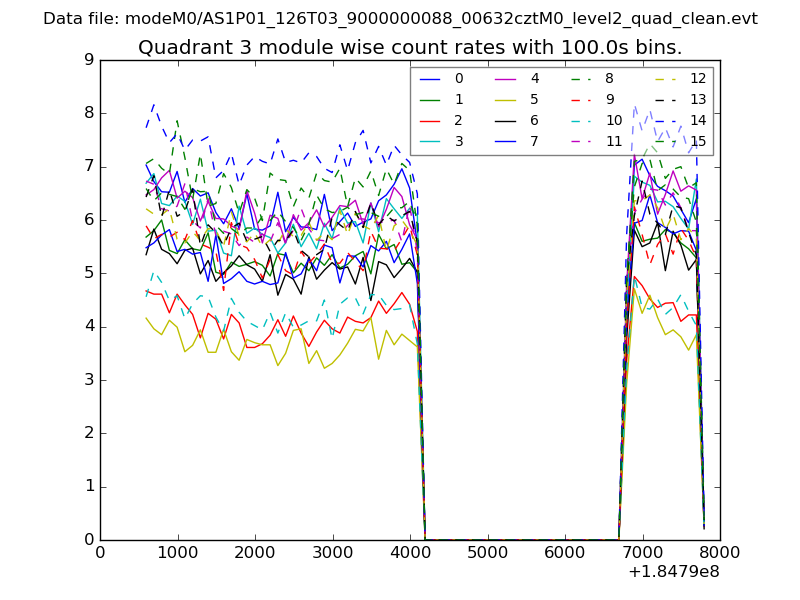
| Module-wise count rates for Quadrant B Data is divided into 100 sec bins |
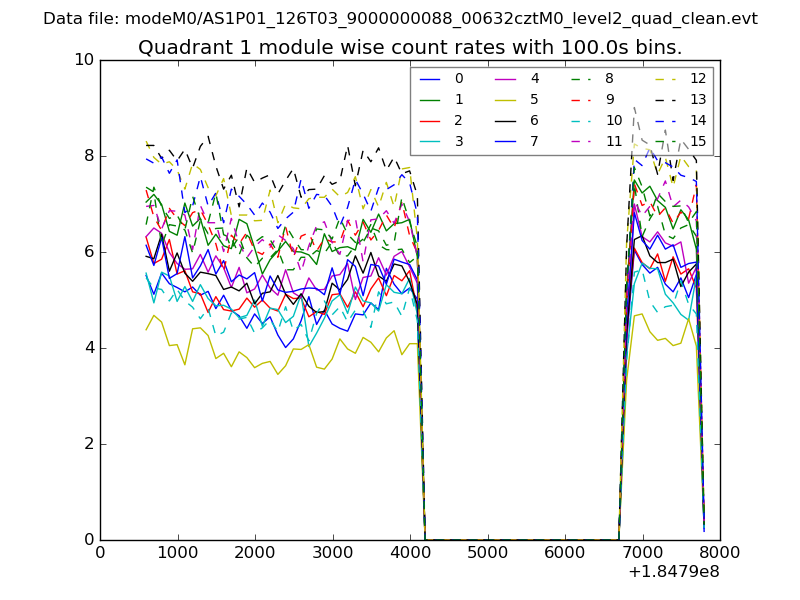 |
 |
| Module-wise count rates for Quadrant C Data is divided into 100 sec bins |
 |
 |
| Module-wise count rates for Quadrant D Data is divided into 100 sec bins |
 |
 |
| Parameter | Plot |
|---|---|
| CZT HV Monitor | 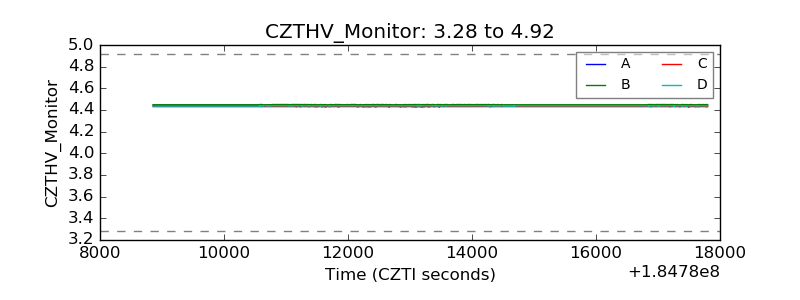 |
| D_VDD | 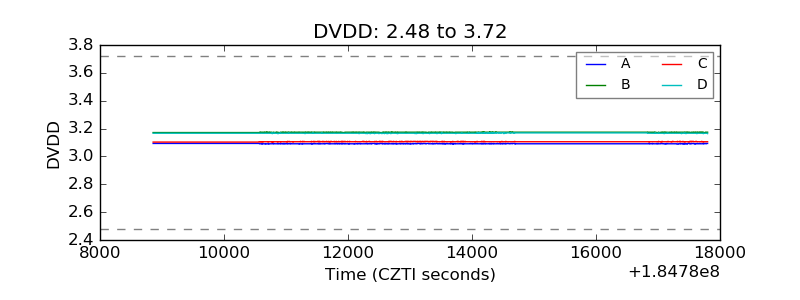 |
| Temperature 1 | 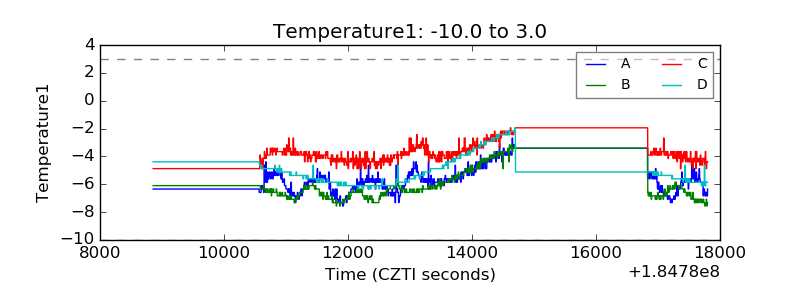 |
| Veto HV Monitor | 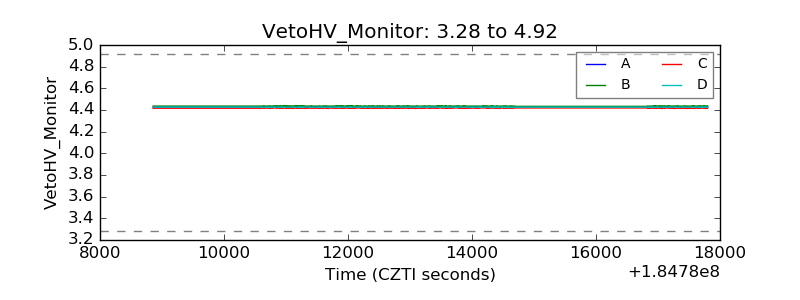 |
| Veto LLD | 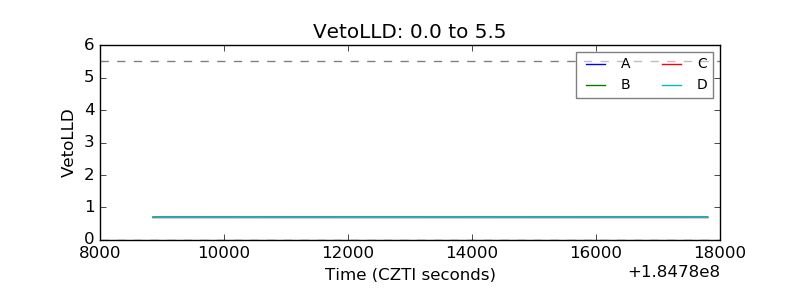 |
| Alpha Counter | 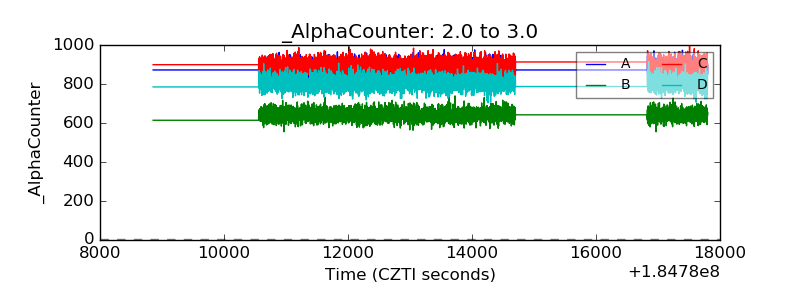 |
| _CPM_Rate | 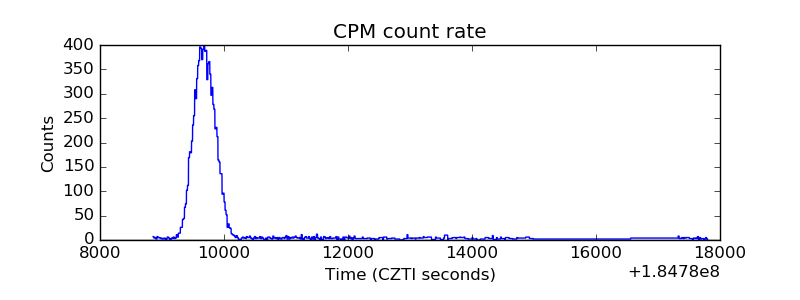 |
| CZT Counter | 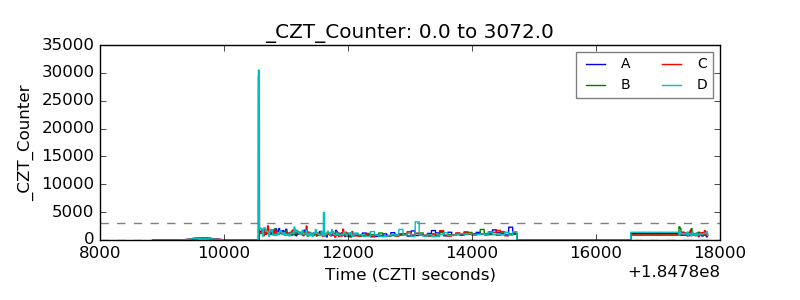 |
| +2.5 Volts monitor |  |
| +5 Volts monitor |  |
| _ROLL_ROT | 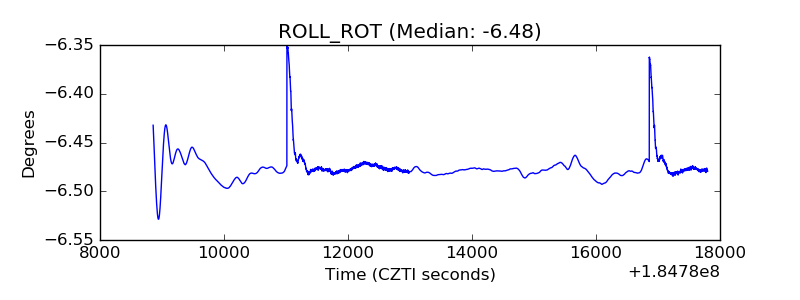 |
| _Roll_DEC | 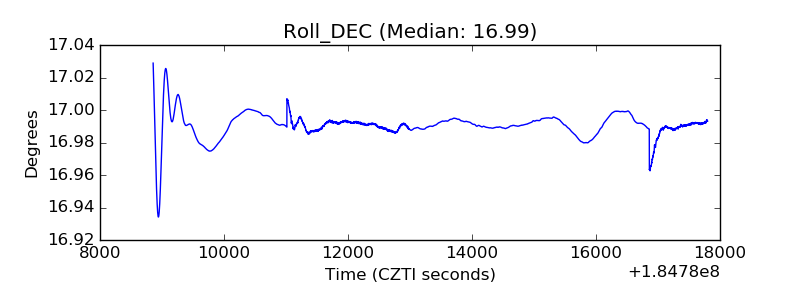 |
| _Roll_RA | 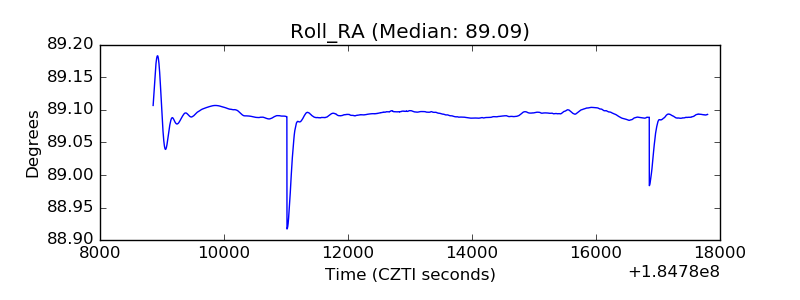 |
| Veto Counter | 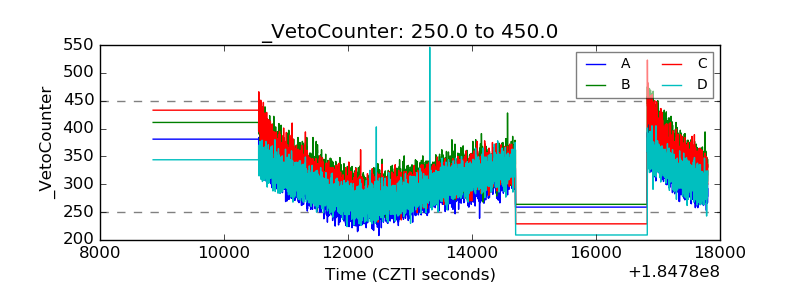 |