| Param | Original file | Final file |
|---|---|---|
| Filename | modeM0/AS1P01_126T04_9000000092_00648cztM0_level2.evt | modeM0/AS1P01_126T04_9000000092_00648cztM0_level2_quad_clean.evt |
| Size (bytes) | 357,782,400 | 18,535,680 |
| Size | 341.2 MB | 17.7 MB |
| Events in quadrant A | 2,708,825 | 101,302 |
| Events in quadrant B | 2,680,657 | 102,319 |
| Events in quadrant C | 2,498,784 | 100,946 |
| Events in quadrant D | 2,796,350 | 94,352 |
| Mode SS | |||
|---|---|---|---|
| Quadrant | BADHDUFLAG | Total packets | Discarded packets |
| A | 0 | 48 | 0 |
| B | 0 | 48 | 0 |
| C | 0 | 48 | 0 |
| D | 0 | 48 | 0 |
| Mode M0 | |||
|---|---|---|---|
| Quadrant | BADHDUFLAG | Total packets | Discarded packets |
| A | 0 | 9626 | 1 |
| B | 0 | 9549 | 1 |
| C | 0 | 8996 | 4 |
| D | 0 | 9892 | 1 |
| Mode M9 | |||
|---|---|---|---|
| Quadrant | BADHDUFLAG | Total packets | Discarded packets |
| A | 0 | 21 | 0 |
| B | 0 | 21 | 0 |
| C | 0 | 21 | 0 |
| D | 0 | 21 | 0 |
| Quadrant | Total seconds | Saturated seconds | Saturation percentage |
|---|---|---|---|
| A | 2233 | 2 | 0.089566% |
| B | 2233 | 2 | 0.089566% |
| C | 2232 | 1 | 0.044803% |
| D | 2232 | 75 | 3.360215% |
Noise dominated data is calculated using 1-second bins in cleaned event files. If a bin has >2000 counts, and if more than 50% of those come from <1% of pixels, then it is considered to be noise-dominated and hence unusable.
| Quadrant | # 1 sec bins | Bins with >0 counts | Bins with >2000 counts | High rate bins dominated by noise | Noise dominated (total time) | Noise dominated (detector-on time) | Marked lightcurve |
|---|---|---|---|---|---|---|---|
| A | 4387 | 2234 | 56 | 56 | 1.28% | 2.51% |  |
| B | 4387 | 2234 | 42 | 42 | 0.96% | 1.88% | 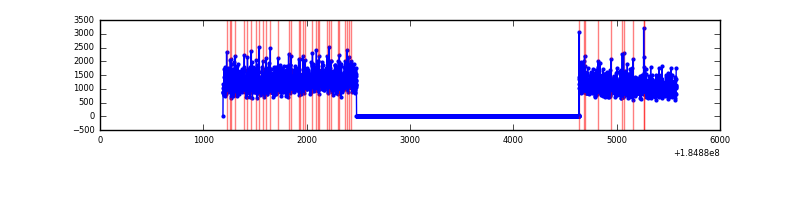 |
| C | 4386 | 2233 | 24 | 24 | 0.55% | 1.07% | 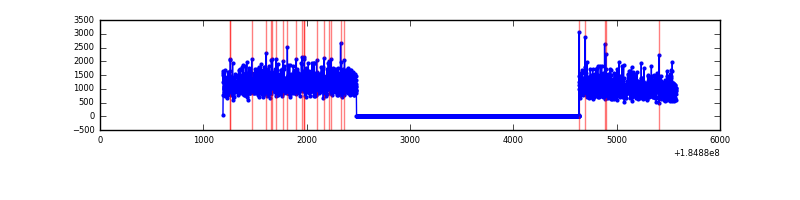 |
| D | 4386 | 2233 | 156 | 156 | 3.56% | 6.99% | 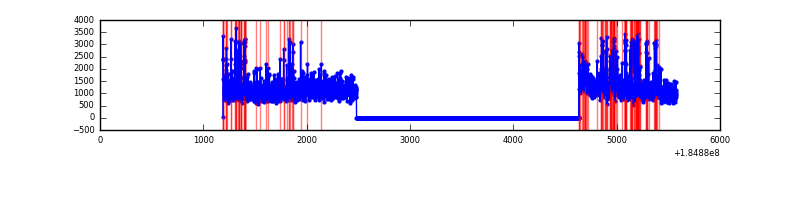 |
Top three noisy pixels from each quadrant. If the there are fewer than three noisy pixels in the level2.evt file, extra rows are filled as -1
| Pixel properties | Quadrant properties | ||||||
|---|---|---|---|---|---|---|---|
| Quadrant | DetID | PixID | Counts | Sigma | Mean | Median | Sigma |
| A | 0 | 238 | 12087 | 74.64 | 691 | 687 | 152.7 |
| A | 15 | 53 | 7759 | 46.3 | 691 | 687 | 152.7 |
| A | 14 | 79 | 7312 | 43.38 | 691 | 687 | 152.7 |
| B | 5 | 249 | 8219 | 46.11 | 696 | 699 | 163.1 |
| B | 0 | 220 | 7652 | 42.63 | 696 | 699 | 163.1 |
| B | 15 | 255 | 4179 | 21.34 | 696 | 699 | 163.1 |
| C | 15 | 241 | 4579 | 21.97 | 634 | 660 | 178.4 |
| C | 1 | 16 | 2228 | 8.79 | 634 | 660 | 178.4 |
| C | -1 | -1 | -1 | -1.0 | 634 | 660 | 178.4 |
| D | 1 | 4 | 255253 | 1337.39 | 601 | 624 | 190.4 |
| D | 12 | 237 | 68167 | 354.76 | 601 | 624 | 190.4 |
| D | 13 | 221 | 48969 | 253.92 | 601 | 624 | 190.4 |
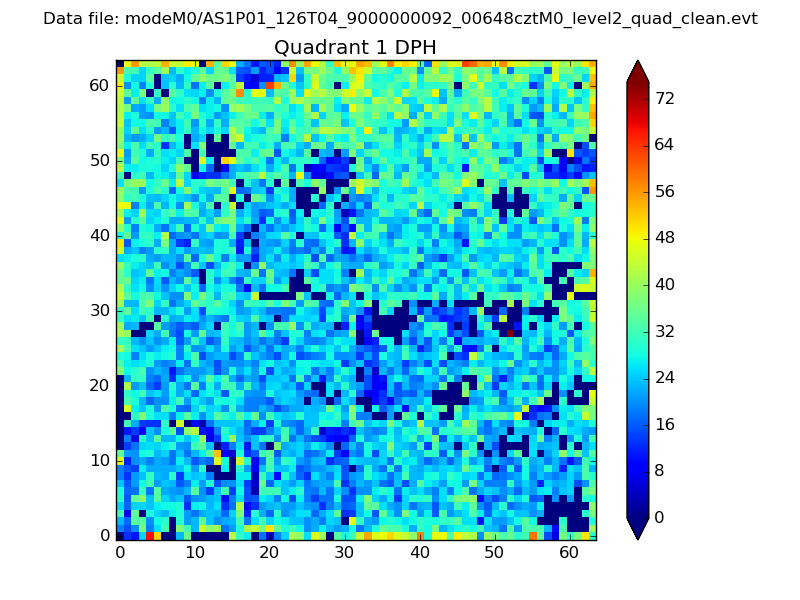
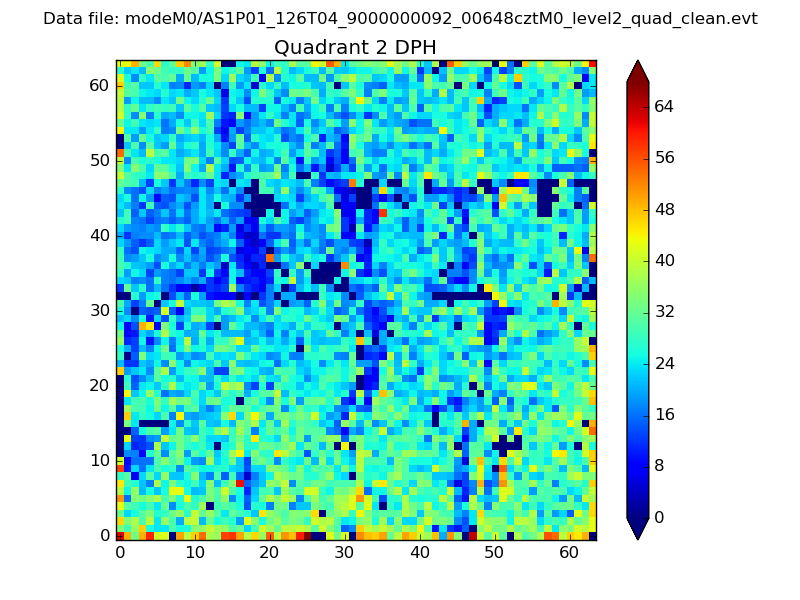
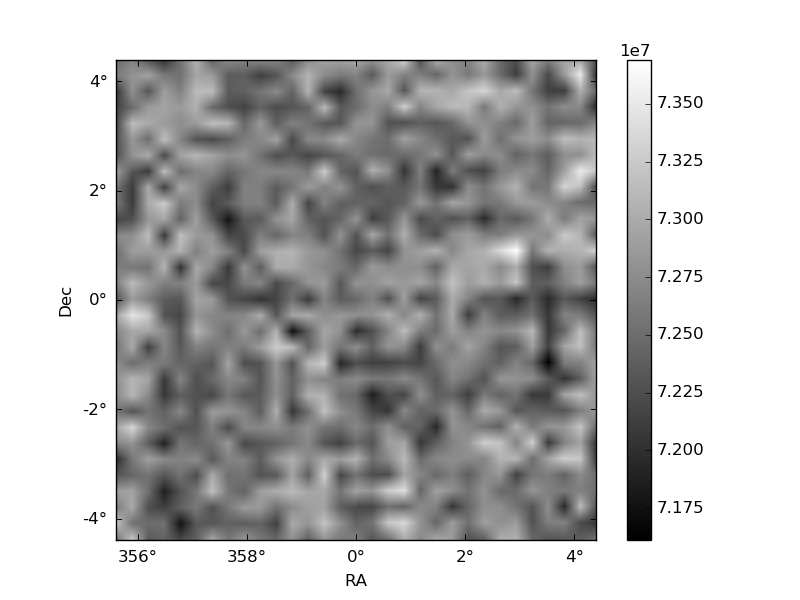
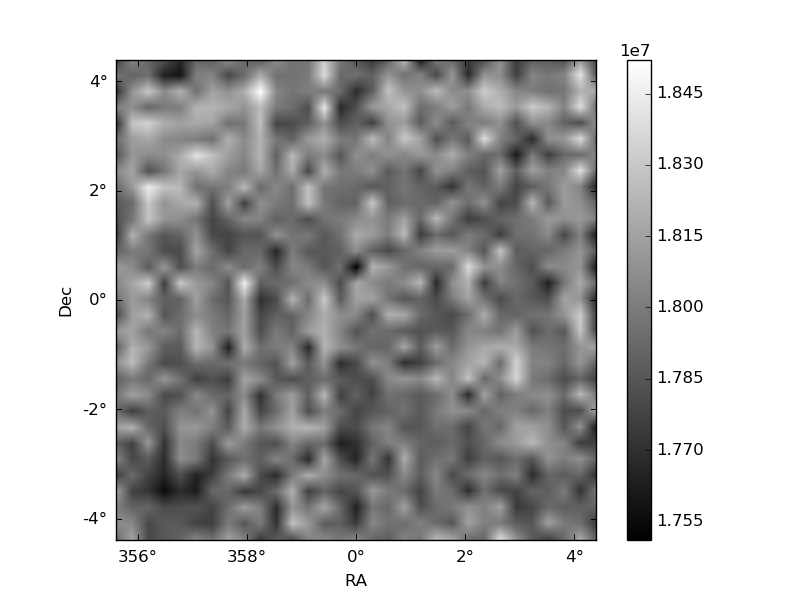
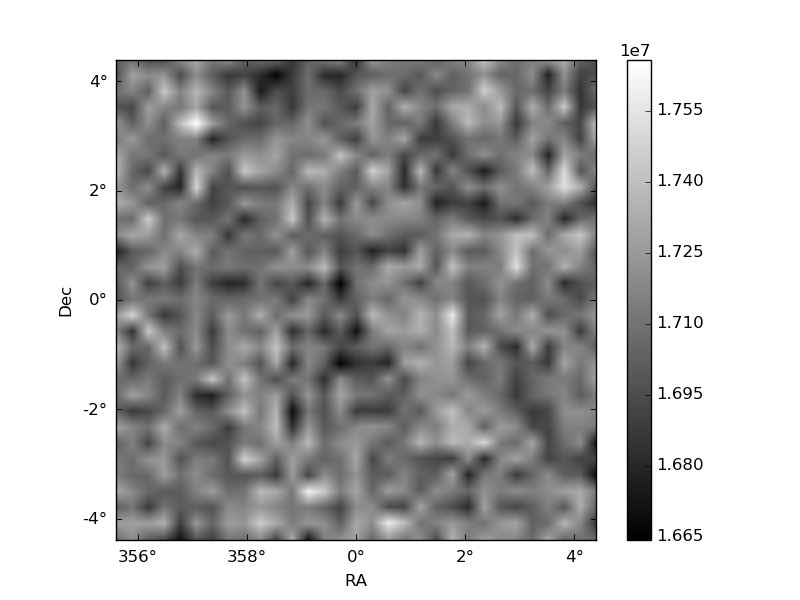
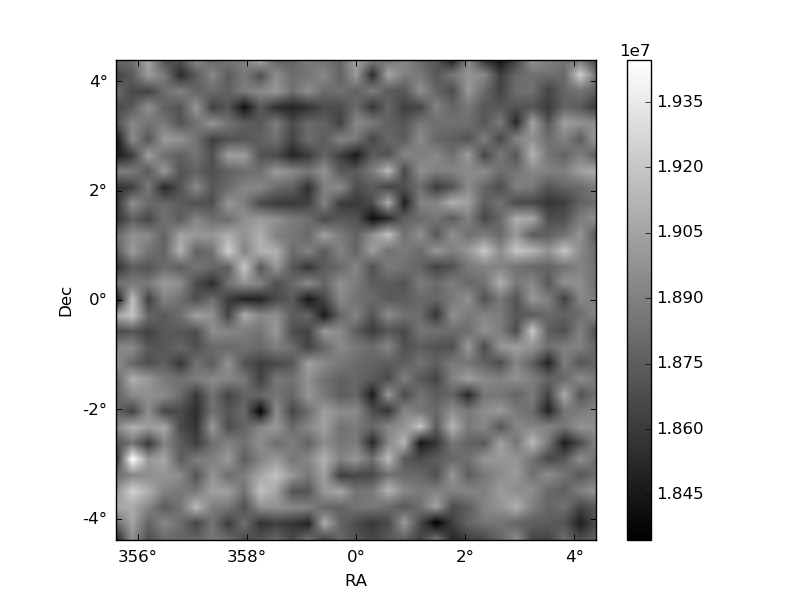
Histogram calculated using DETX and DETY for each event in the final _common_clean file
| Quadrant A | 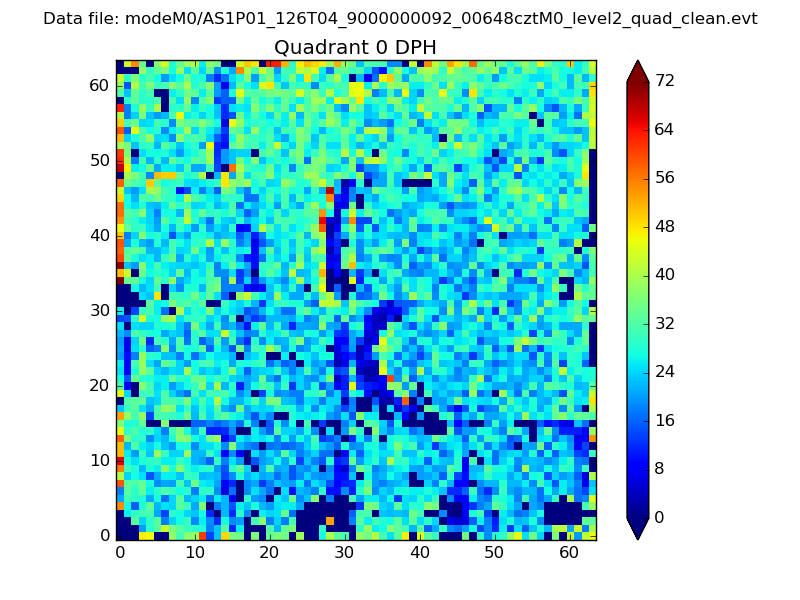 |
 |
Quadrant B |
|---|---|---|---|
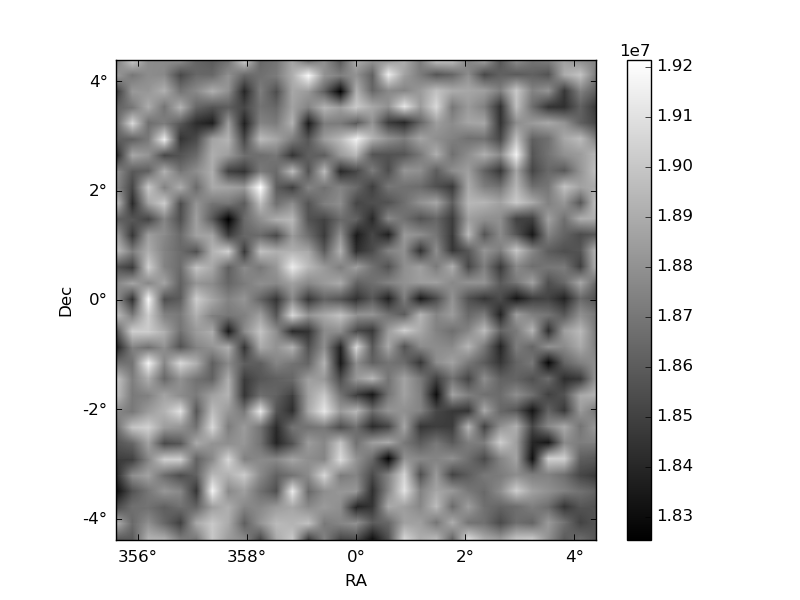
| Quadrant D | 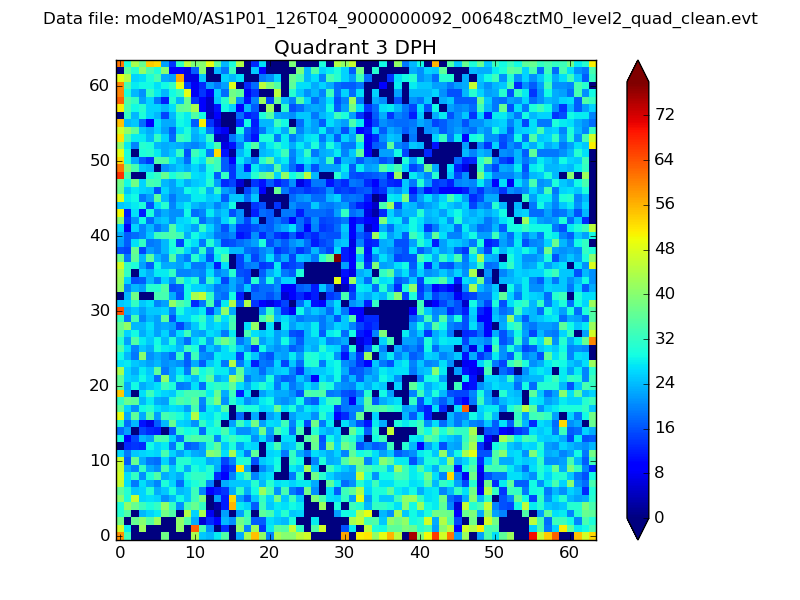 |
 |
Quadrant C |
| Plot type | Count rate plots | Images |
|---|---|---|
| Comparison with Poisson distribution Blue bars denote a histogram of data divided into 1 sec bins. Red curve is a Poisson curve with rate = median count rate of data. |
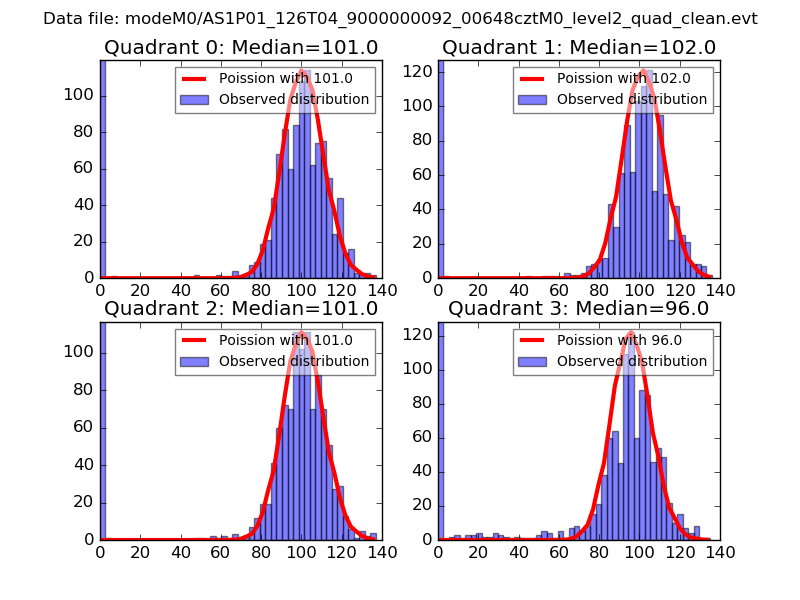 |
 |
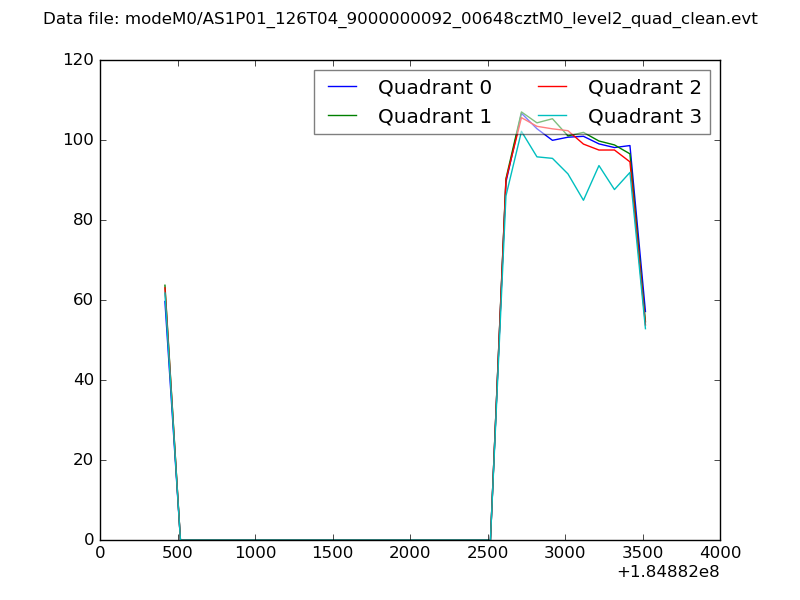
| Quadrant-wise count rates Data is divided into 100 sec bins |
 |
|
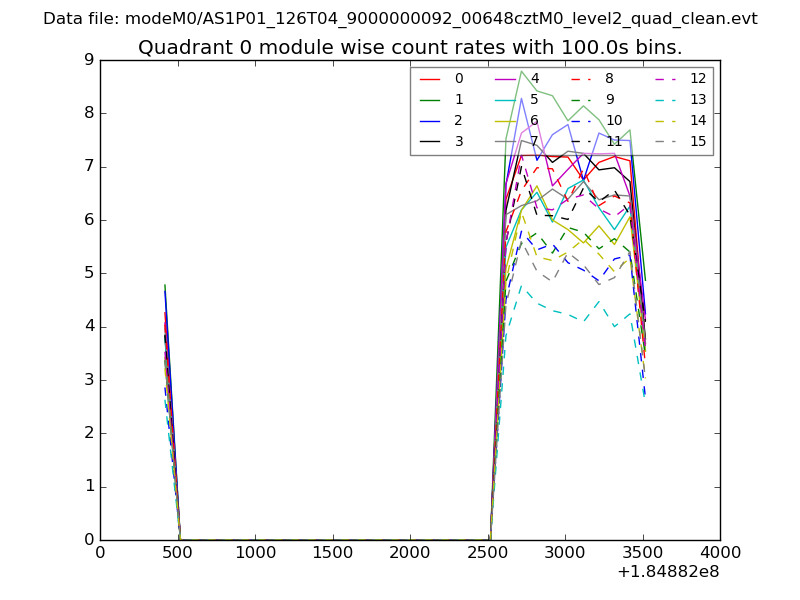
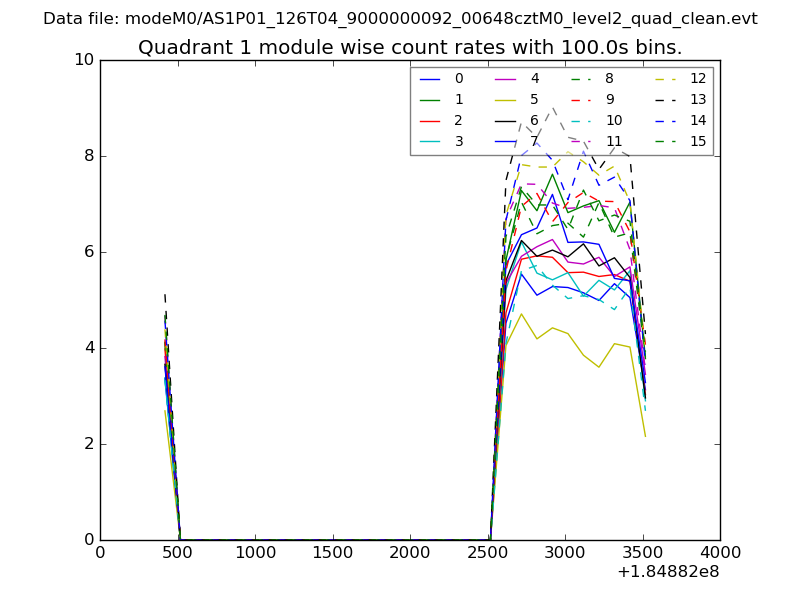
| Module-wise count rates for Quadrant A Data is divided into 100 sec bins |
 |
 |
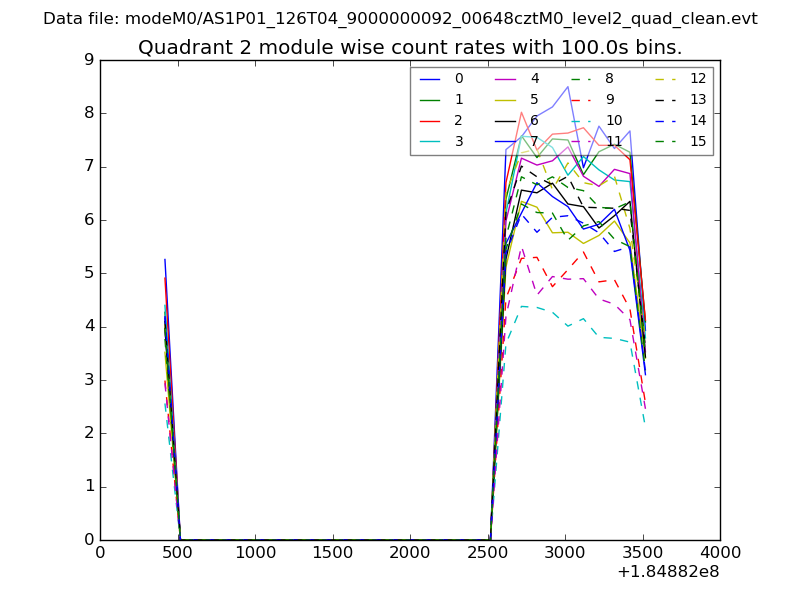
| Module-wise count rates for Quadrant B Data is divided into 100 sec bins |
 |
 |
| Module-wise count rates for Quadrant C Data is divided into 100 sec bins |
 |
 |
| Module-wise count rates for Quadrant D Data is divided into 100 sec bins |
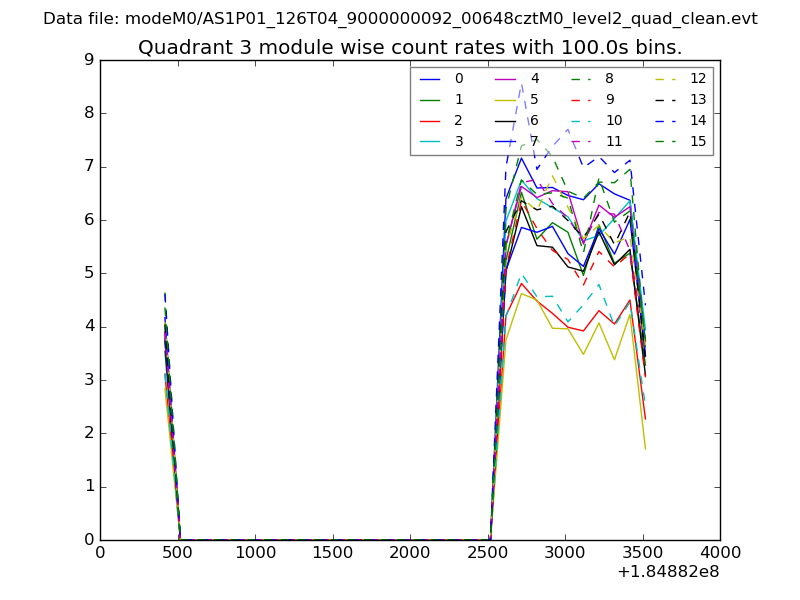 |
 |
| Parameter | Plot |
|---|---|
| CZT HV Monitor | 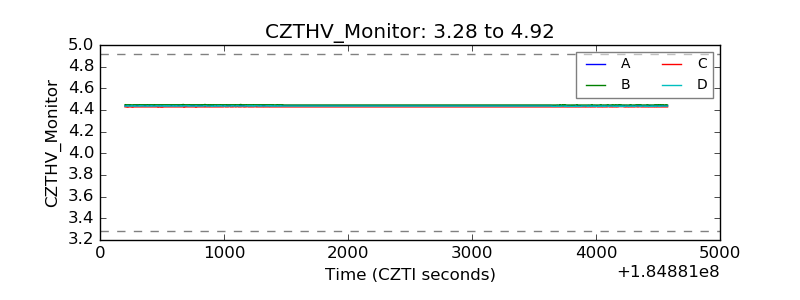 |
| D_VDD | 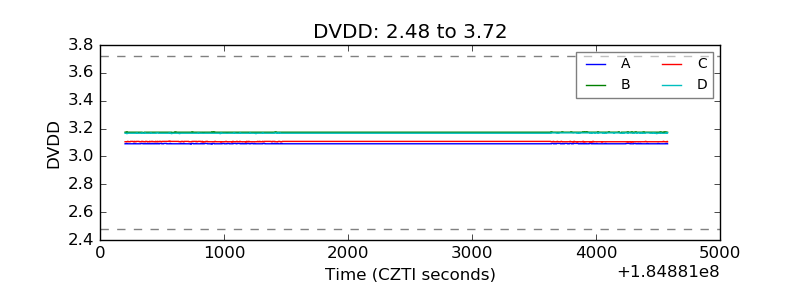 |
| Temperature 1 | 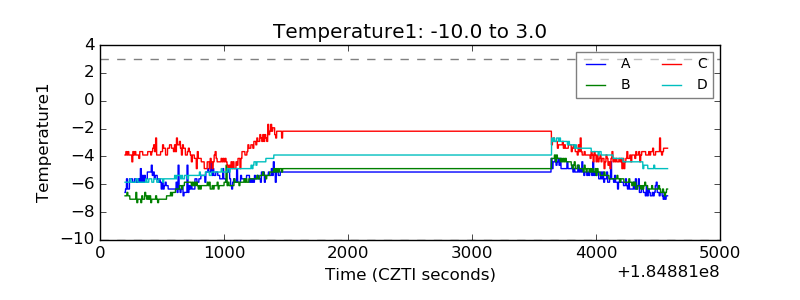 |
| Veto HV Monitor | 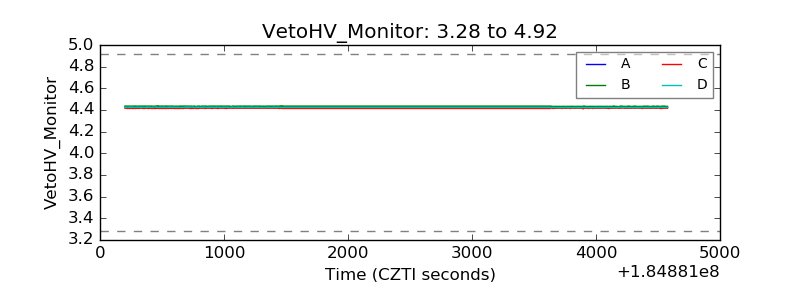 |
| Veto LLD | 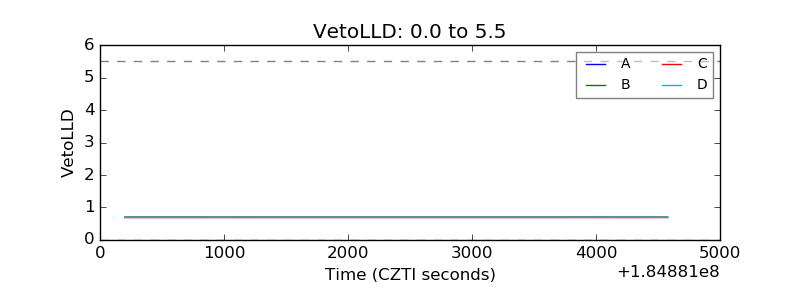 |
| Alpha Counter | 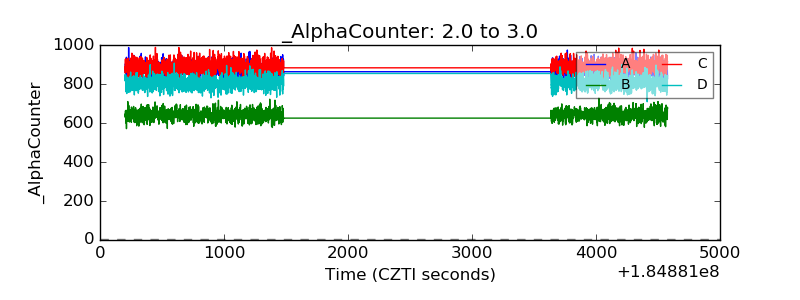 |
| _CPM_Rate | 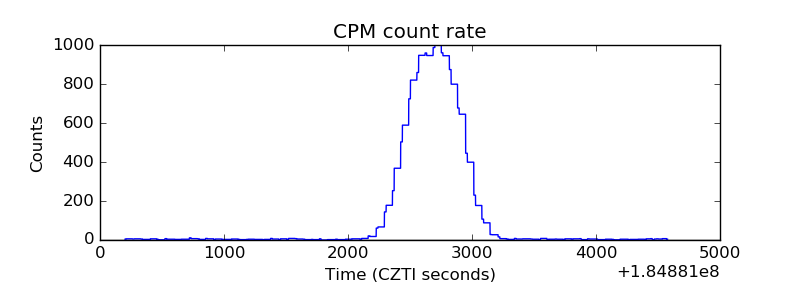 |
| CZT Counter | 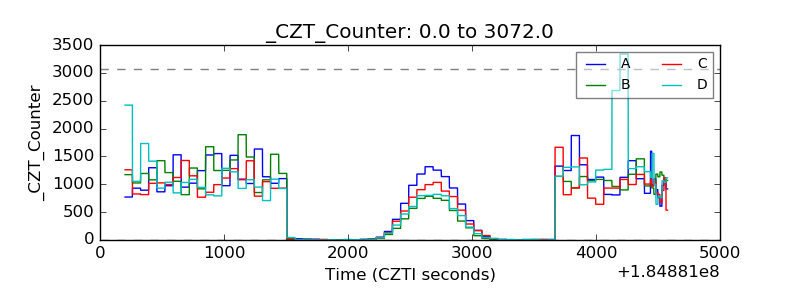 |
| +2.5 Volts monitor |  |
| +5 Volts monitor |  |
| _ROLL_ROT | 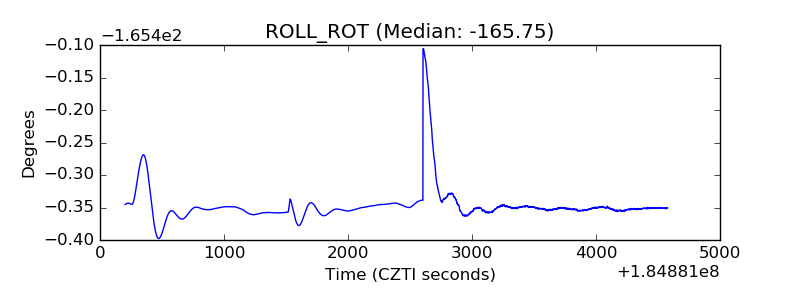 |
| _Roll_DEC | 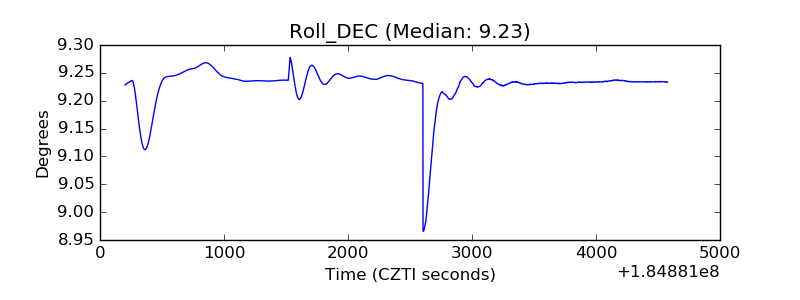 |
| _Roll_RA | 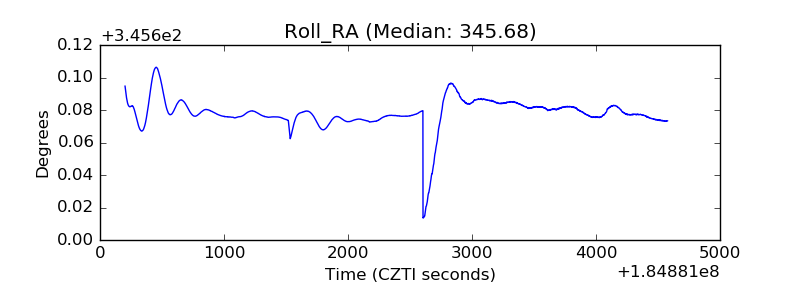 |
| Veto Counter | 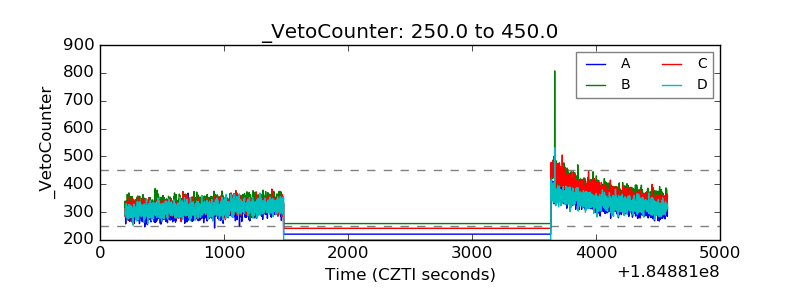 |