| Param | Original file | Final file |
|---|---|---|
| Filename | modeM0/AS1P01_126T04_9000000092_00649cztM0_level2.evt | modeM0/AS1P01_126T04_9000000092_00649cztM0_level2_quad_clean.evt |
| Size (bytes) | 759,758,400 | 47,802,240 |
| Size | 724.6 MB | 45.6 MB |
| Events in quadrant A | 5,719,532 | 277,035 |
| Events in quadrant B | 5,777,537 | 281,297 |
| Events in quadrant C | 5,375,236 | 275,342 |
| Events in quadrant D | 5,802,602 | 261,446 |
| Mode SS | |||
|---|---|---|---|
| Quadrant | BADHDUFLAG | Total packets | Discarded packets |
| A | 0 | 102 | 0 |
| B | 0 | 102 | 0 |
| C | 0 | 102 | 0 |
| D | 0 | 102 | 0 |
| Mode M0 | |||
|---|---|---|---|
| Quadrant | BADHDUFLAG | Total packets | Discarded packets |
| A | 0 | 20570 | 2 |
| B | 0 | 20700 | 2 |
| C | 0 | 19554 | 2 |
| D | 0 | 20829 | 2 |
| Mode M9 | |||
|---|---|---|---|
| Quadrant | BADHDUFLAG | Total packets | Discarded packets |
| A | 0 | 29 | 0 |
| B | 0 | 29 | 0 |
| C | 0 | 29 | 0 |
| D | 0 | 29 | 0 |
| Quadrant | Total seconds | Saturated seconds | Saturation percentage |
|---|---|---|---|
| A | 5019 | 5 | 0.099621% |
| B | 5019 | 7 | 0.139470% |
| C | 5019 | 2 | 0.039849% |
| D | 5019 | 81 | 1.613867% |
Noise dominated data is calculated using 1-second bins in cleaned event files. If a bin has >2000 counts, and if more than 50% of those come from <1% of pixels, then it is considered to be noise-dominated and hence unusable.
| Quadrant | # 1 sec bins | Bins with >0 counts | Bins with >2000 counts | High rate bins dominated by noise | Noise dominated (total time) | Noise dominated (detector-on time) | Marked lightcurve |
|---|---|---|---|---|---|---|---|
| A | 7174 | 5020 | 96 | 96 | 1.34% | 1.91% | 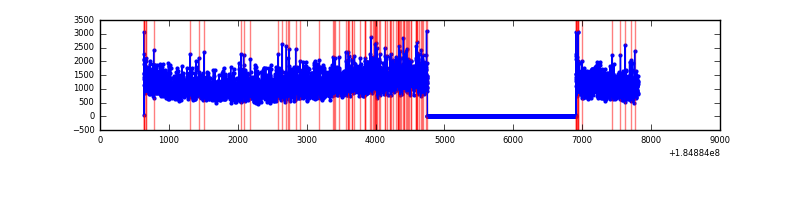 |
| B | 7174 | 5020 | 71 | 71 | 0.99% | 1.41% | 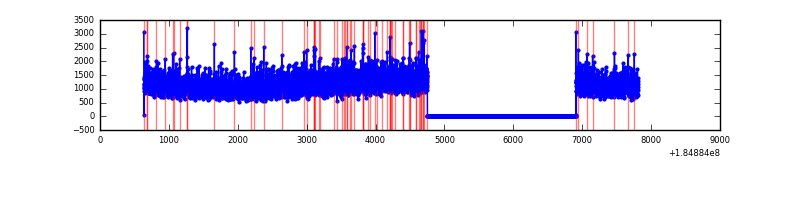 |
| C | 7174 | 5020 | 37 | 37 | 0.52% | 0.74% | 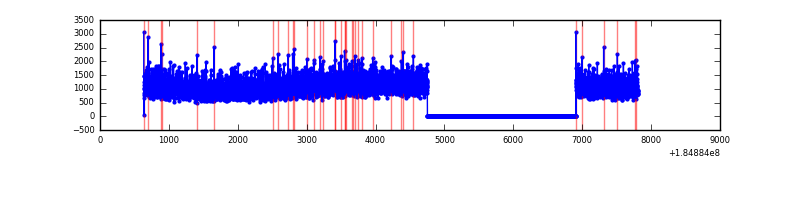 |
| D | 7174 | 5020 | 198 | 198 | 2.76% | 3.94% | 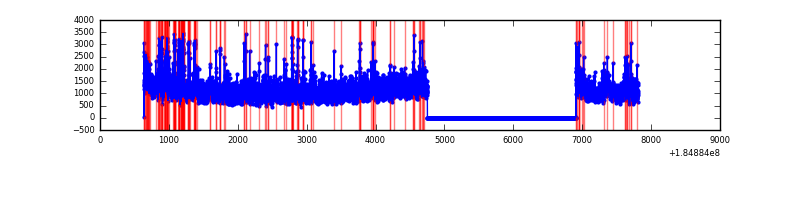 |
Top three noisy pixels from each quadrant. If the there are fewer than three noisy pixels in the level2.evt file, extra rows are filled as -1
| Pixel properties | Quadrant properties | ||||||
|---|---|---|---|---|---|---|---|
| Quadrant | DetID | PixID | Counts | Sigma | Mean | Median | Sigma |
| A | 15 | 171 | 28866 | 85.58 | 1455 | 1442 | 320.5 |
| A | 0 | 69 | 18466 | 53.12 | 1455 | 1442 | 320.5 |
| A | 0 | 238 | 17836 | 51.16 | 1455 | 1442 | 320.5 |
| B | 0 | 220 | 29661 | 81.62 | 1482 | 1492 | 345.1 |
| B | 4 | 172 | 24995 | 68.1 | 1482 | 1492 | 345.1 |
| B | 5 | 249 | 12970 | 33.26 | 1482 | 1492 | 345.1 |
| C | 15 | 241 | 9905 | 22.31 | 1363 | 1414 | 380.6 |
| C | 9 | 52 | 8011 | 17.34 | 1363 | 1414 | 380.6 |
| C | 7 | 251 | 3703 | 6.01 | 1363 | 1414 | 380.6 |
| D | 1 | 4 | 302219 | 753.12 | 1278 | 1331 | 399.5 |
| D | 12 | 237 | 211062 | 524.95 | 1278 | 1331 | 399.5 |
| D | 13 | 221 | 137185 | 340.04 | 1278 | 1331 | 399.5 |
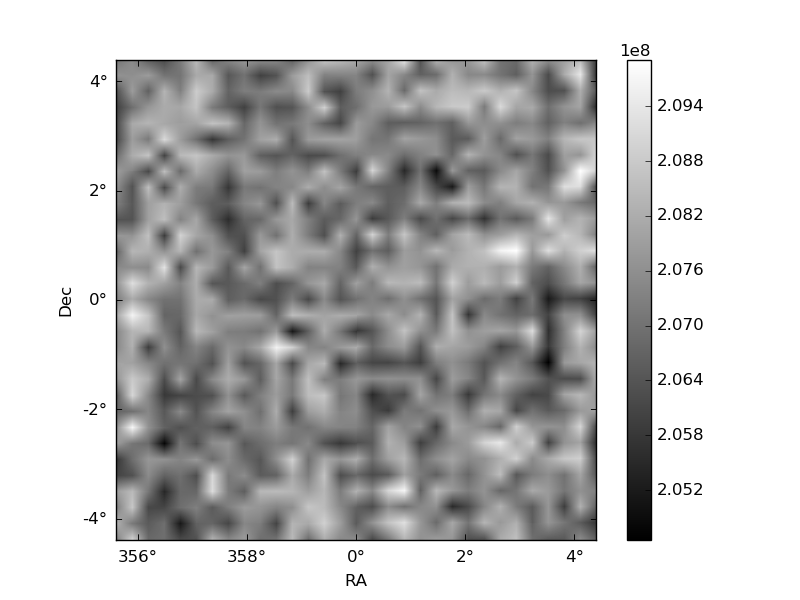
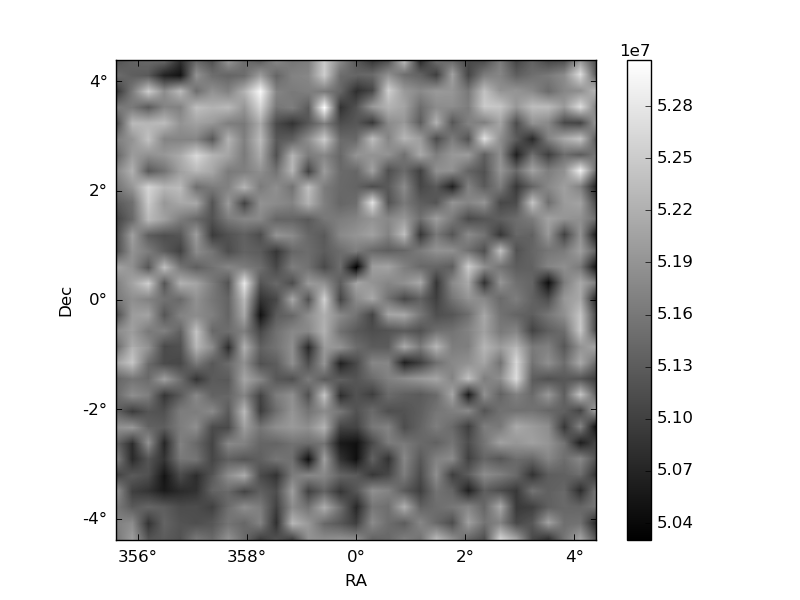
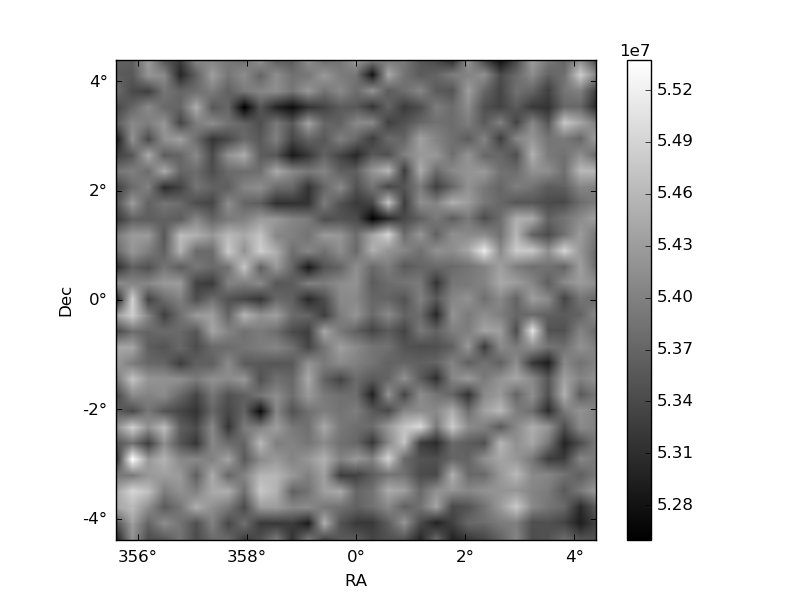
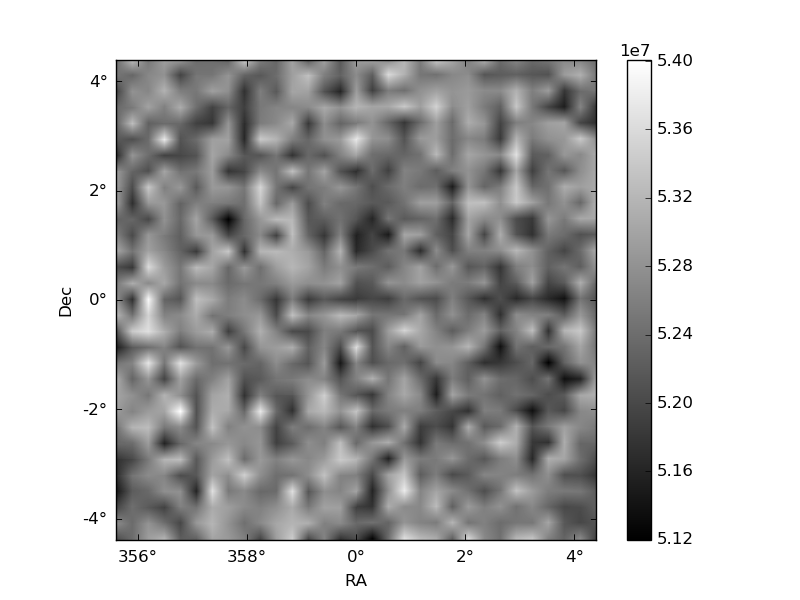
Histogram calculated using DETX and DETY for each event in the final _common_clean file
| Quadrant A | 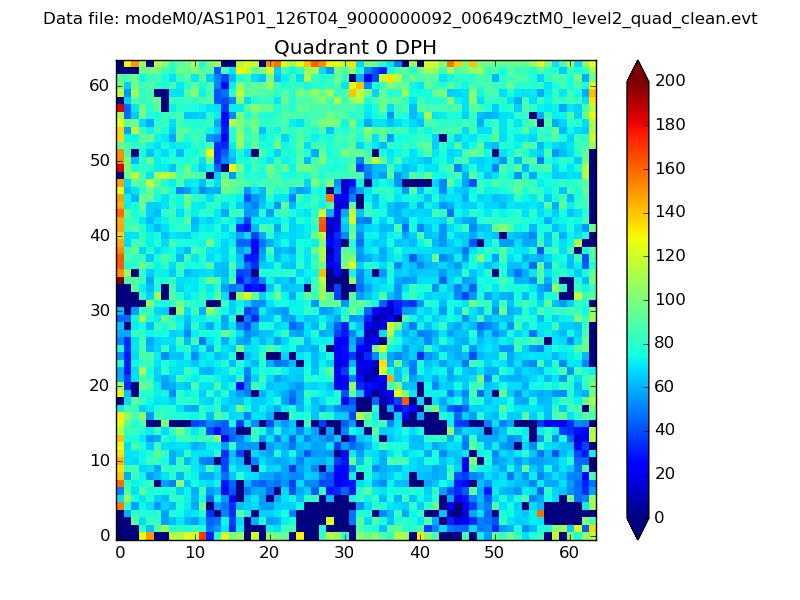 |
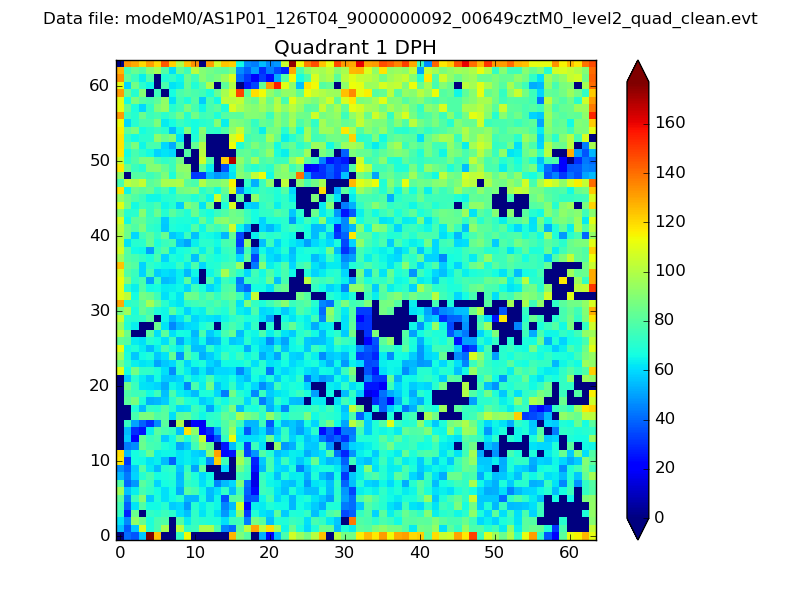 |
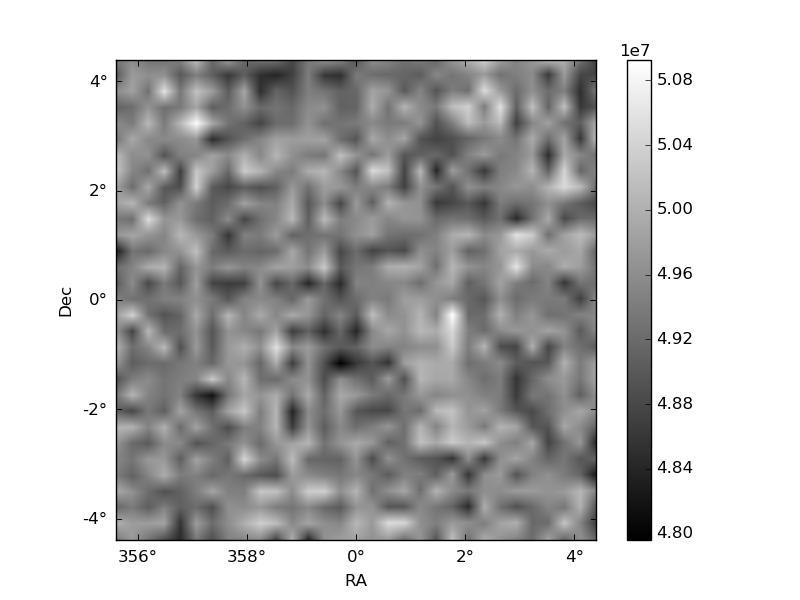
Quadrant B |
|---|---|---|---|
| Quadrant D | 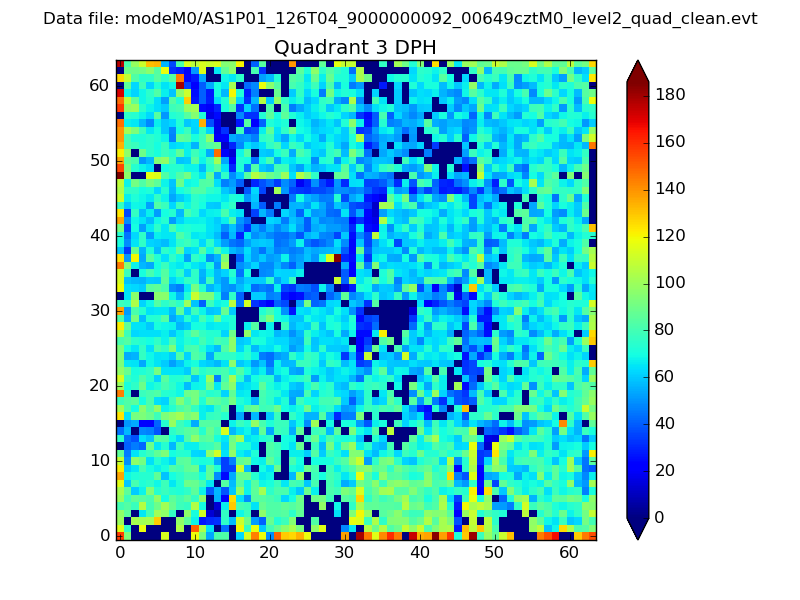 |
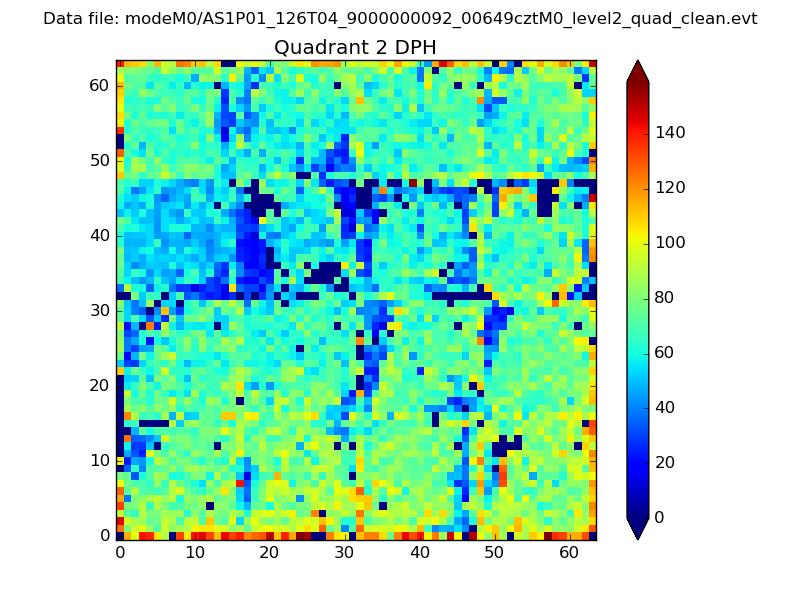 |
Quadrant C |
| Plot type | Count rate plots | Images |
|---|---|---|
| Comparison with Poisson distribution Blue bars denote a histogram of data divided into 1 sec bins. Red curve is a Poisson curve with rate = median count rate of data. |
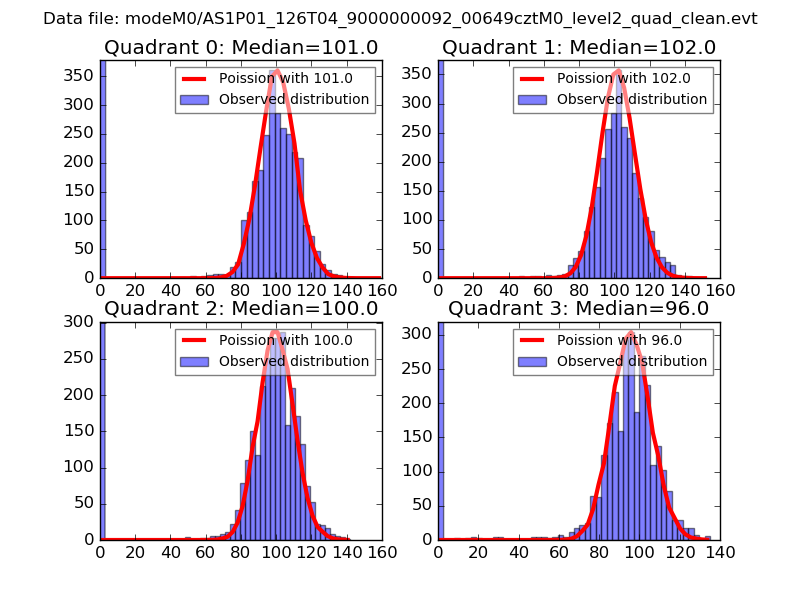 |
 |
| Quadrant-wise count rates Data is divided into 100 sec bins |
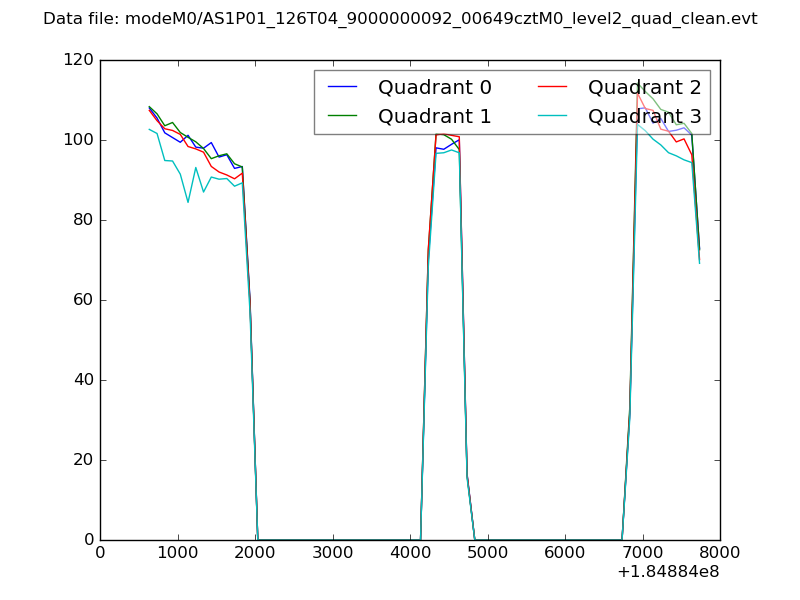 |
|
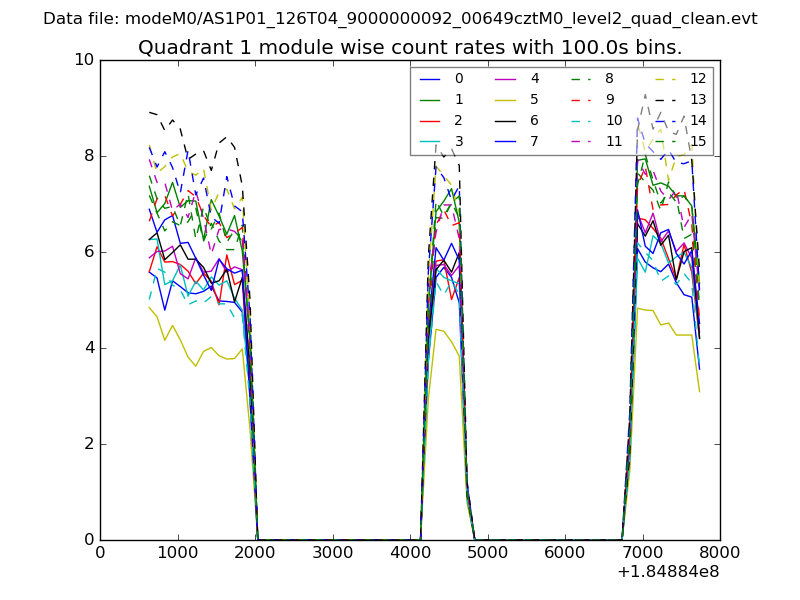
| Module-wise count rates for Quadrant A Data is divided into 100 sec bins |
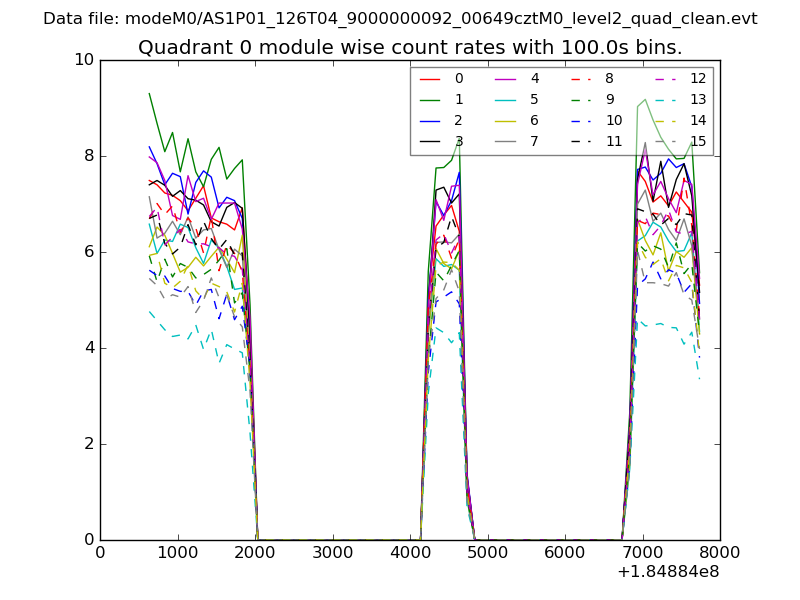 |
 |
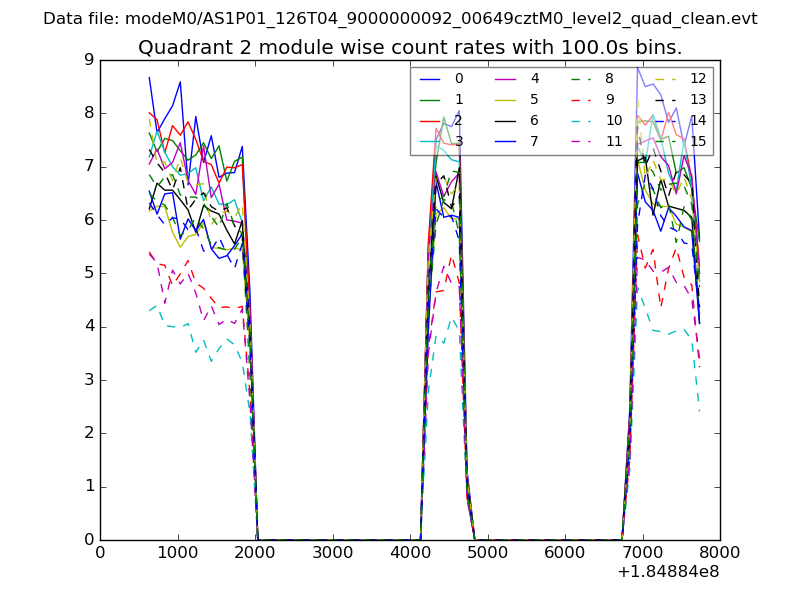
| Module-wise count rates for Quadrant B Data is divided into 100 sec bins |
 |
 |
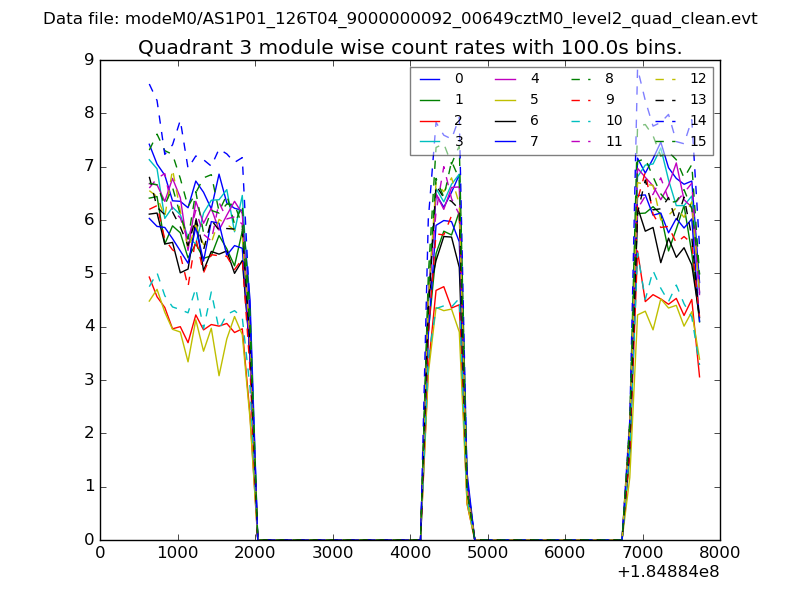
| Module-wise count rates for Quadrant C Data is divided into 100 sec bins |
 |
 |
| Module-wise count rates for Quadrant D Data is divided into 100 sec bins |
 |
 |
| Parameter | Plot |
|---|---|
| CZT HV Monitor | 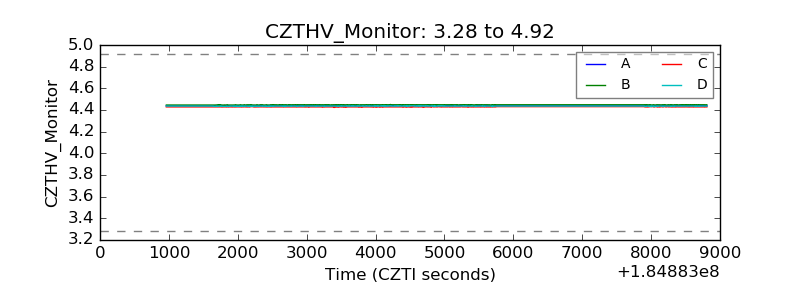 |
| D_VDD | 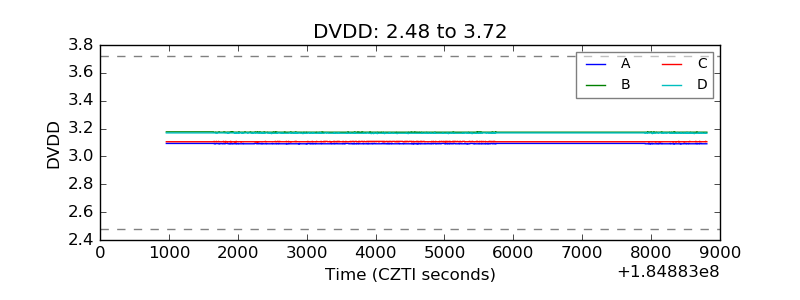 |
| Temperature 1 |  |
| Veto HV Monitor | 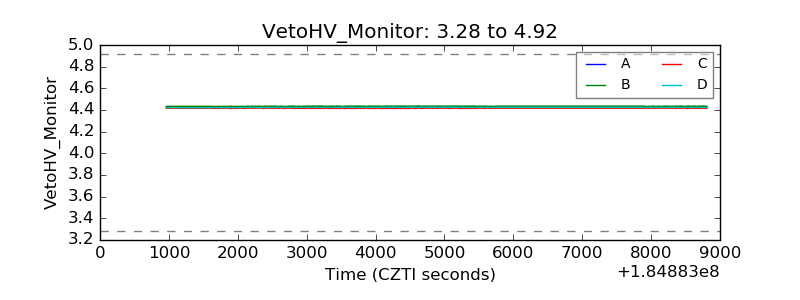 |
| Veto LLD | 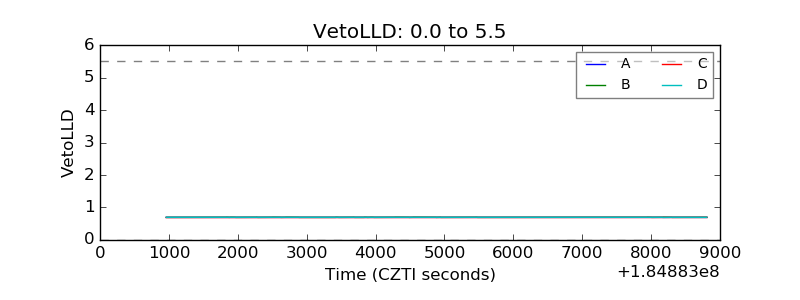 |
| Alpha Counter | 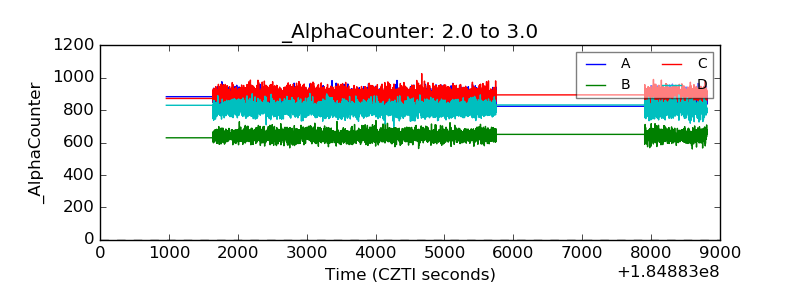 |
| _CPM_Rate | 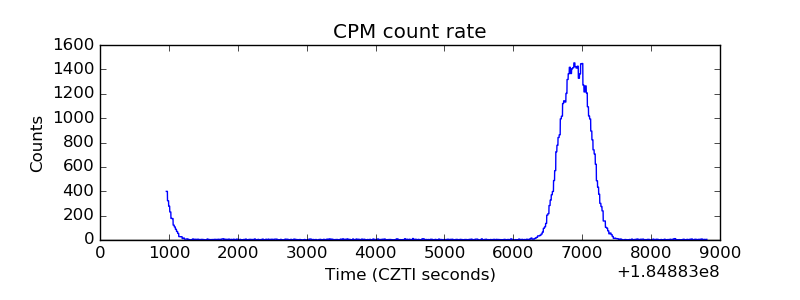 |
| CZT Counter | 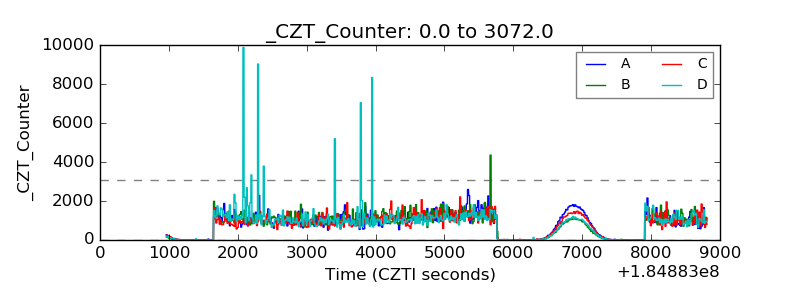 |
| +2.5 Volts monitor |  |
| +5 Volts monitor | 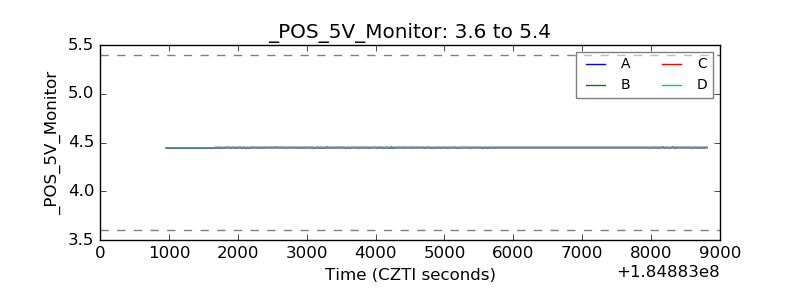 |
| _ROLL_ROT | 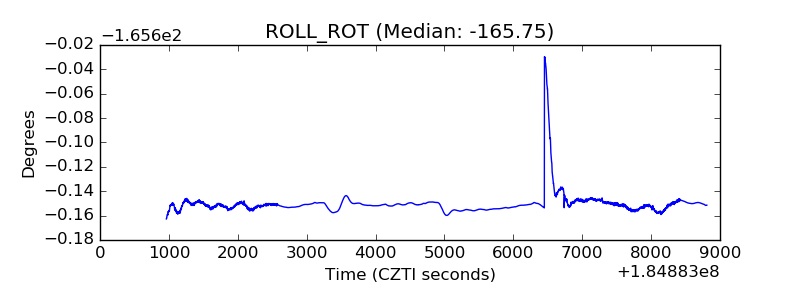 |
| _Roll_DEC | 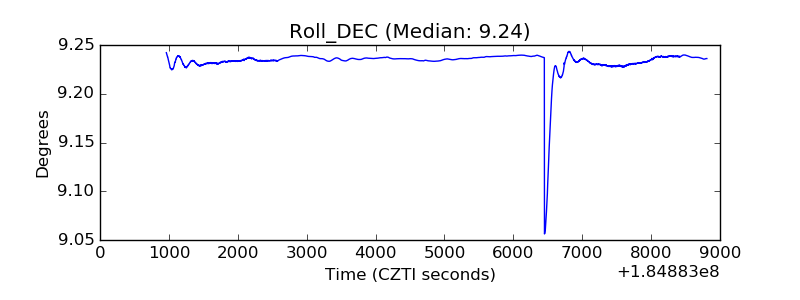 |
| _Roll_RA | 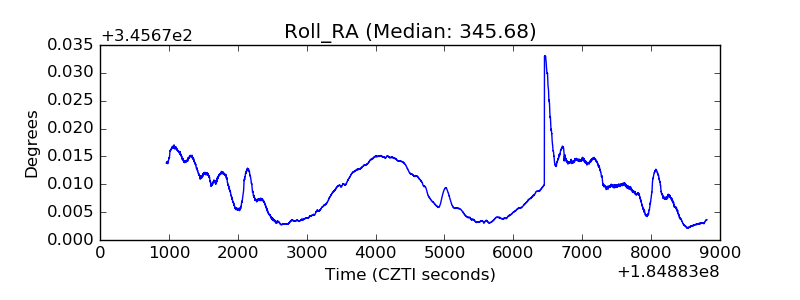 |
| Veto Counter | 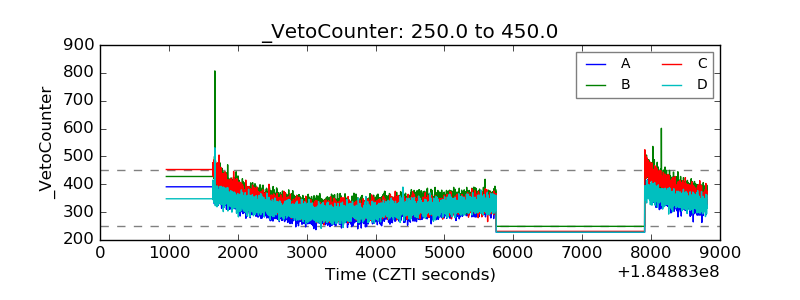 |