| Param | Original file | Final file |
|---|---|---|
| Filename | modeM0/AS1P01_126T04_9000000092_00650cztM0_level2.evt | modeM0/AS1P01_126T04_9000000092_00650cztM0_level2_quad_clean.evt |
| Size (bytes) | 764,147,520 | 43,600,320 |
| Size | 728.7 MB | 41.6 MB |
| Events in quadrant A | 5,748,023 | 244,102 |
| Events in quadrant B | 5,881,068 | 250,942 |
| Events in quadrant C | 5,410,592 | 243,962 |
| Events in quadrant D | 5,773,073 | 233,456 |
| Mode SS | |||
|---|---|---|---|
| Quadrant | BADHDUFLAG | Total packets | Discarded packets |
| A | 0 | 100 | 0 |
| B | 0 | 100 | 0 |
| C | 0 | 100 | 0 |
| D | 0 | 100 | 0 |
| Mode M0 | |||
|---|---|---|---|
| Quadrant | BADHDUFLAG | Total packets | Discarded packets |
| A | 0 | 20566 | 2 |
| B | 0 | 20975 | 2 |
| C | 0 | 19606 | 4 |
| D | 0 | 20676 | 2 |
| Mode M9 | |||
|---|---|---|---|
| Quadrant | BADHDUFLAG | Total packets | Discarded packets |
| A | 0 | 33 | 0 |
| B | 0 | 33 | 0 |
| C | 0 | 33 | 0 |
| D | 0 | 33 | 0 |
| Quadrant | Total seconds | Saturated seconds | Saturation percentage |
|---|---|---|---|
| A | 4951 | 12 | 0.242375% |
| B | 4951 | 17 | 0.343365% |
| C | 4950 | 2 | 0.040404% |
| D | 4950 | 51 | 1.030303% |
Noise dominated data is calculated using 1-second bins in cleaned event files. If a bin has >2000 counts, and if more than 50% of those come from <1% of pixels, then it is considered to be noise-dominated and hence unusable.
| Quadrant | # 1 sec bins | Bins with >0 counts | Bins with >2000 counts | High rate bins dominated by noise | Noise dominated (total time) | Noise dominated (detector-on time) | Marked lightcurve |
|---|---|---|---|---|---|---|---|
| A | 7106 | 4952 | 99 | 99 | 1.39% | 2.00% | 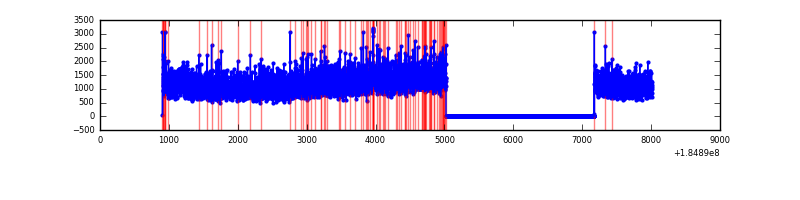 |
| B | 7106 | 4952 | 83 | 83 | 1.17% | 1.68% | 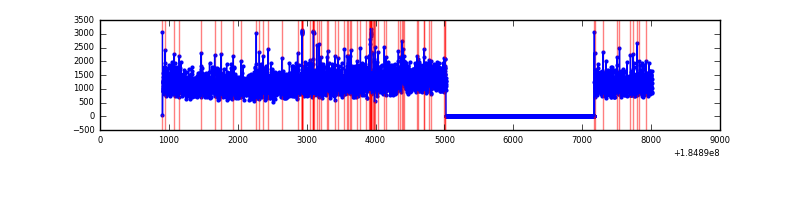 |
| C | 7105 | 4951 | 32 | 32 | 0.45% | 0.65% | 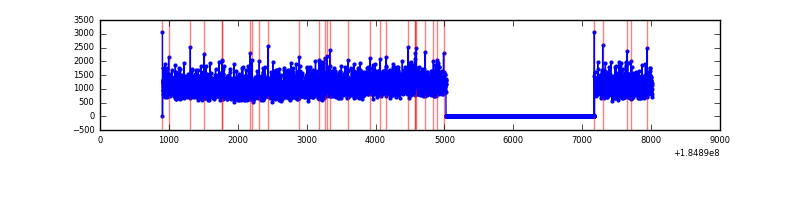 |
| D | 7105 | 4951 | 160 | 160 | 2.25% | 3.23% | 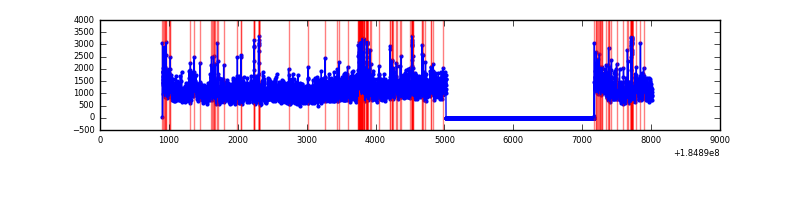 |
Top three noisy pixels from each quadrant. If the there are fewer than three noisy pixels in the level2.evt file, extra rows are filled as -1
| Pixel properties | Quadrant properties | ||||||
|---|---|---|---|---|---|---|---|
| Quadrant | DetID | PixID | Counts | Sigma | Mean | Median | Sigma |
| A | 0 | 238 | 37453 | 110.9 | 1460 | 1441 | 324.7 |
| A | 13 | 190 | 24612 | 71.36 | 1460 | 1441 | 324.7 |
| A | 15 | 171 | 21744 | 62.52 | 1460 | 1441 | 324.7 |
| B | 0 | 220 | 40855 | 113.41 | 1493 | 1504 | 347.0 |
| B | 5 | 191 | 37021 | 102.36 | 1493 | 1504 | 347.0 |
| B | 4 | 172 | 24574 | 66.49 | 1493 | 1504 | 347.0 |
| C | 9 | 52 | 36937 | 93.28 | 1361 | 1408 | 380.9 |
| C | 1 | 1 | 17632 | 42.59 | 1361 | 1408 | 380.9 |
| C | 15 | 241 | 9705 | 21.78 | 1361 | 1408 | 380.9 |
| D | 12 | 237 | 355656 | 886.05 | 1274 | 1319 | 399.9 |
| D | 13 | 221 | 141299 | 350.03 | 1274 | 1319 | 399.9 |
| D | 13 | 216 | 104296 | 257.5 | 1274 | 1319 | 399.9 |
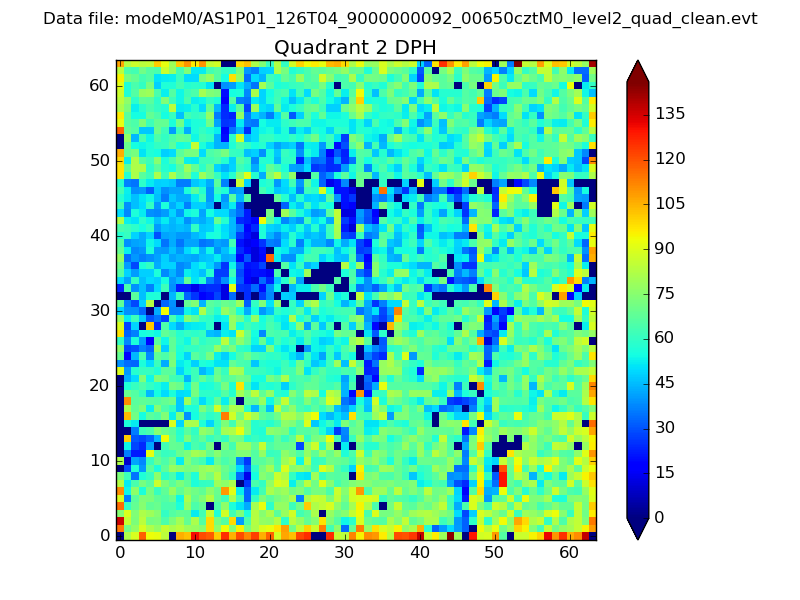
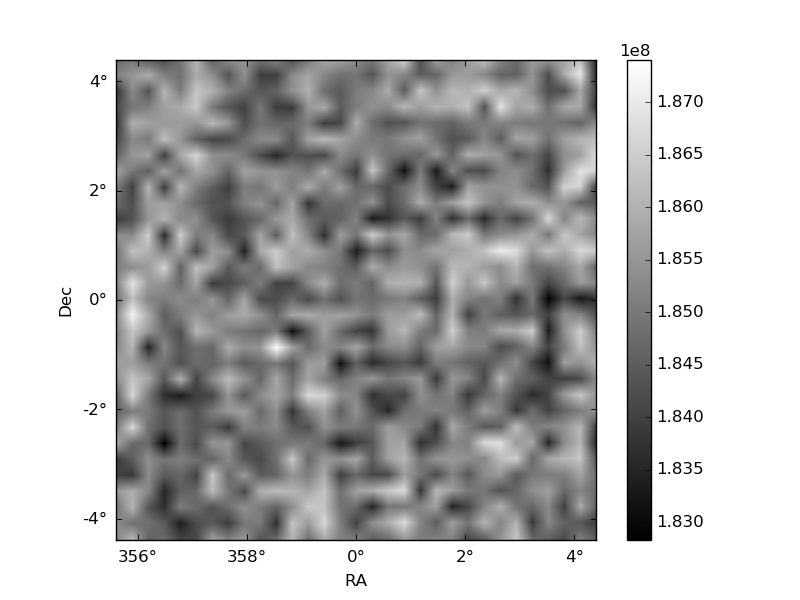
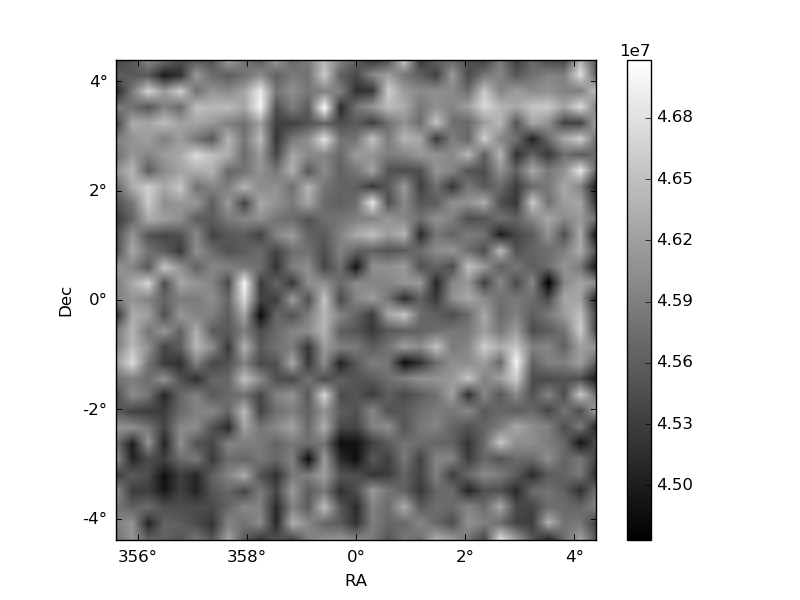
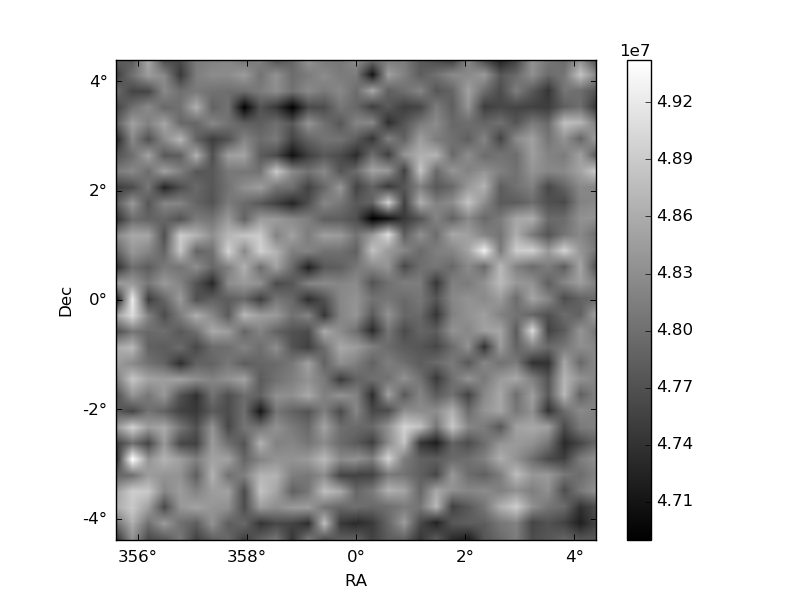
Histogram calculated using DETX and DETY for each event in the final _common_clean file
| Quadrant A | 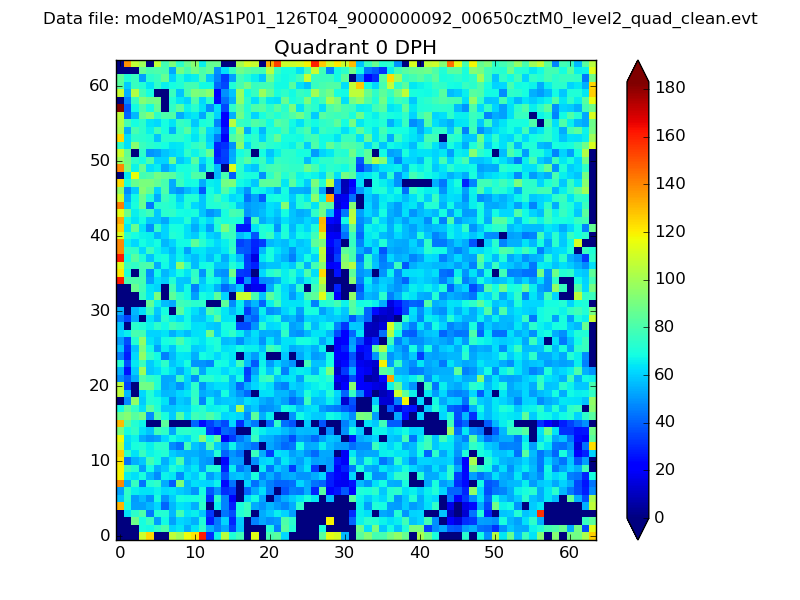 |
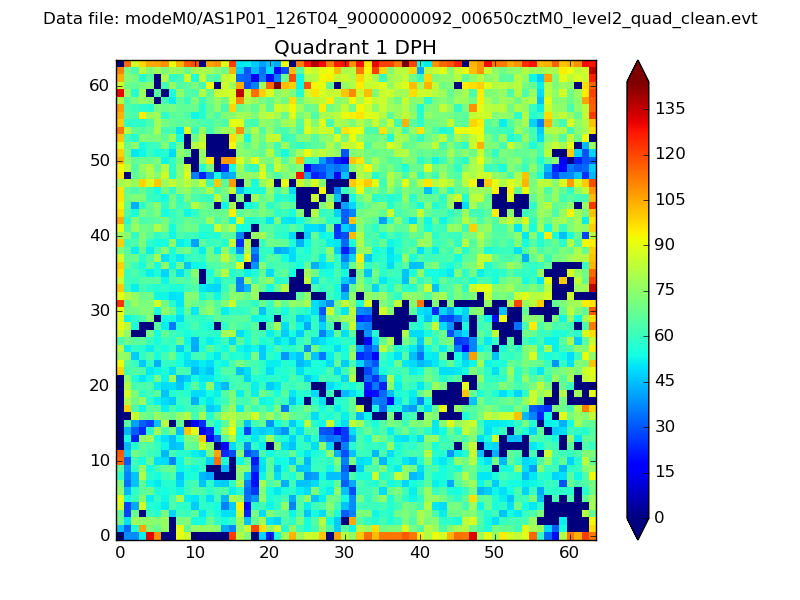 |
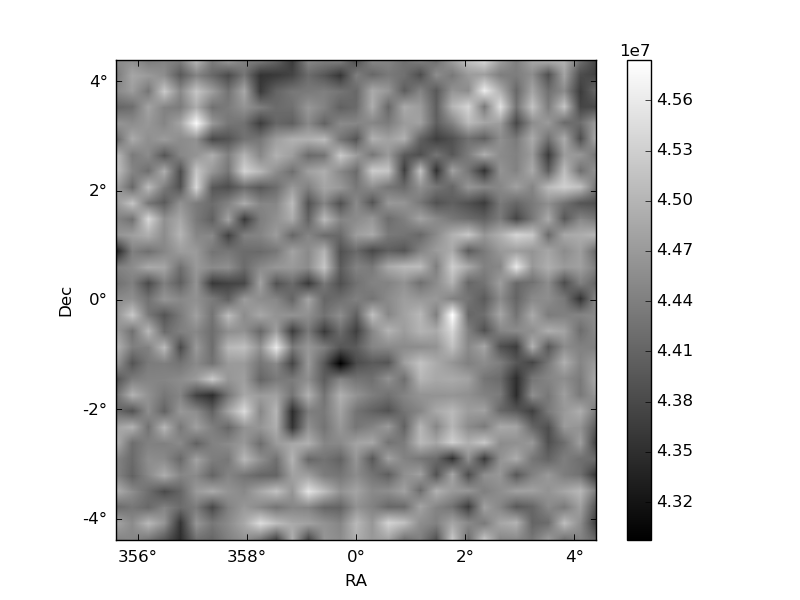
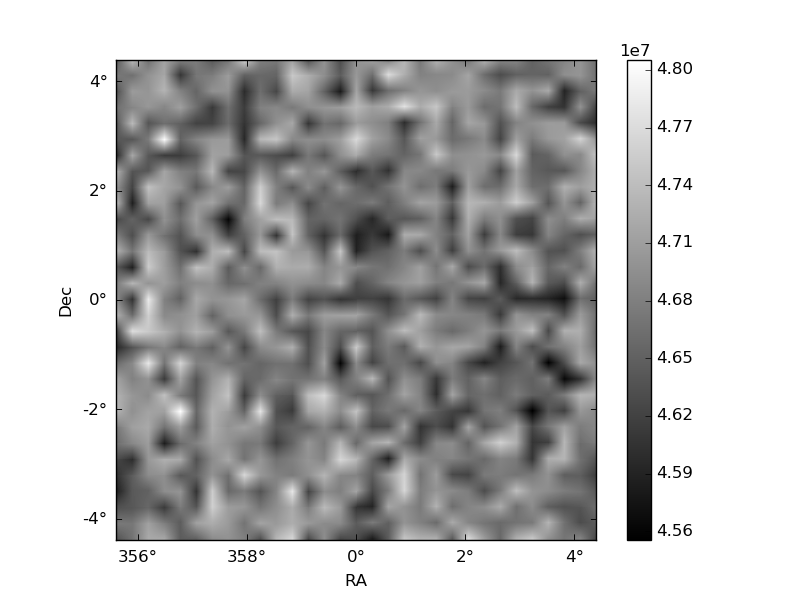
Quadrant B |
|---|---|---|---|
| Quadrant D | 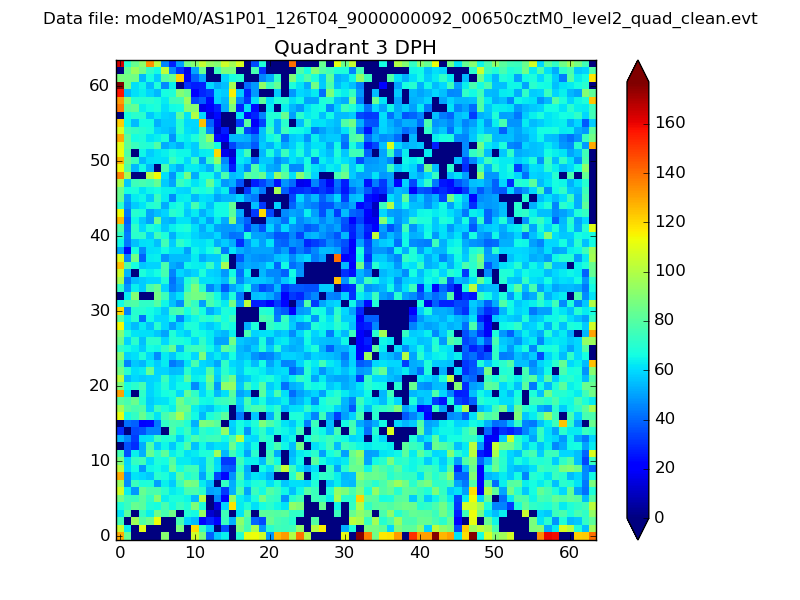 |
 |
Quadrant C |
| Plot type | Count rate plots | Images |
|---|---|---|
| Comparison with Poisson distribution Blue bars denote a histogram of data divided into 1 sec bins. Red curve is a Poisson curve with rate = median count rate of data. |
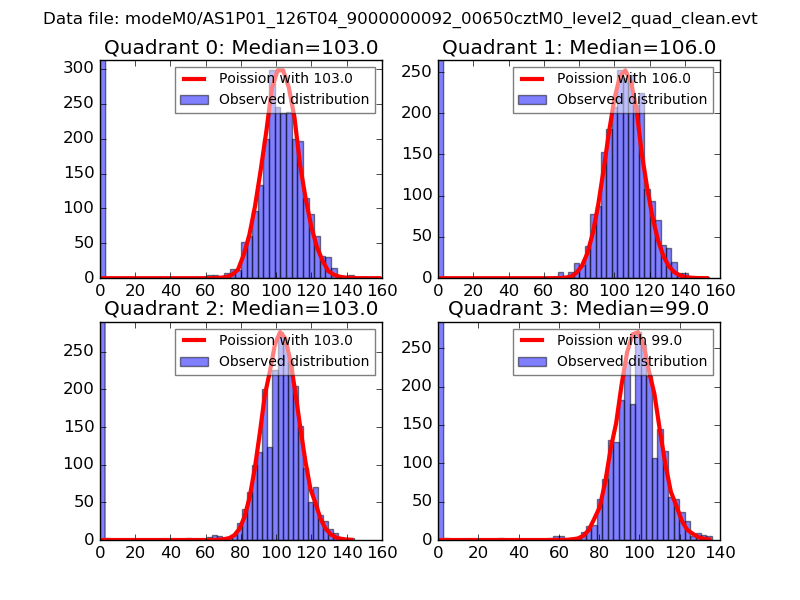 |
 |
| Quadrant-wise count rates Data is divided into 100 sec bins |
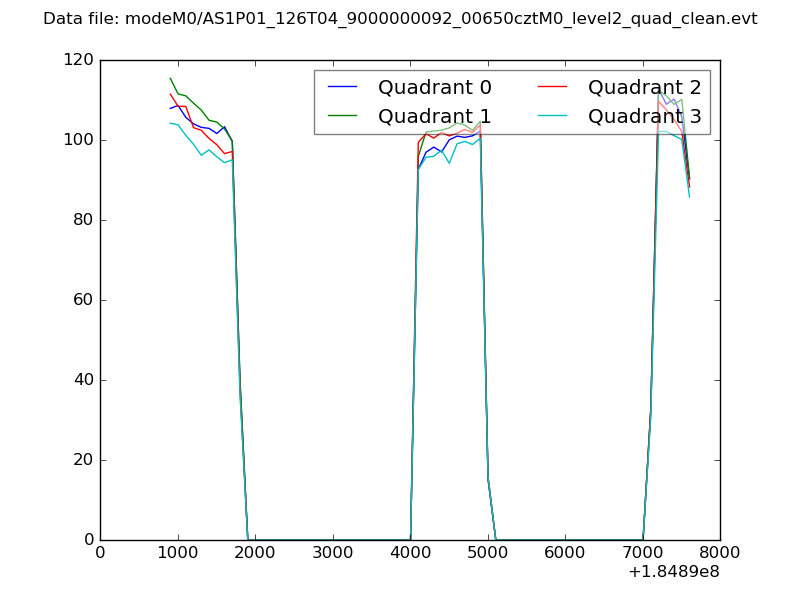 |
|
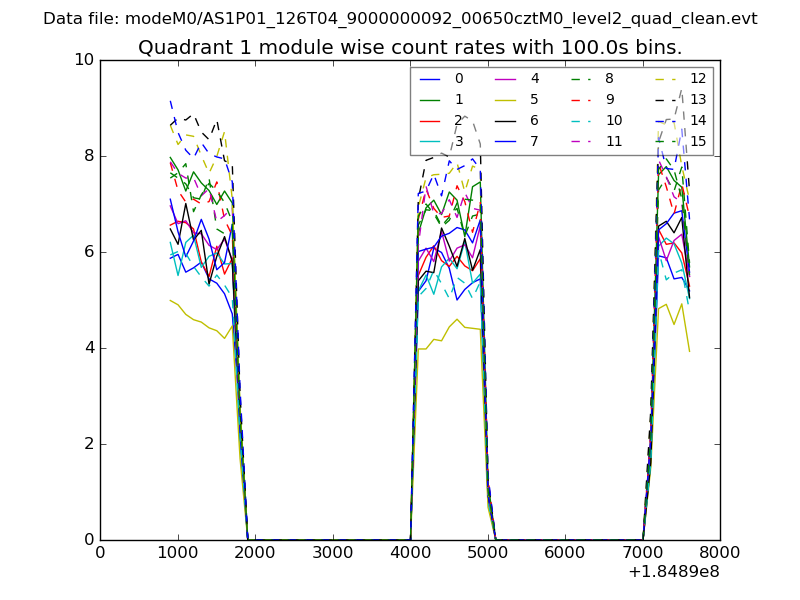
| Module-wise count rates for Quadrant A Data is divided into 100 sec bins |
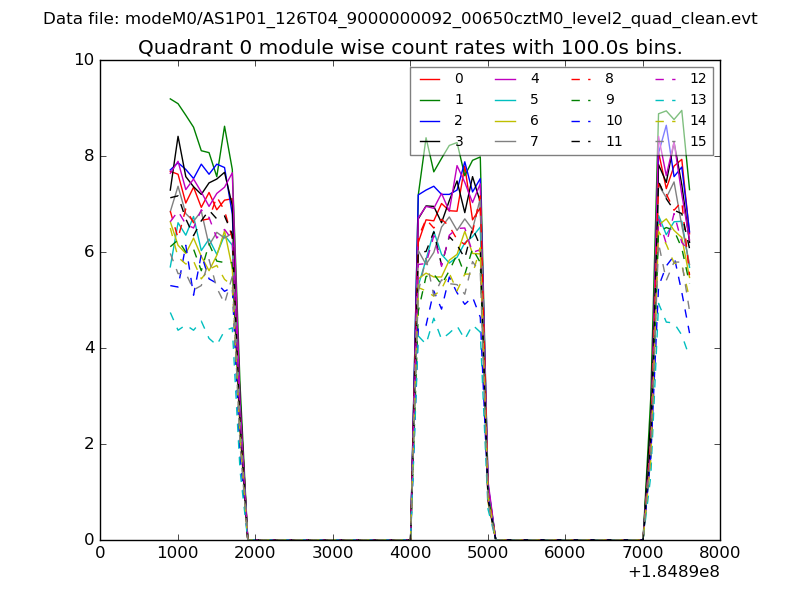 |
 |
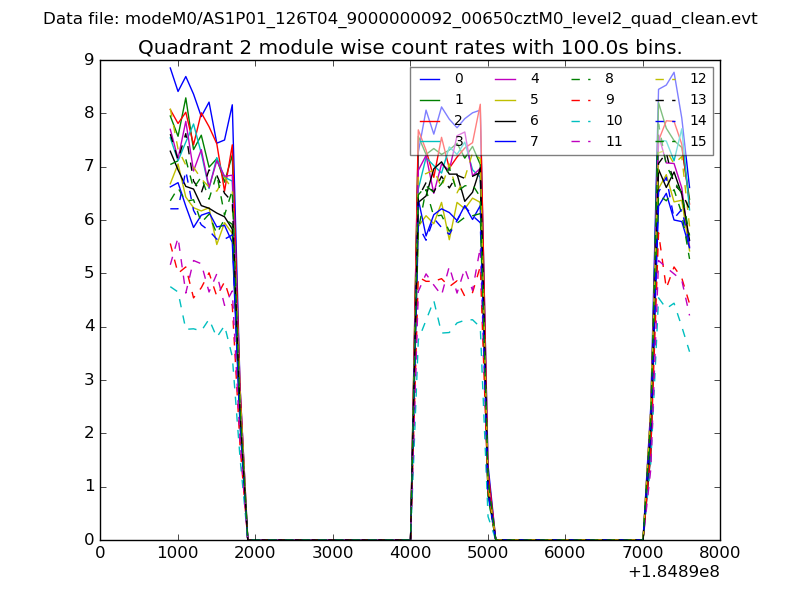
| Module-wise count rates for Quadrant B Data is divided into 100 sec bins |
 |
 |
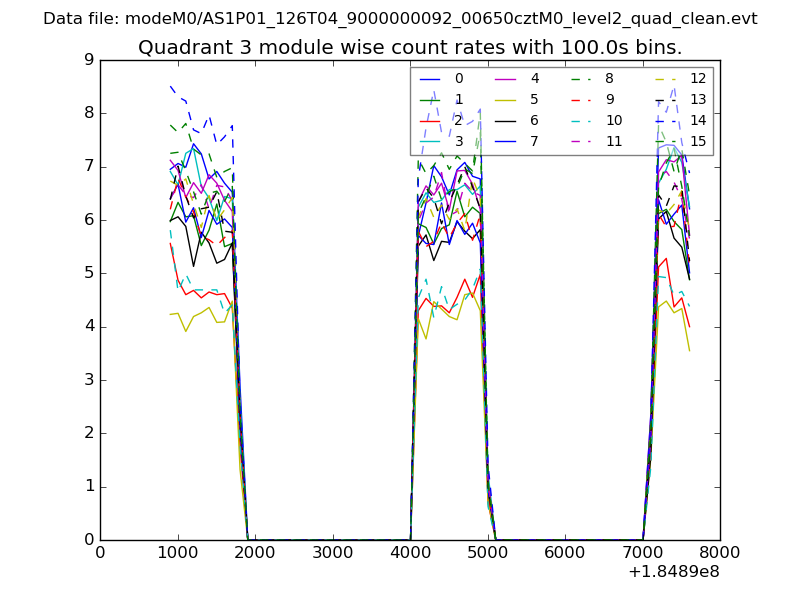
| Module-wise count rates for Quadrant C Data is divided into 100 sec bins |
 |
 |
| Module-wise count rates for Quadrant D Data is divided into 100 sec bins |
 |
 |
| Parameter | Plot |
|---|---|
| CZT HV Monitor | 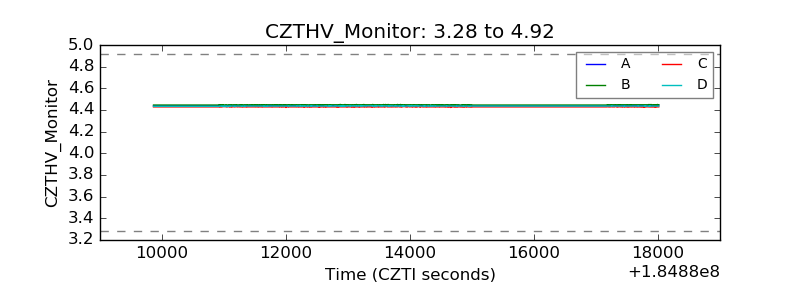 |
| D_VDD | 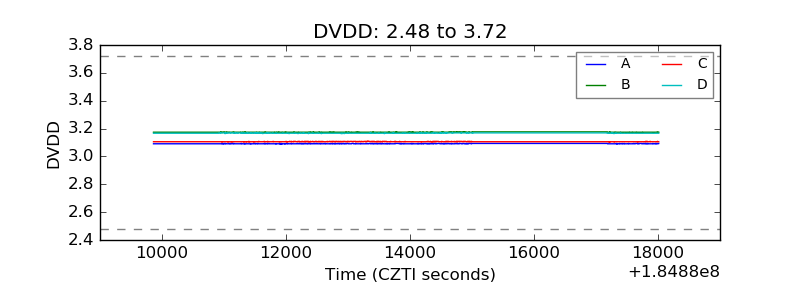 |
| Temperature 1 | 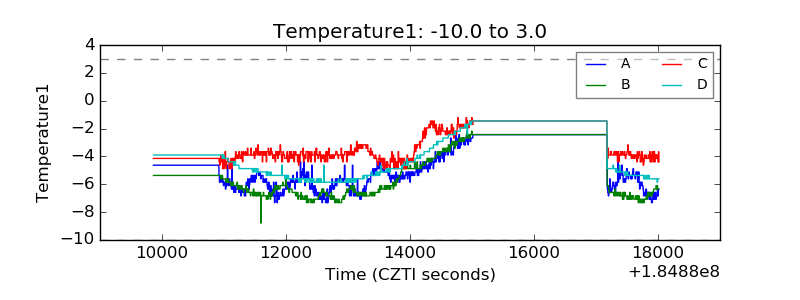 |
| Veto HV Monitor | 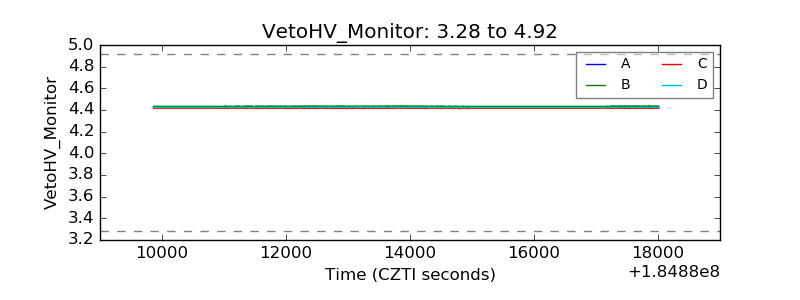 |
| Veto LLD | 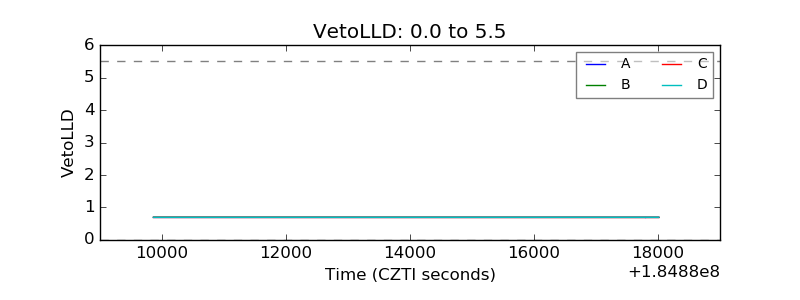 |
| Alpha Counter | 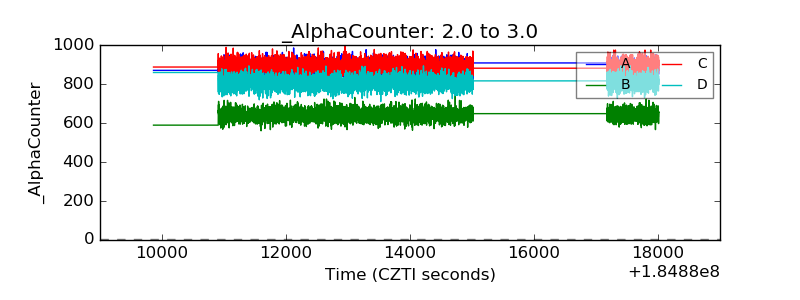 |
| _CPM_Rate | 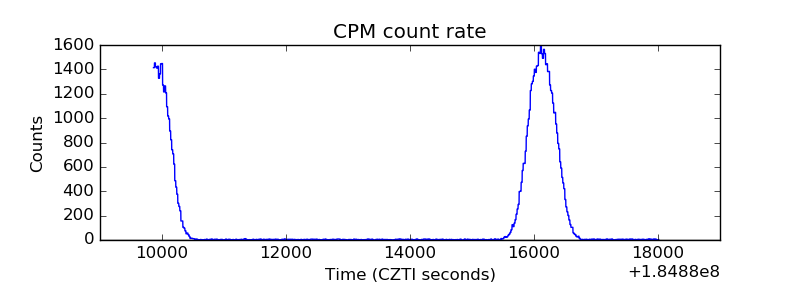 |
| CZT Counter | 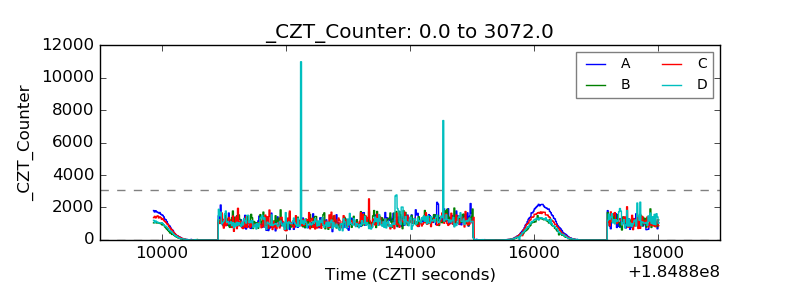 |
| +2.5 Volts monitor |  |
| +5 Volts monitor |  |
| _ROLL_ROT | 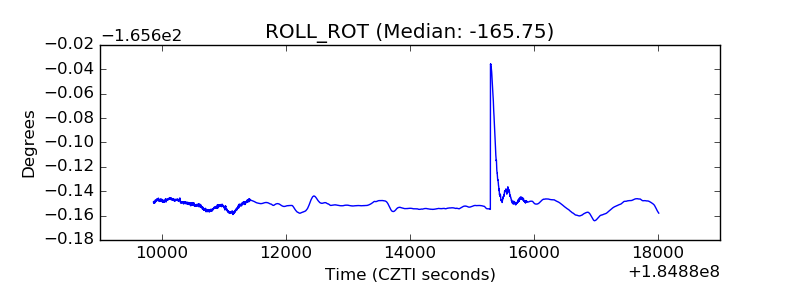 |
| _Roll_DEC | 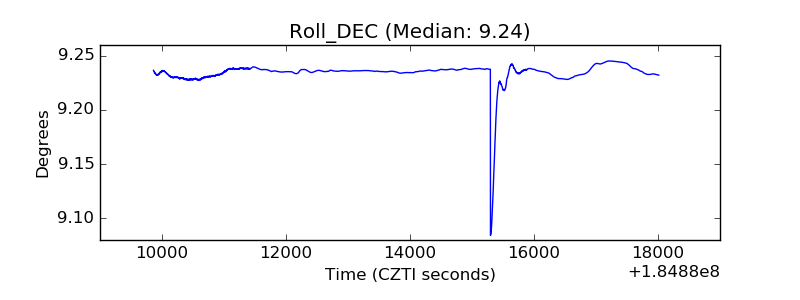 |
| _Roll_RA | 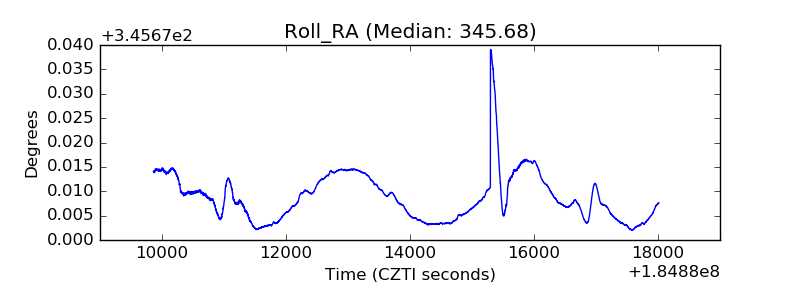 |
| Veto Counter | 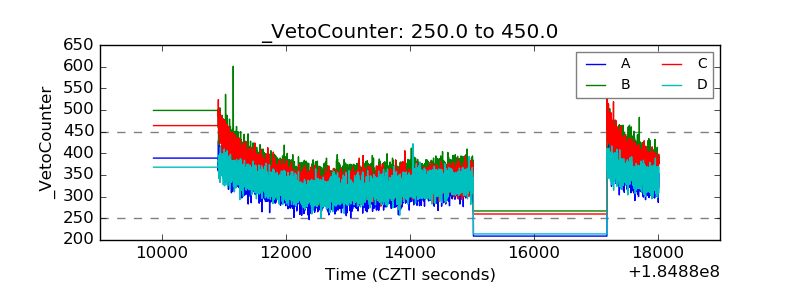 |