| Param | Original file | Final file |
|---|---|---|
| Filename | modeM0/AS1P01_126T04_9000000092_00651cztM0_level2.evt | modeM0/AS1P01_126T04_9000000092_00651cztM0_level2_quad_clean.evt |
| Size (bytes) | 819,198,720 | 38,255,040 |
| Size | 781.2 MB | 36.5 MB |
| Events in quadrant A | 6,138,592 | 199,515 |
| Events in quadrant B | 6,364,908 | 203,364 |
| Events in quadrant C | 5,757,747 | 199,832 |
| Events in quadrant D | 6,203,363 | 191,717 |
| Mode SS | |||
|---|---|---|---|
| Quadrant | BADHDUFLAG | Total packets | Discarded packets |
| A | 0 | 106 | 0 |
| B | 0 | 106 | 0 |
| C | 0 | 106 | 0 |
| D | 0 | 106 | 0 |
| Mode M0 | |||
|---|---|---|---|
| Quadrant | BADHDUFLAG | Total packets | Discarded packets |
| A | 0 | 21917 | 2 |
| B | 0 | 22573 | 2 |
| C | 0 | 20802 | 4 |
| D | 0 | 22159 | 2 |
| Mode M9 | |||
|---|---|---|---|
| Quadrant | BADHDUFLAG | Total packets | Discarded packets |
| A | 0 | 40 | 0 |
| B | 0 | 40 | 0 |
| C | 0 | 40 | 0 |
| D | 0 | 40 | 0 |
| Quadrant | Total seconds | Saturated seconds | Saturation percentage |
|---|---|---|---|
| A | 5183 | 18 | 0.347289% |
| B | 5183 | 13 | 0.250820% |
| C | 5182 | 3 | 0.057893% |
| D | 5182 | 116 | 2.238518% |
Noise dominated data is calculated using 1-second bins in cleaned event files. If a bin has >2000 counts, and if more than 50% of those come from <1% of pixels, then it is considered to be noise-dominated and hence unusable.
| Quadrant | # 1 sec bins | Bins with >0 counts | Bins with >2000 counts | High rate bins dominated by noise | Noise dominated (total time) | Noise dominated (detector-on time) | Marked lightcurve |
|---|---|---|---|---|---|---|---|
| A | 7339 | 5184 | 121 | 121 | 1.65% | 2.33% | 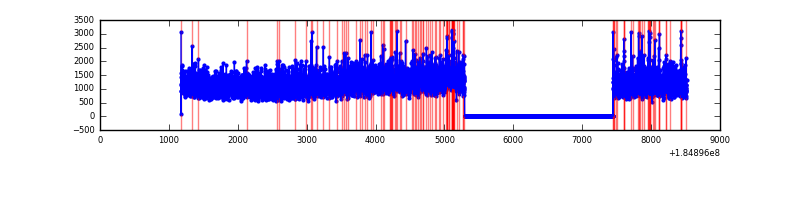 |
| B | 7339 | 5184 | 123 | 123 | 1.68% | 2.37% | 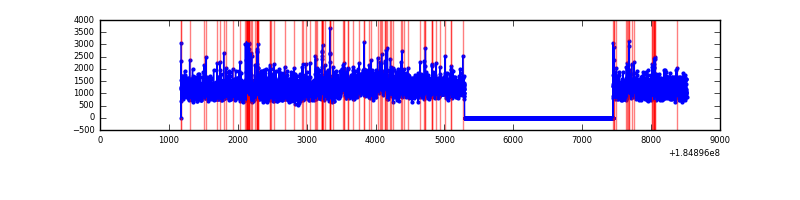 |
| C | 7338 | 5183 | 38 | 38 | 0.52% | 0.73% | 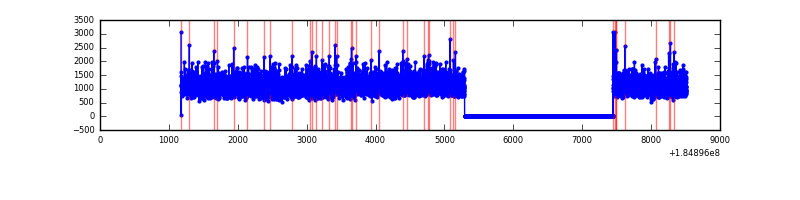 |
| D | 7338 | 5183 | 297 | 297 | 4.05% | 5.73% | 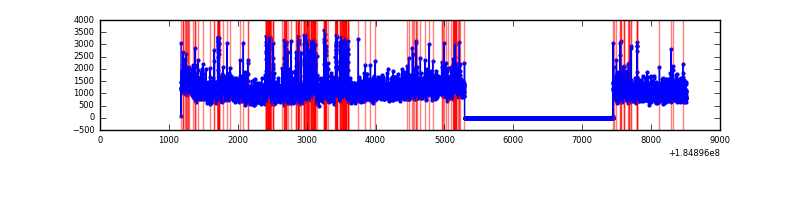 |
Top three noisy pixels from each quadrant. If the there are fewer than three noisy pixels in the level2.evt file, extra rows are filled as -1
| Pixel properties | Quadrant properties | ||||||
|---|---|---|---|---|---|---|---|
| Quadrant | DetID | PixID | Counts | Sigma | Mean | Median | Sigma |
| A | 14 | 79 | 95685 | 272.16 | 1554 | 1539 | 345.9 |
| A | 0 | 69 | 15944 | 41.64 | 1554 | 1539 | 345.9 |
| A | 13 | 190 | 13055 | 33.29 | 1554 | 1539 | 345.9 |
| B | 4 | 172 | 139527 | 374.92 | 1576 | 1589 | 367.9 |
| B | 5 | 191 | 93473 | 249.74 | 1576 | 1589 | 367.9 |
| B | 7 | 221 | 23277 | 58.95 | 1576 | 1589 | 367.9 |
| C | 9 | 52 | 77987 | 190.78 | 1438 | 1492 | 401.0 |
| C | 15 | 241 | 8818 | 18.27 | 1438 | 1492 | 401.0 |
| C | 9 | 188 | 8574 | 17.66 | 1438 | 1492 | 401.0 |
| D | 1 | 4 | 460496 | 1085.82 | 1355 | 1410 | 422.8 |
| D | 12 | 237 | 162349 | 380.65 | 1355 | 1410 | 422.8 |
| D | 13 | 221 | 116123 | 271.32 | 1355 | 1410 | 422.8 |
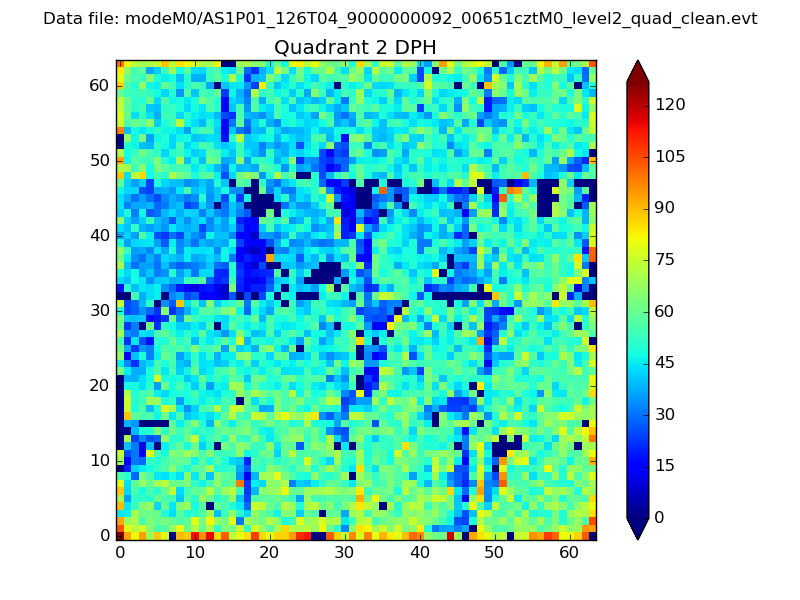
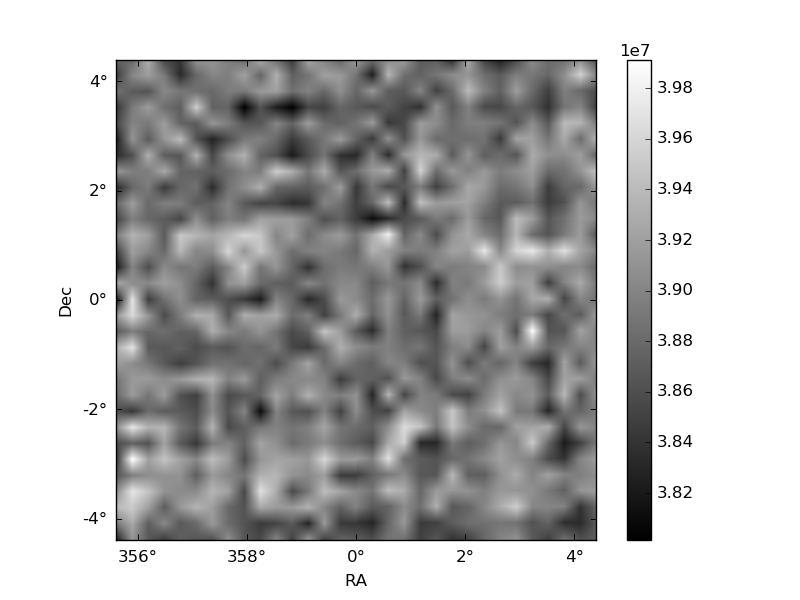
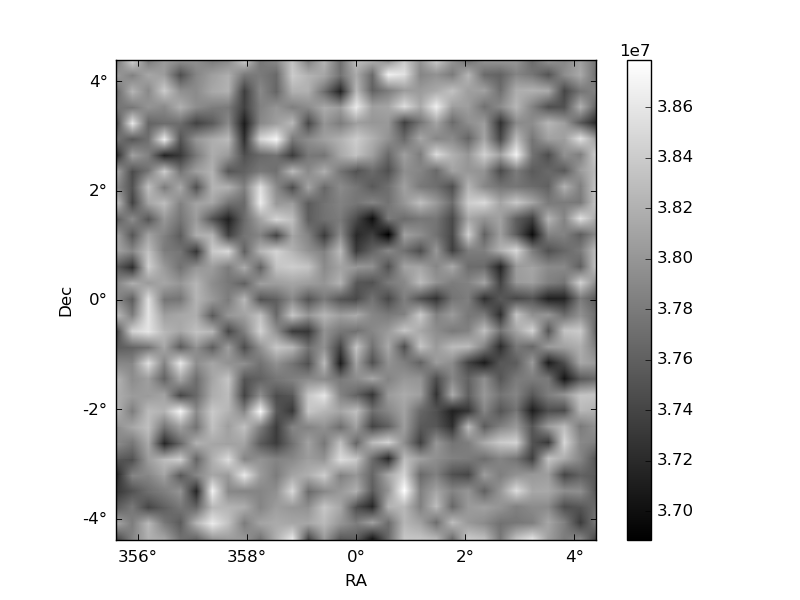
Histogram calculated using DETX and DETY for each event in the final _common_clean file
| Quadrant A | 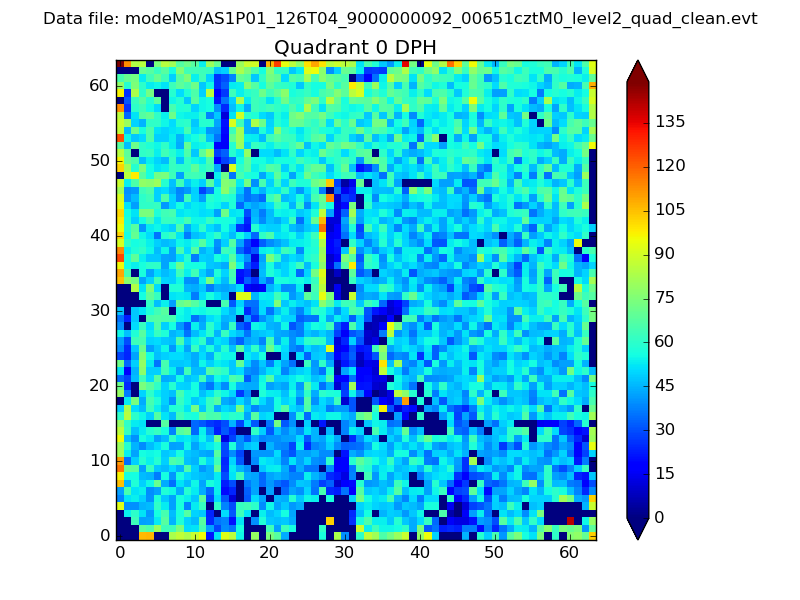 |
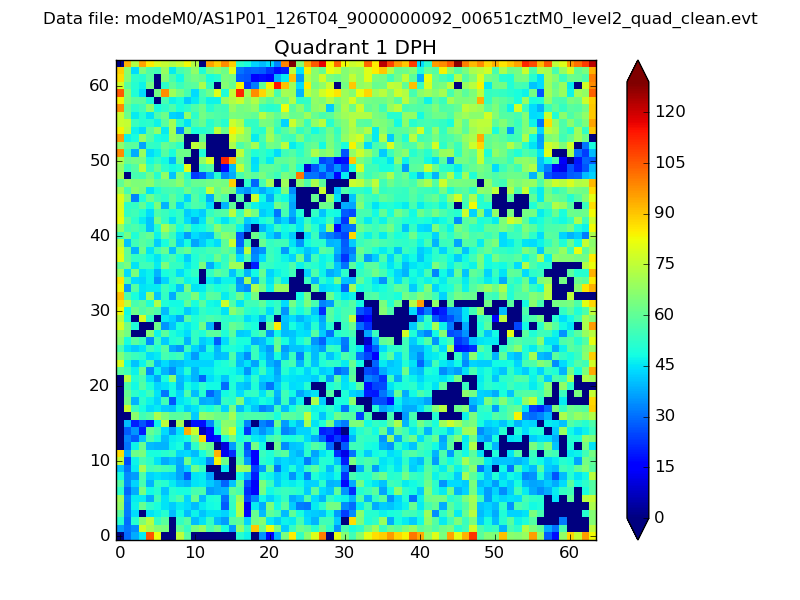 |
Quadrant B |
|---|---|---|---|
| Quadrant D | 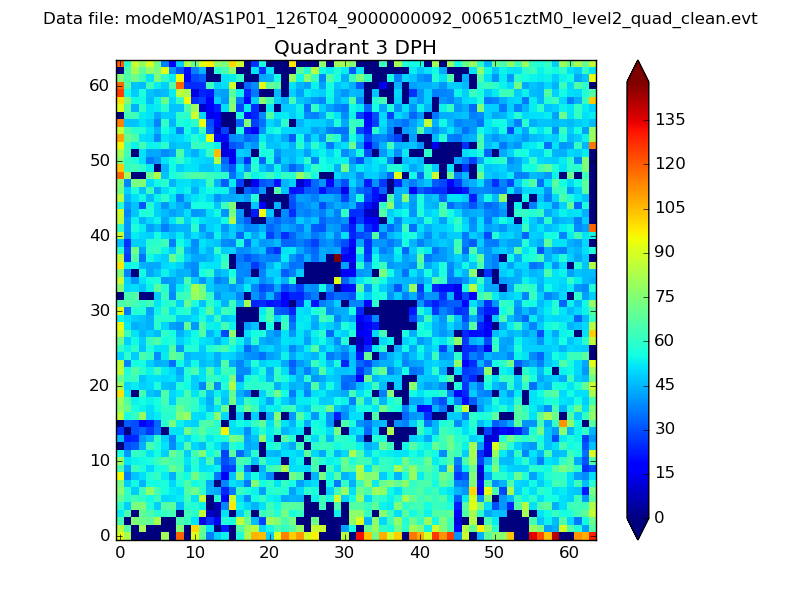 |
 |
Quadrant C |
| Plot type | Count rate plots | Images |
|---|---|---|
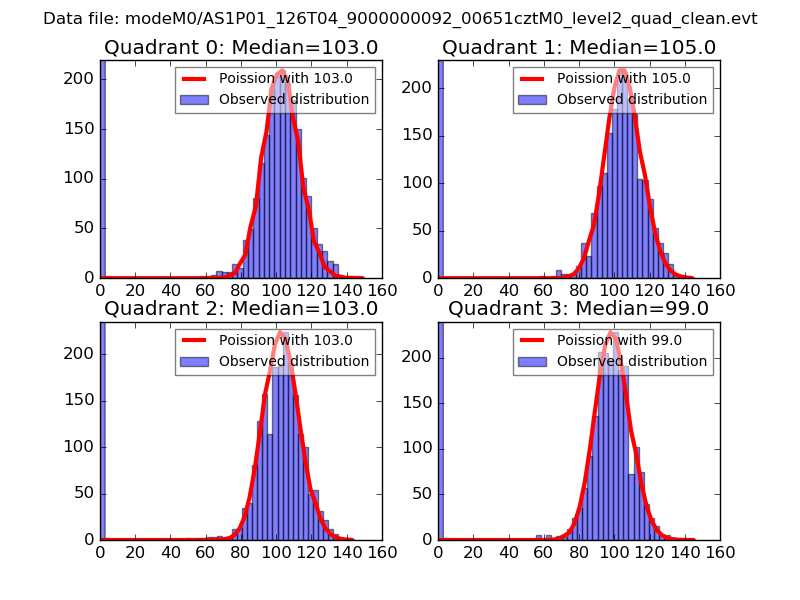
| Comparison with Poisson distribution Blue bars denote a histogram of data divided into 1 sec bins. Red curve is a Poisson curve with rate = median count rate of data. |
 |
 |
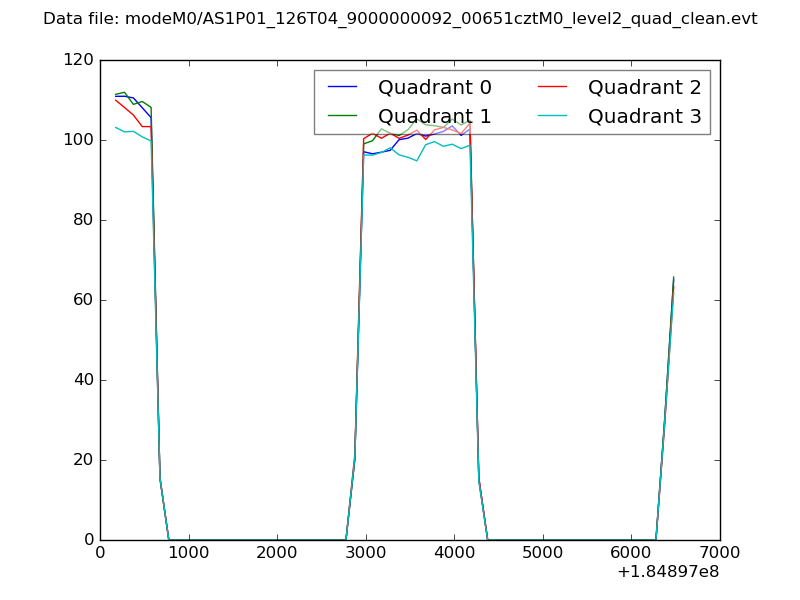
| Quadrant-wise count rates Data is divided into 100 sec bins |
 |
|
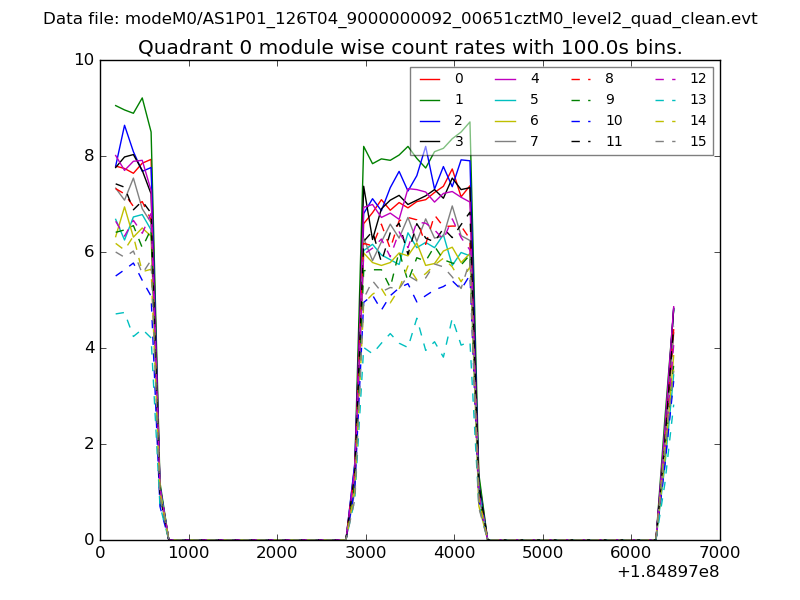
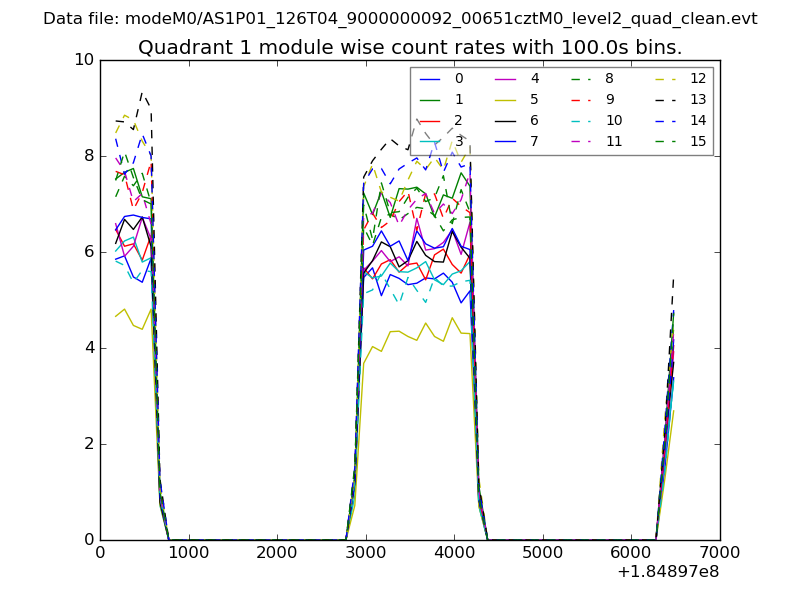
| Module-wise count rates for Quadrant A Data is divided into 100 sec bins |
 |
 |
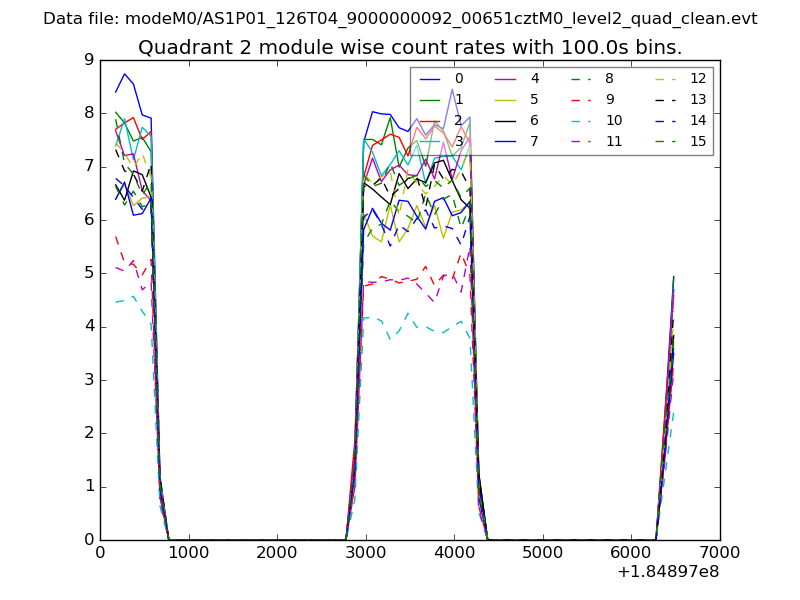
| Module-wise count rates for Quadrant B Data is divided into 100 sec bins |
 |
 |
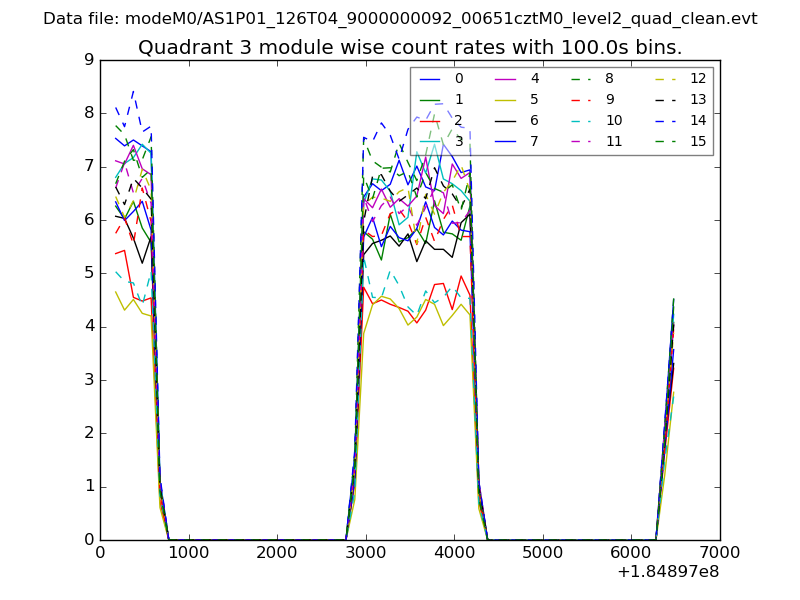
| Module-wise count rates for Quadrant C Data is divided into 100 sec bins |
 |
 |
| Module-wise count rates for Quadrant D Data is divided into 100 sec bins |
 |
 |
| Parameter | Plot |
|---|---|
| CZT HV Monitor | 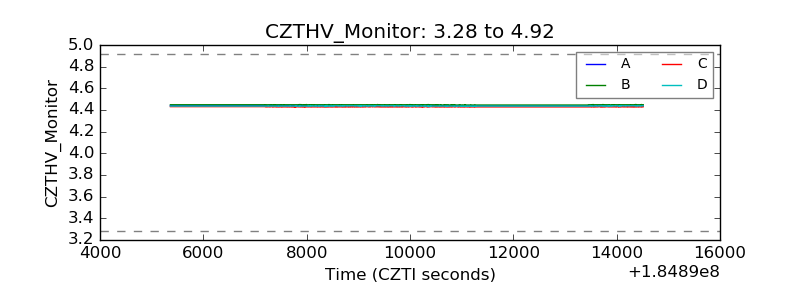 |
| D_VDD | 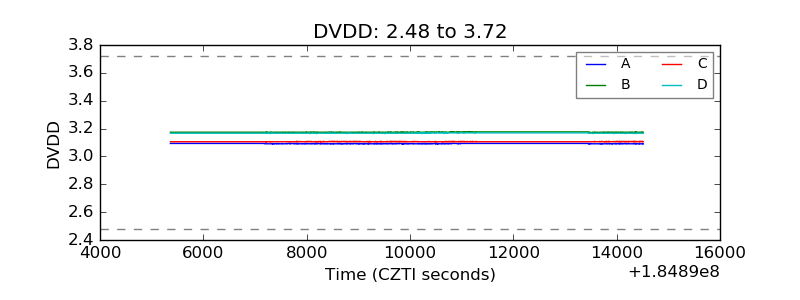 |
| Temperature 1 | 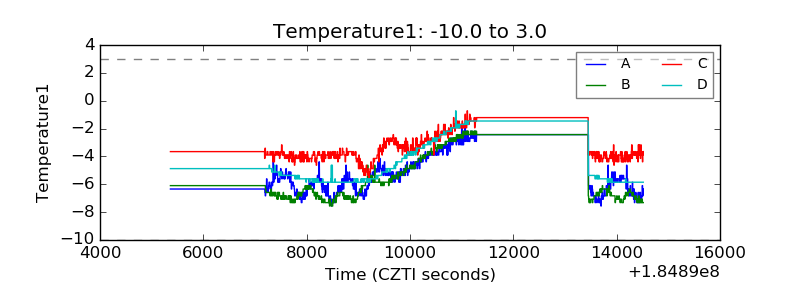 |
| Veto HV Monitor | 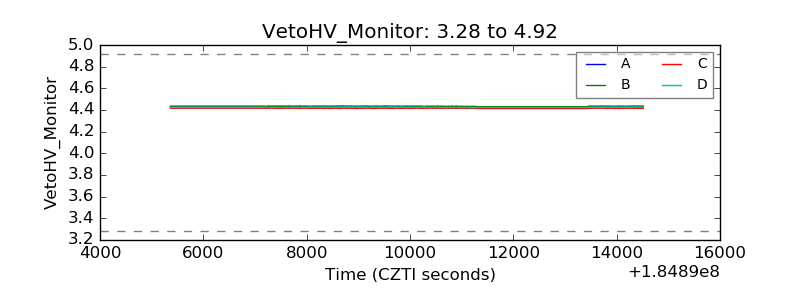 |
| Veto LLD | 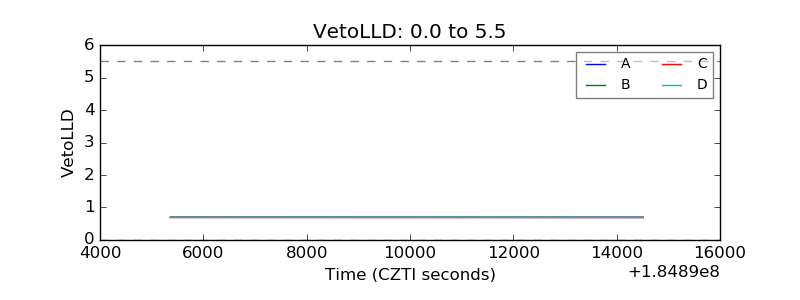 |
| Alpha Counter | 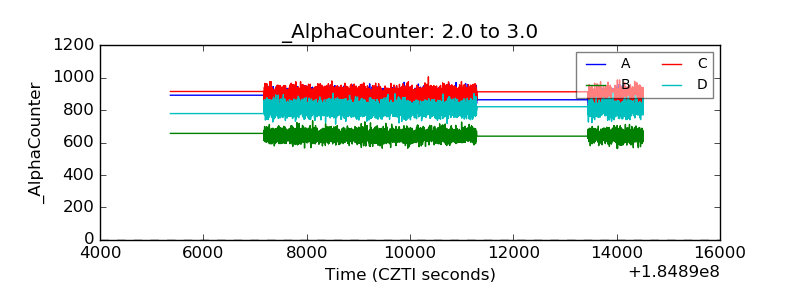 |
| _CPM_Rate | 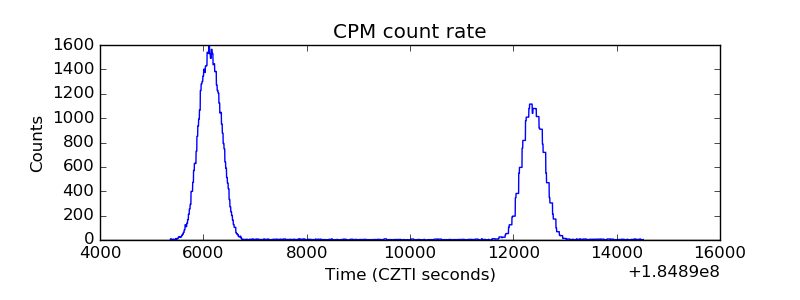 |
| CZT Counter | 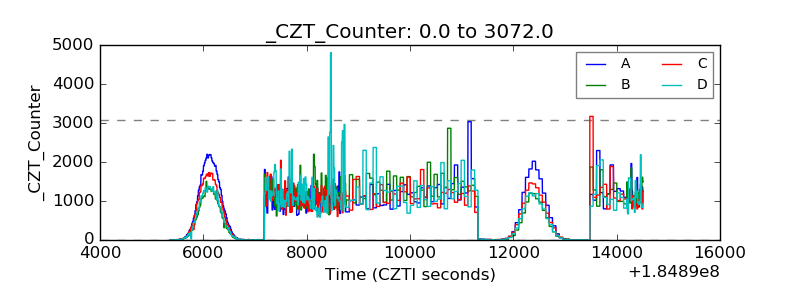 |
| +2.5 Volts monitor |  |
| +5 Volts monitor | 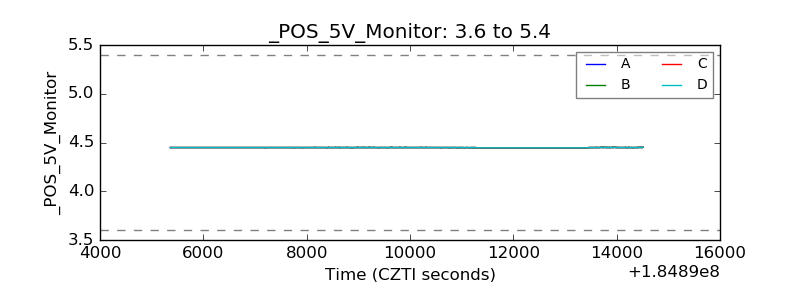 |
| _ROLL_ROT | 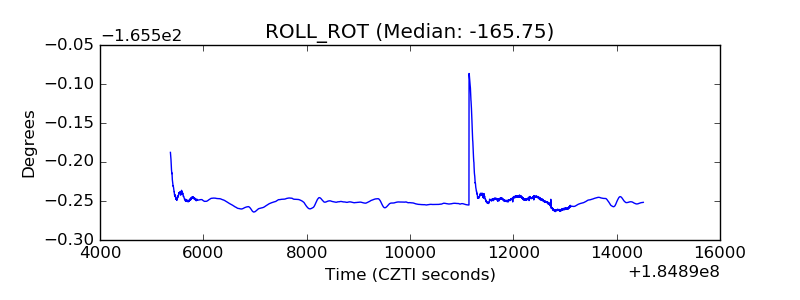 |
| _Roll_DEC | 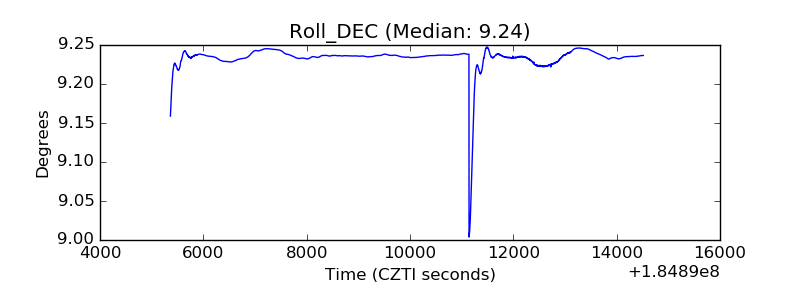 |
| _Roll_RA | 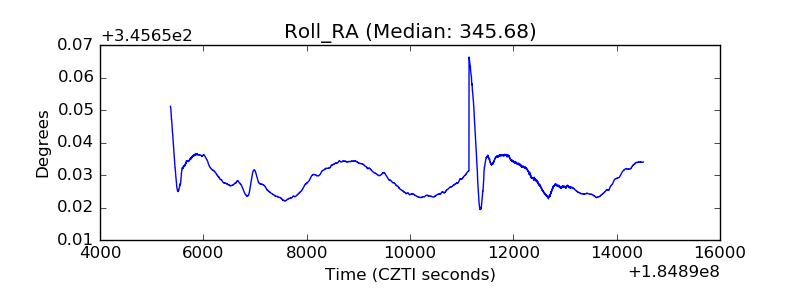 |
| Veto Counter | 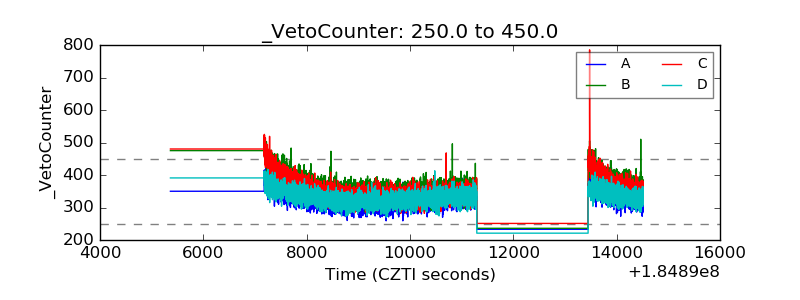 |