| Param | Original file | Final file |
|---|---|---|
| Filename | modeM0/AS1P01_126T04_9000000092_00652cztM0_level2.evt | modeM0/AS1P01_126T04_9000000092_00652cztM0_level2_quad_clean.evt |
| Size (bytes) | 815,022,720 | 35,870,400 |
| Size | 777.3 MB | 34.2 MB |
| Events in quadrant A | 6,272,057 | 181,950 |
| Events in quadrant B | 6,383,473 | 185,726 |
| Events in quadrant C | 5,608,023 | 185,977 |
| Events in quadrant D | 6,079,268 | 173,209 |
| Mode SS | |||
|---|---|---|---|
| Quadrant | BADHDUFLAG | Total packets | Discarded packets |
| A | 0 | 106 | 0 |
| B | 0 | 106 | 0 |
| C | 0 | 106 | 0 |
| D | 0 | 106 | 0 |
| Mode M0 | |||
|---|---|---|---|
| Quadrant | BADHDUFLAG | Total packets | Discarded packets |
| A | 0 | 22251 | 2 |
| B | 0 | 22576 | 2 |
| C | 0 | 20289 | 2 |
| D | 0 | 21730 | 4 |
| Mode M9 | |||
|---|---|---|---|
| Quadrant | BADHDUFLAG | Total packets | Discarded packets |
| A | 0 | 22 | 0 |
| B | 0 | 22 | 0 |
| C | 0 | 22 | 0 |
| D | 0 | 22 | 0 |
| Quadrant | Total seconds | Saturated seconds | Saturation percentage |
|---|---|---|---|
| A | 5111 | 18 | 0.352182% |
| B | 5111 | 15 | 0.293485% |
| C | 5111 | 4 | 0.078263% |
| D | 5110 | 103 | 2.015656% |
Noise dominated data is calculated using 1-second bins in cleaned event files. If a bin has >2000 counts, and if more than 50% of those come from <1% of pixels, then it is considered to be noise-dominated and hence unusable.
| Quadrant | # 1 sec bins | Bins with >0 counts | Bins with >2000 counts | High rate bins dominated by noise | Noise dominated (total time) | Noise dominated (detector-on time) | Marked lightcurve |
|---|---|---|---|---|---|---|---|
| A | 7267 | 5112 | 172 | 172 | 2.37% | 3.36% | 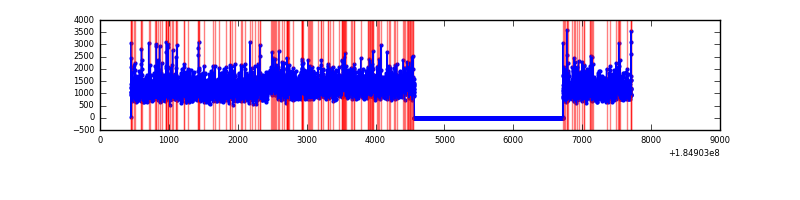 |
| B | 7267 | 5112 | 158 | 158 | 2.17% | 3.09% | 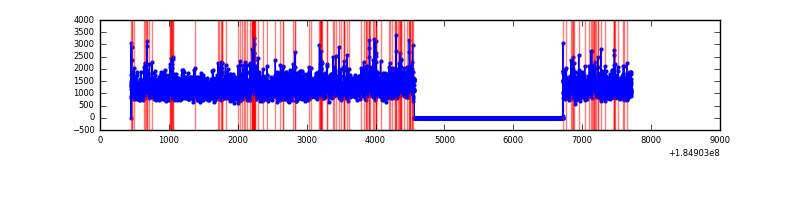 |
| C | 7267 | 5112 | 41 | 41 | 0.56% | 0.80% | 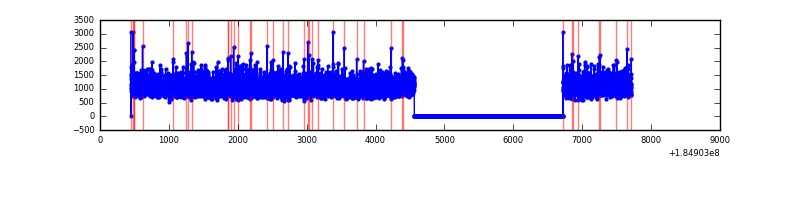 |
| D | 7266 | 5111 | 227 | 227 | 3.12% | 4.44% | 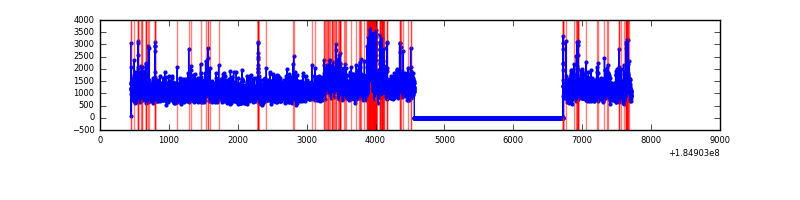 |
Top three noisy pixels from each quadrant. If the there are fewer than three noisy pixels in the level2.evt file, extra rows are filled as -1
| Pixel properties | Quadrant properties | ||||||
|---|---|---|---|---|---|---|---|
| Quadrant | DetID | PixID | Counts | Sigma | Mean | Median | Sigma |
| A | 14 | 79 | 82065 | 232.87 | 1561 | 1547 | 345.8 |
| A | 0 | 69 | 53560 | 150.43 | 1561 | 1547 | 345.8 |
| A | 0 | 238 | 49763 | 139.45 | 1561 | 1547 | 345.8 |
| B | 7 | 221 | 244661 | 660.36 | 1562 | 1573 | 368.1 |
| B | 4 | 172 | 106676 | 285.52 | 1562 | 1573 | 368.1 |
| B | 15 | 82 | 17112 | 42.21 | 1562 | 1573 | 368.1 |
| C | 9 | 52 | 19935 | 46.86 | 1414 | 1466 | 394.1 |
| C | 15 | 241 | 9371 | 20.06 | 1414 | 1466 | 394.1 |
| C | 9 | 188 | 8543 | 17.96 | 1414 | 1466 | 394.1 |
| D | 1 | 4 | 315438 | 733.75 | 1353 | 1407 | 428.0 |
| D | 13 | 221 | 123994 | 286.43 | 1353 | 1407 | 428.0 |
| D | 12 | 22 | 90462 | 208.08 | 1353 | 1407 | 428.0 |
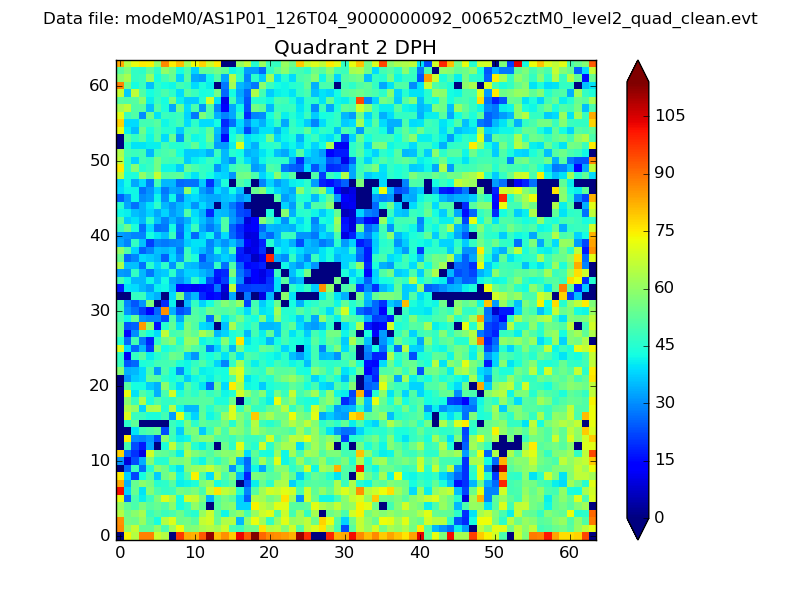
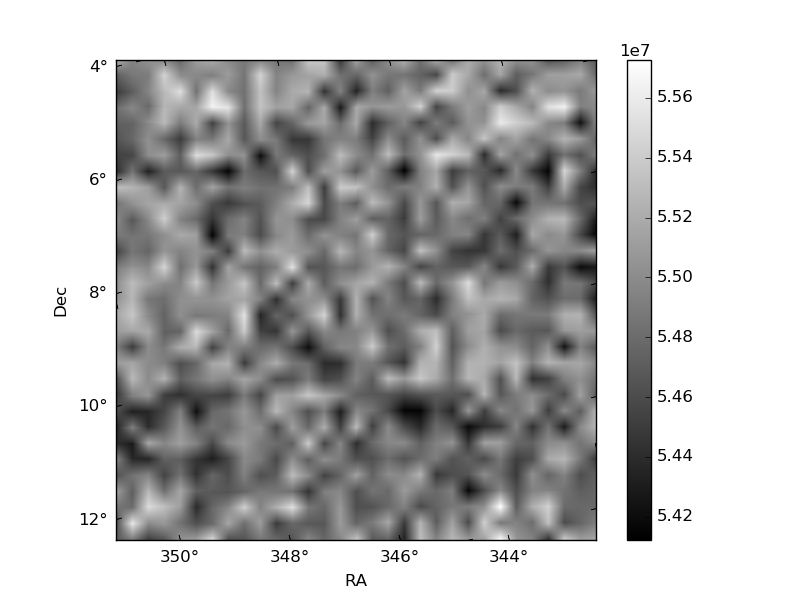
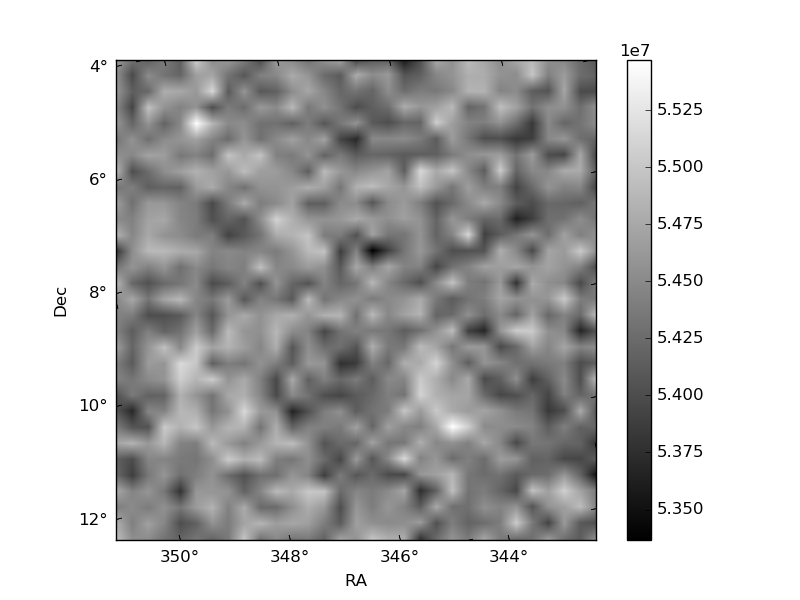
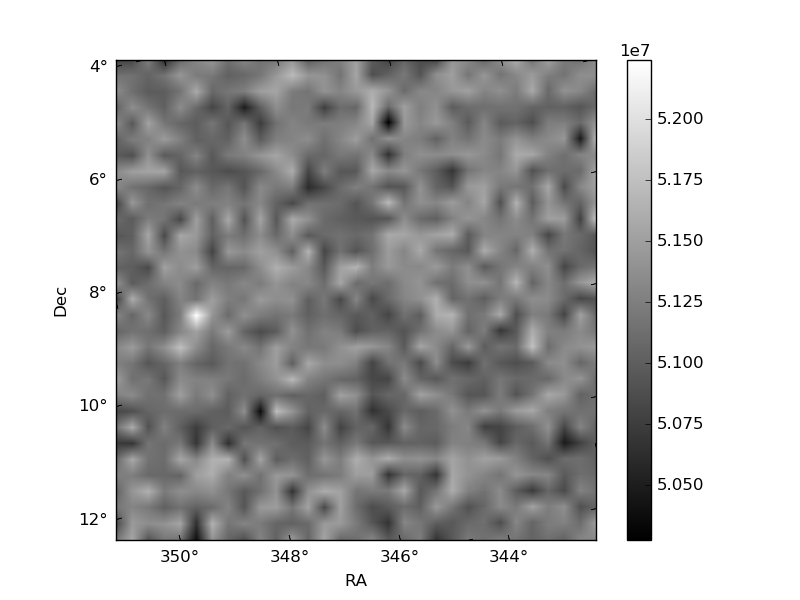
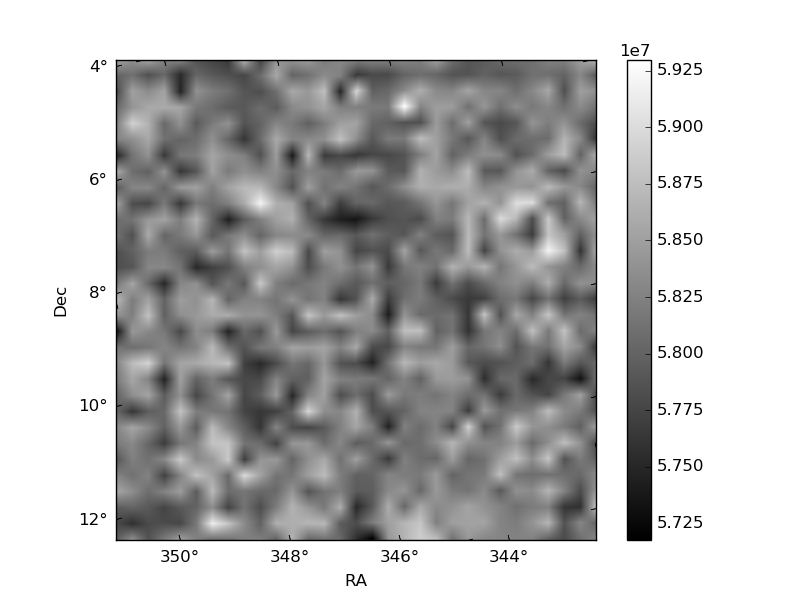
Histogram calculated using DETX and DETY for each event in the final _common_clean file
| Quadrant A | 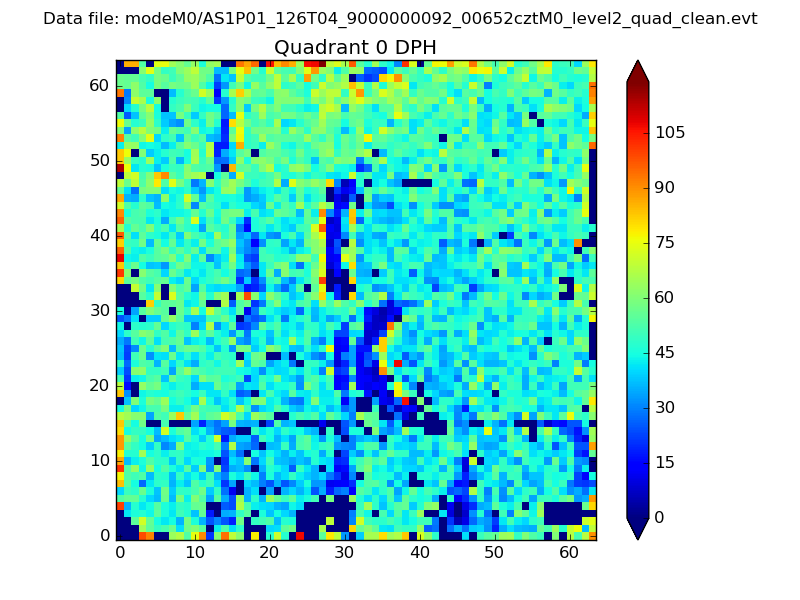 |
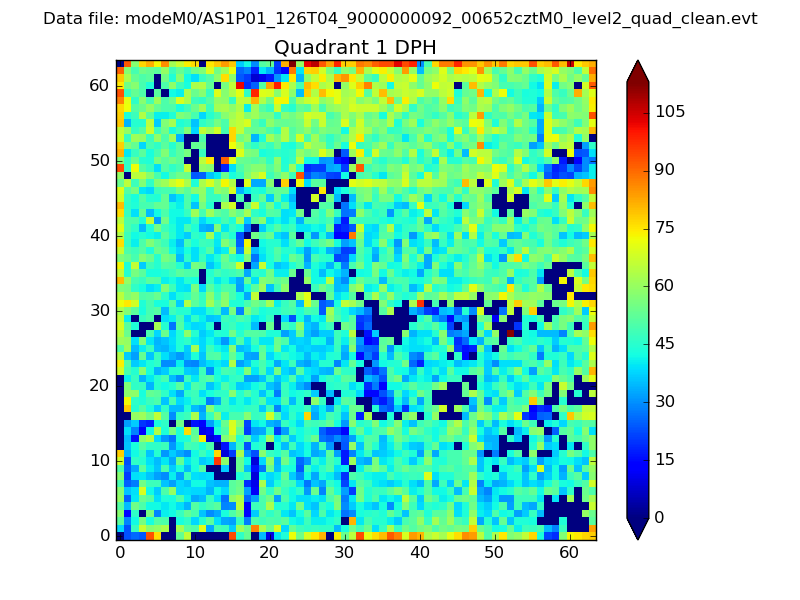 |
Quadrant B |
|---|---|---|---|
| Quadrant D | 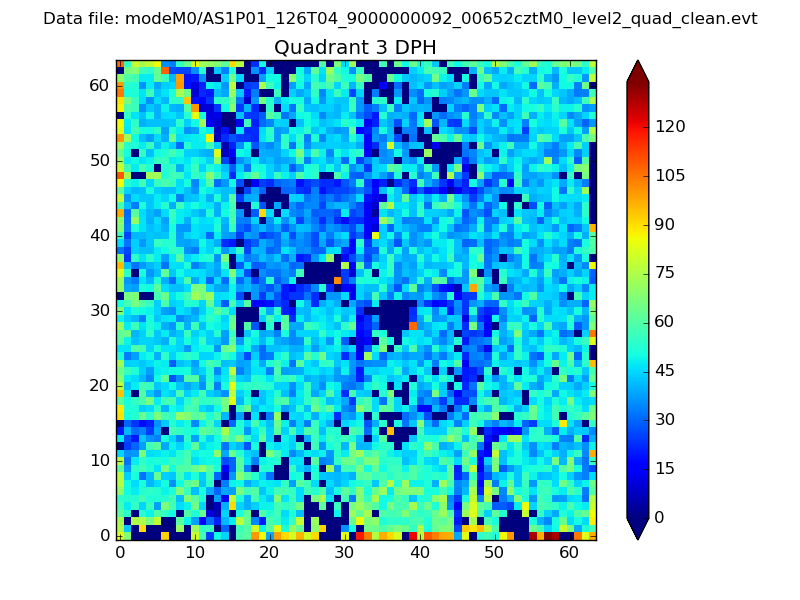 |
 |
Quadrant C |
| Plot type | Count rate plots | Images |
|---|---|---|
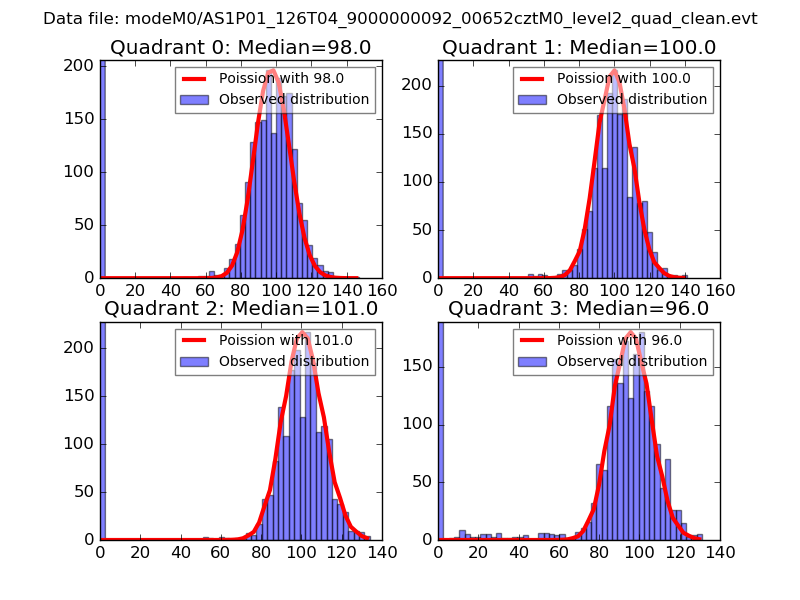
| Comparison with Poisson distribution Blue bars denote a histogram of data divided into 1 sec bins. Red curve is a Poisson curve with rate = median count rate of data. |
 |
 |
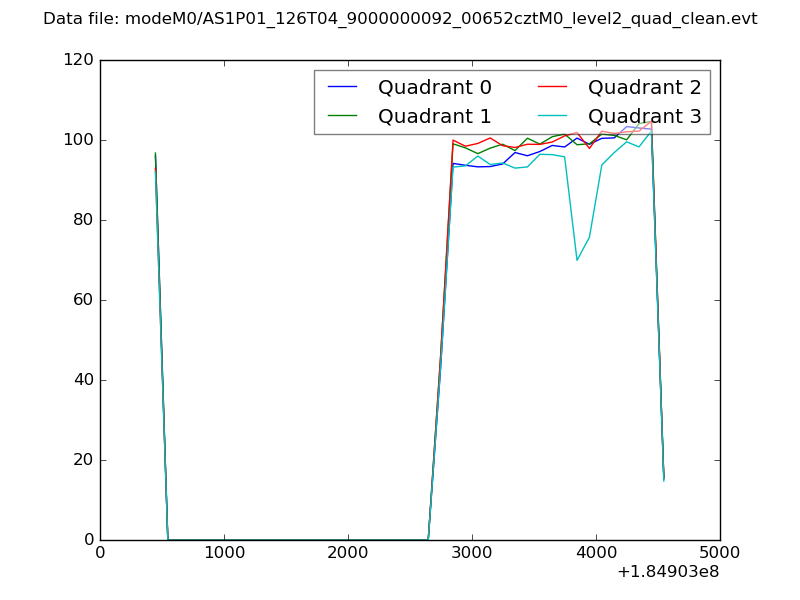
| Quadrant-wise count rates Data is divided into 100 sec bins |
 |
|
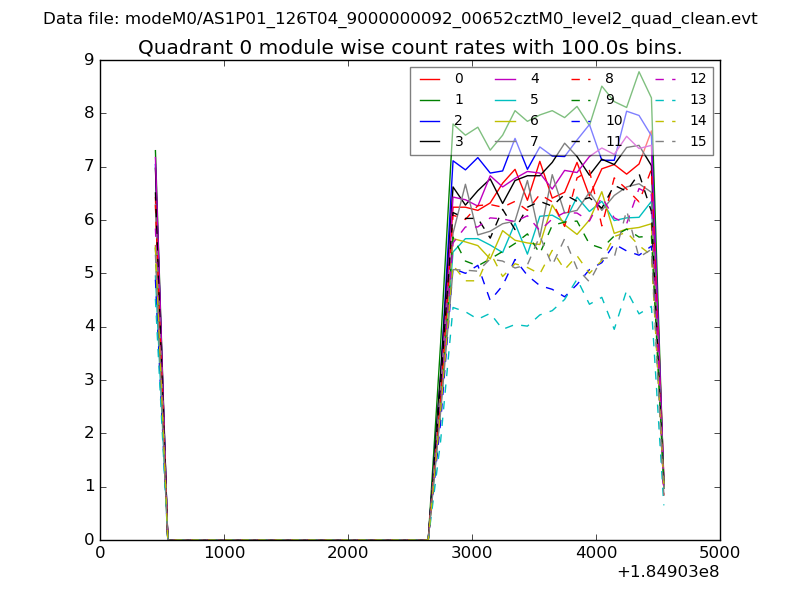
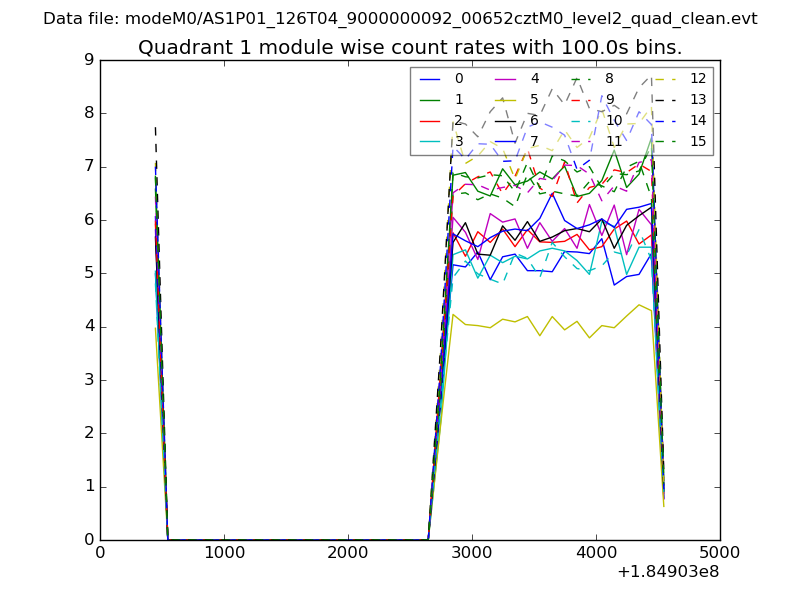
| Module-wise count rates for Quadrant A Data is divided into 100 sec bins |
 |
 |
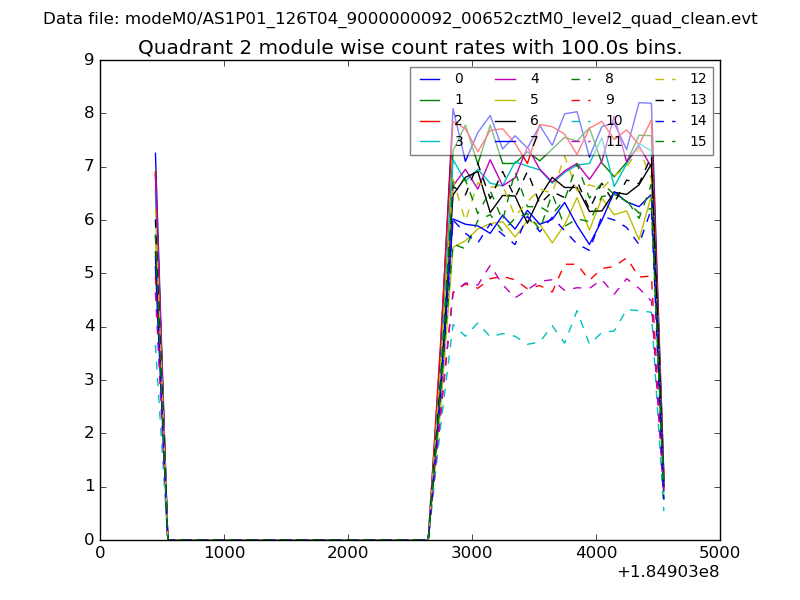
| Module-wise count rates for Quadrant B Data is divided into 100 sec bins |
 |
 |
| Module-wise count rates for Quadrant C Data is divided into 100 sec bins |
 |
 |
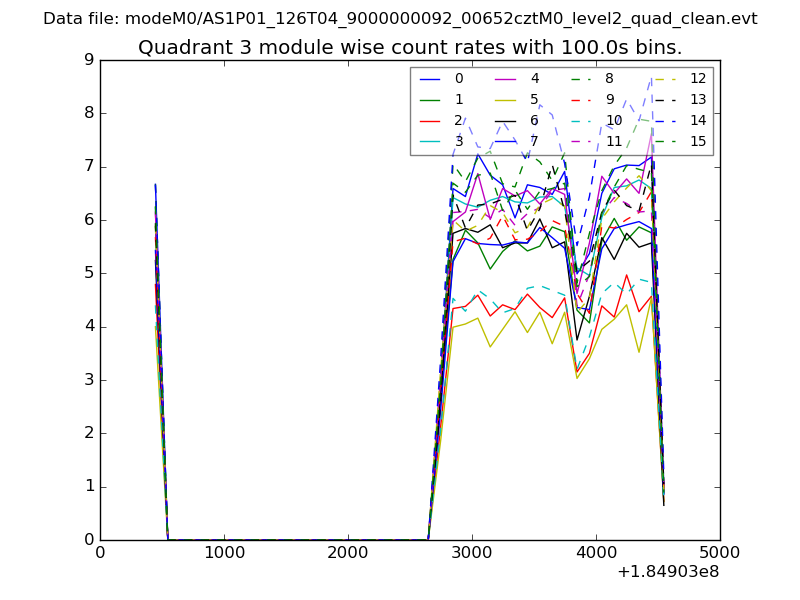
| Module-wise count rates for Quadrant D Data is divided into 100 sec bins |
 |
 |
| Parameter | Plot |
|---|---|
| CZT HV Monitor | 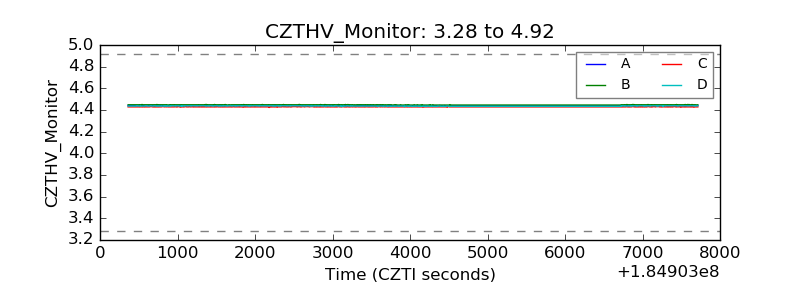 |
| D_VDD | 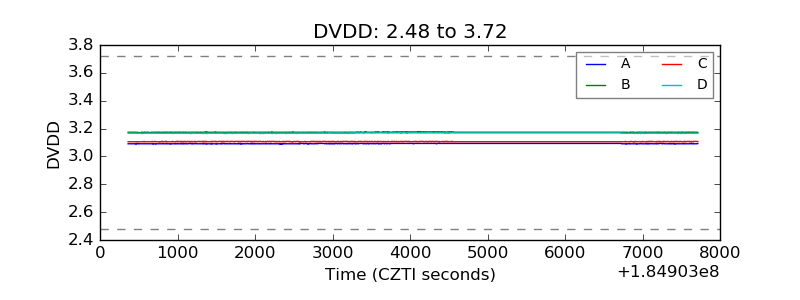 |
| Temperature 1 | 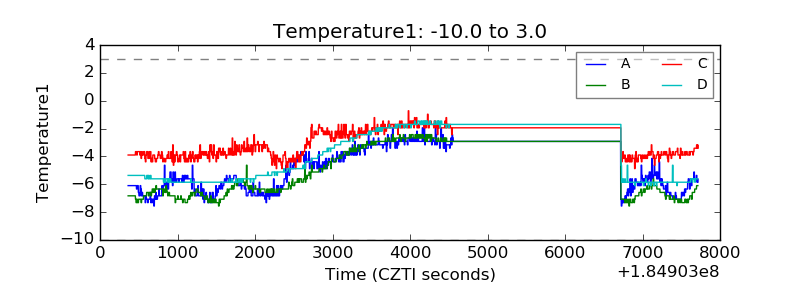 |
| Veto HV Monitor | 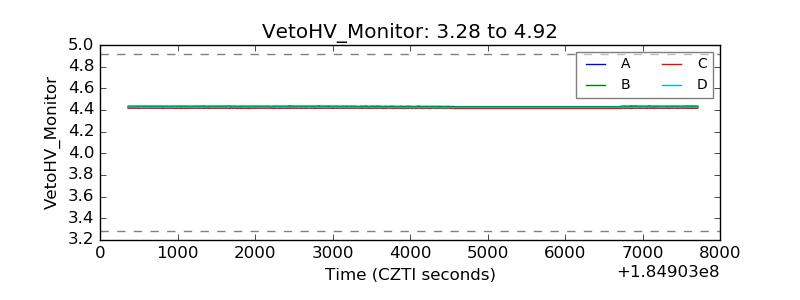 |
| Veto LLD | 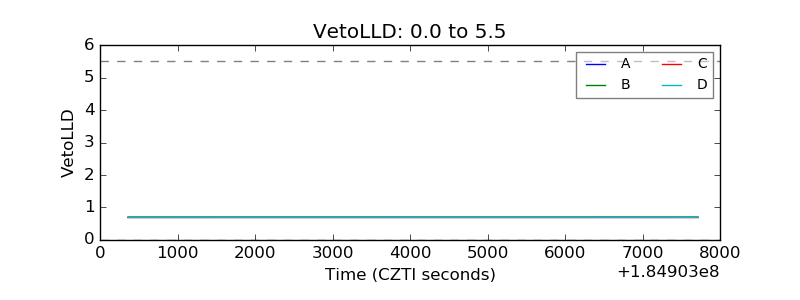 |
| Alpha Counter | 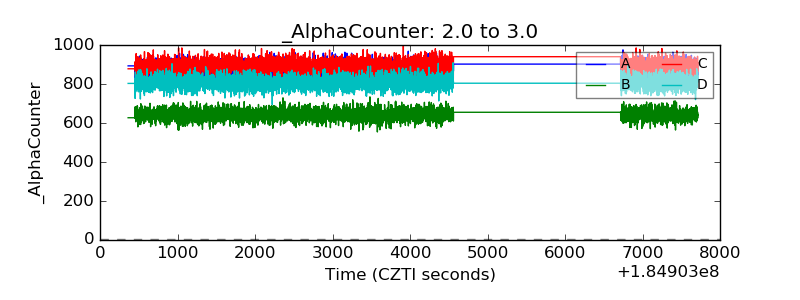 |
| _CPM_Rate | 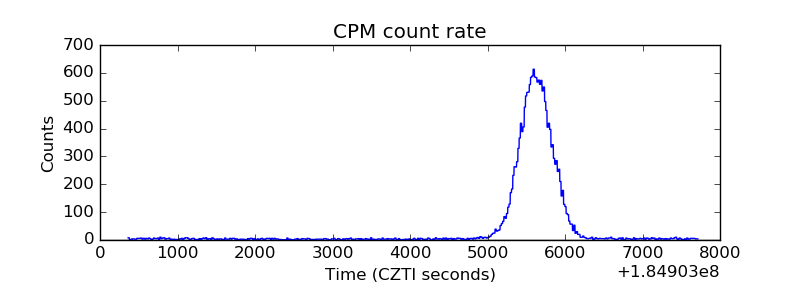 |
| CZT Counter | 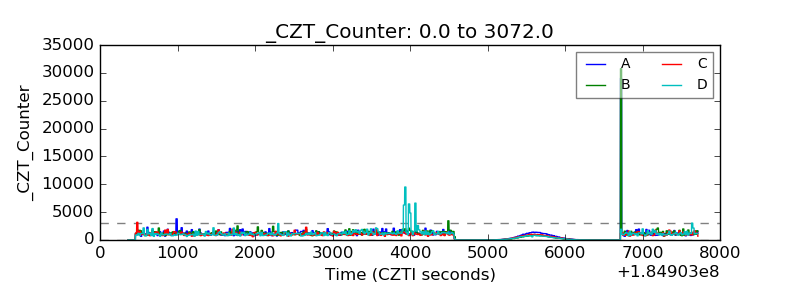 |
| +2.5 Volts monitor |  |
| +5 Volts monitor |  |
| _ROLL_ROT | 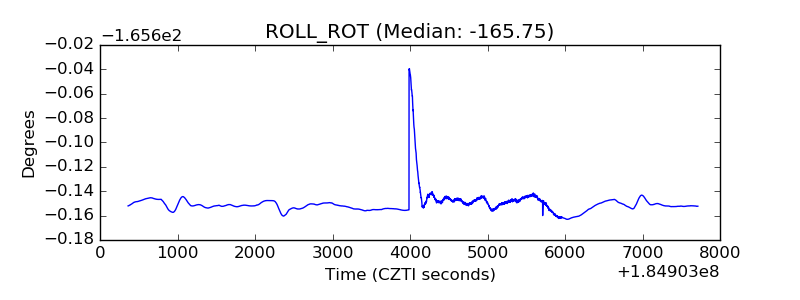 |
| _Roll_DEC | 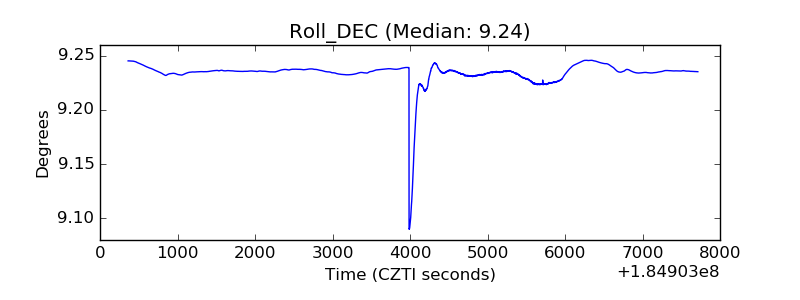 |
| _Roll_RA | 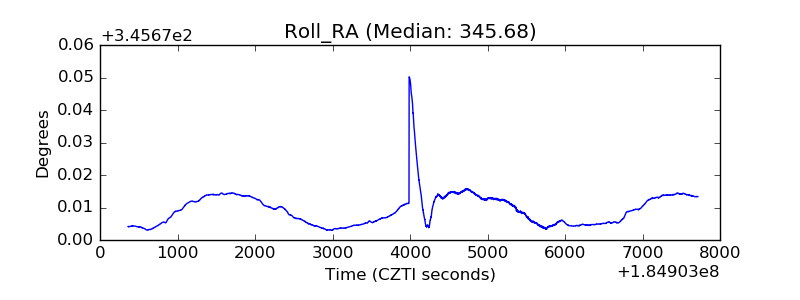 |
| Veto Counter | 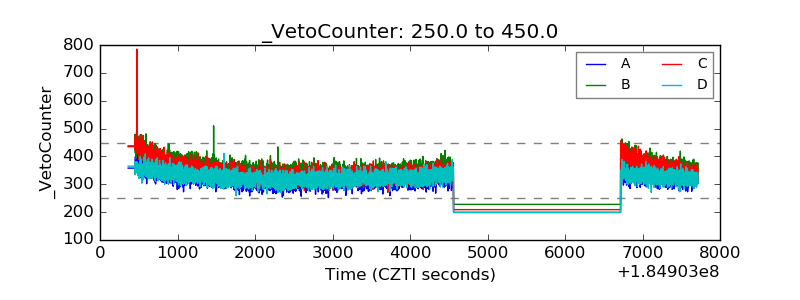 |