| Param | Original file | Final file |
|---|---|---|
| Filename | modeM0/AS1P01_126T04_9000000092_00654cztM0_level2.evt | modeM0/AS1P01_126T04_9000000092_00654cztM0_level2_quad_clean.evt |
| Size (bytes) | 782,553,600 | 43,989,120 |
| Size | 746.3 MB | 42.0 MB |
| Events in quadrant A | 5,956,870 | 245,929 |
| Events in quadrant B | 6,096,222 | 249,271 |
| Events in quadrant C | 5,364,924 | 251,136 |
| Events in quadrant D | 5,955,882 | 241,440 |
| Mode SS | |||
|---|---|---|---|
| Quadrant | BADHDUFLAG | Total packets | Discarded packets |
| A | 0 | 98 | 0 |
| B | 0 | 98 | 0 |
| C | 0 | 98 | 0 |
| D | 0 | 98 | 0 |
| Mode M0 | |||
|---|---|---|---|
| Quadrant | BADHDUFLAG | Total packets | Discarded packets |
| A | 0 | 21173 | 2 |
| B | 0 | 21610 | 2 |
| C | 0 | 19450 | 6 |
| D | 0 | 21188 | 2 |
| Mode M9 | |||
|---|---|---|---|
| Quadrant | BADHDUFLAG | Total packets | Discarded packets |
| A | 0 | 32 | 0 |
| B | 0 | 32 | 0 |
| C | 0 | 32 | 0 |
| D | 0 | 32 | 0 |
| Quadrant | Total seconds | Saturated seconds | Saturation percentage |
|---|---|---|---|
| A | 4905 | 7 | 0.142712% |
| B | 4905 | 16 | 0.326198% |
| C | 4904 | 2 | 0.040783% |
| D | 4904 | 92 | 1.876020% |
Noise dominated data is calculated using 1-second bins in cleaned event files. If a bin has >2000 counts, and if more than 50% of those come from <1% of pixels, then it is considered to be noise-dominated and hence unusable.
| Quadrant | # 1 sec bins | Bins with >0 counts | Bins with >2000 counts | High rate bins dominated by noise | Noise dominated (total time) | Noise dominated (detector-on time) | Marked lightcurve |
|---|---|---|---|---|---|---|---|
| A | 7060 | 4906 | 120 | 120 | 1.70% | 2.45% | 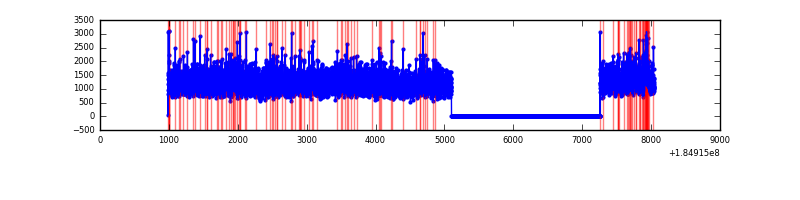 |
| B | 7060 | 4906 | 143 | 143 | 2.03% | 2.91% |  |
| C | 7059 | 4905 | 39 | 39 | 0.55% | 0.80% | 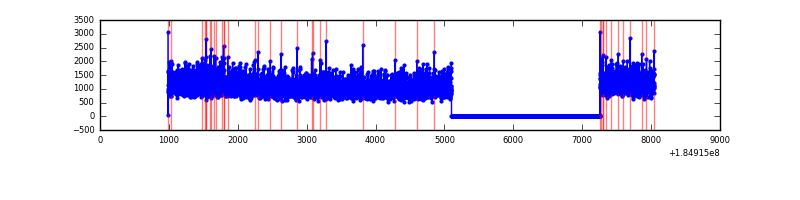 |
| D | 7059 | 4905 | 237 | 237 | 3.36% | 4.83% | 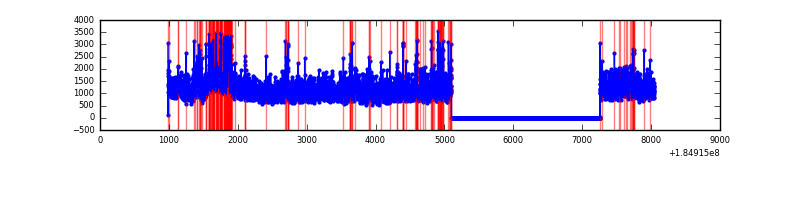 |
Top three noisy pixels from each quadrant. If the there are fewer than three noisy pixels in the level2.evt file, extra rows are filled as -1
| Pixel properties | Quadrant properties | ||||||
|---|---|---|---|---|---|---|---|
| Quadrant | DetID | PixID | Counts | Sigma | Mean | Median | Sigma |
| A | 12 | 236 | 31344 | 88.74 | 1511 | 1495 | 336.4 |
| A | 13 | 164 | 29214 | 82.4 | 1511 | 1495 | 336.4 |
| A | 0 | 238 | 23684 | 65.96 | 1511 | 1495 | 336.4 |
| B | 7 | 221 | 187975 | 527.23 | 1495 | 1505 | 353.7 |
| B | 5 | 191 | 66516 | 183.81 | 1495 | 1505 | 353.7 |
| B | 0 | 230 | 47278 | 129.42 | 1495 | 1505 | 353.7 |
| C | 5 | 249 | 16943 | 40.94 | 1354 | 1401 | 379.7 |
| C | 9 | 52 | 15967 | 38.37 | 1354 | 1401 | 379.7 |
| C | 15 | 241 | 11542 | 26.71 | 1354 | 1401 | 379.7 |
| D | 12 | 237 | 281382 | 683.86 | 1304 | 1360 | 409.5 |
| D | 1 | 4 | 275690 | 669.96 | 1304 | 1360 | 409.5 |
| D | 13 | 216 | 87883 | 211.3 | 1304 | 1360 | 409.5 |
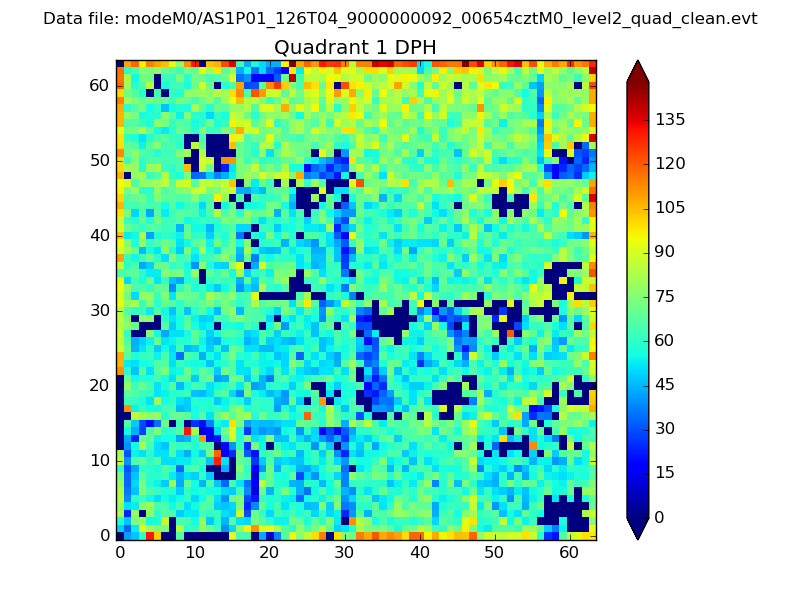
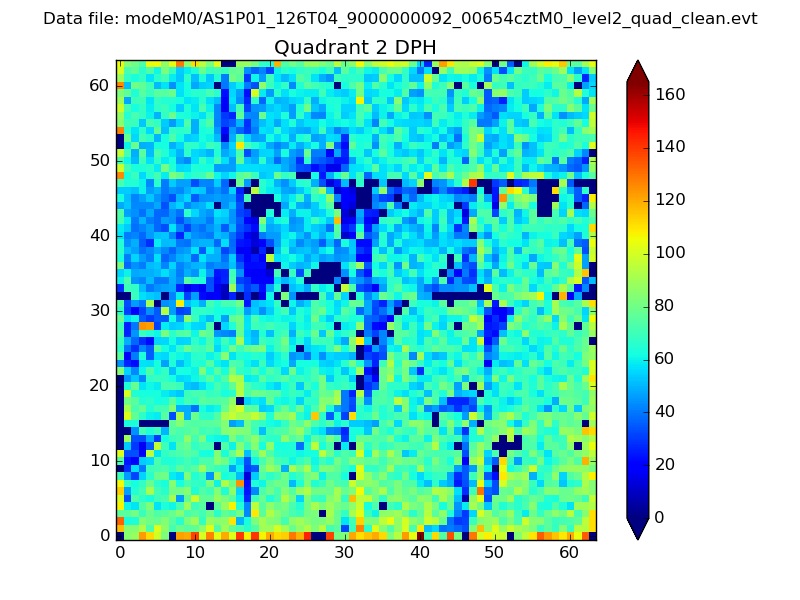
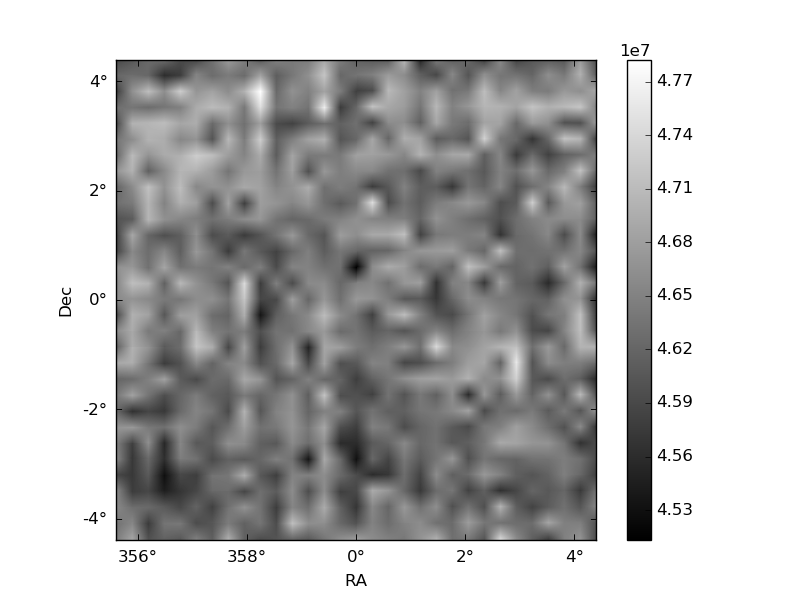
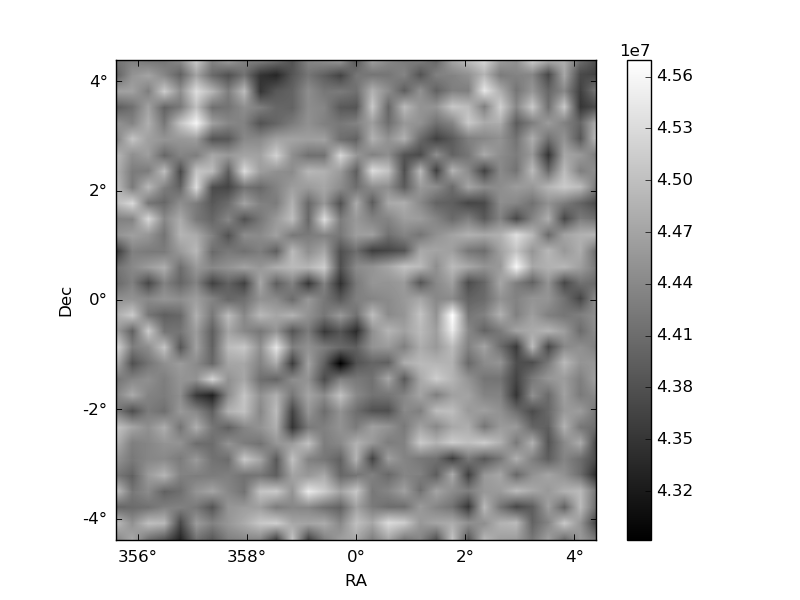
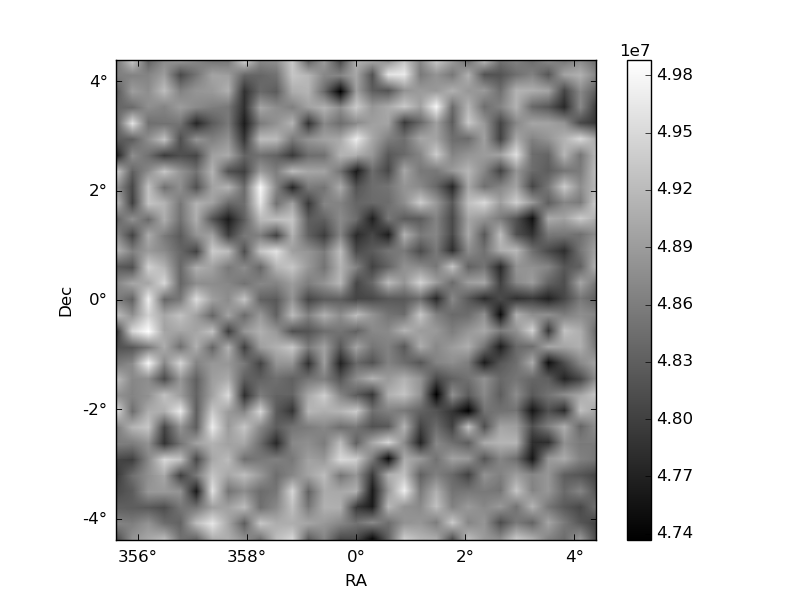
Histogram calculated using DETX and DETY for each event in the final _common_clean file
| Quadrant A | 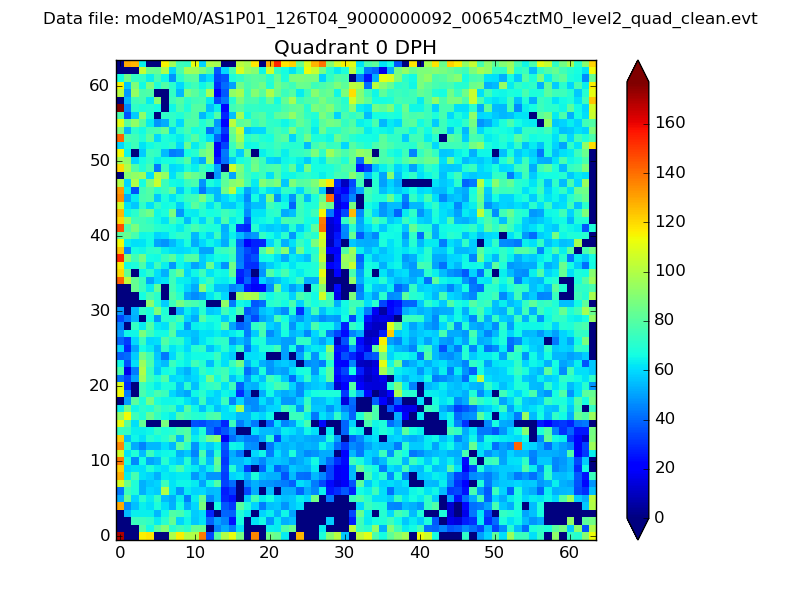 |
 |
Quadrant B |
|---|---|---|---|
| Quadrant D | 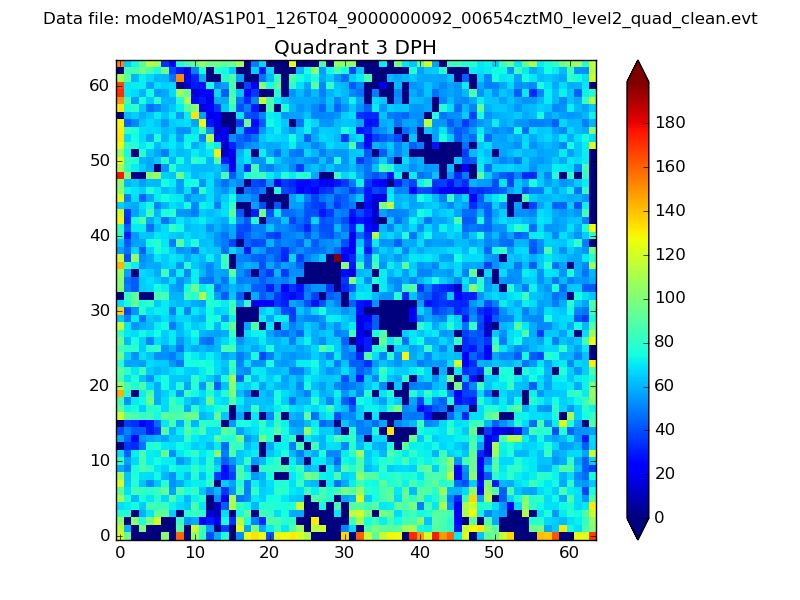 |
 |
Quadrant C |
| Plot type | Count rate plots | Images |
|---|---|---|
| Comparison with Poisson distribution Blue bars denote a histogram of data divided into 1 sec bins. Red curve is a Poisson curve with rate = median count rate of data. |
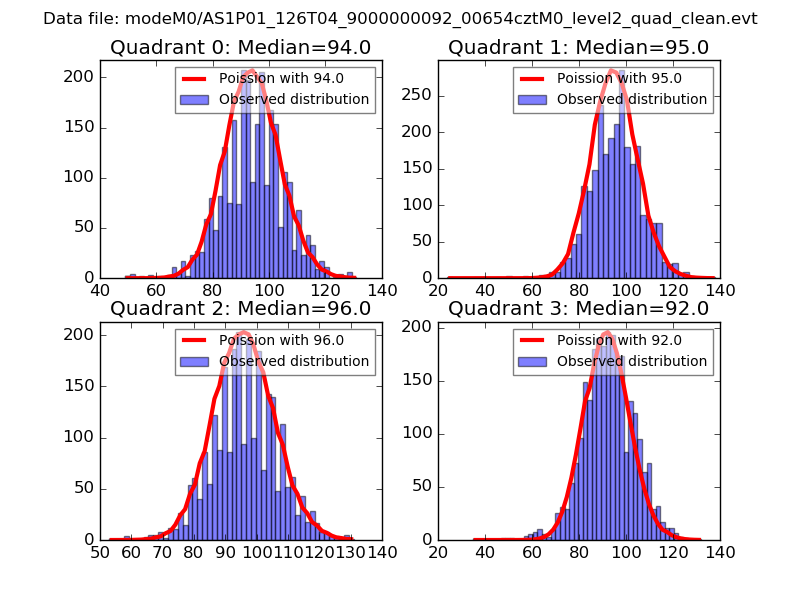 |
 |
| Quadrant-wise count rates Data is divided into 100 sec bins |
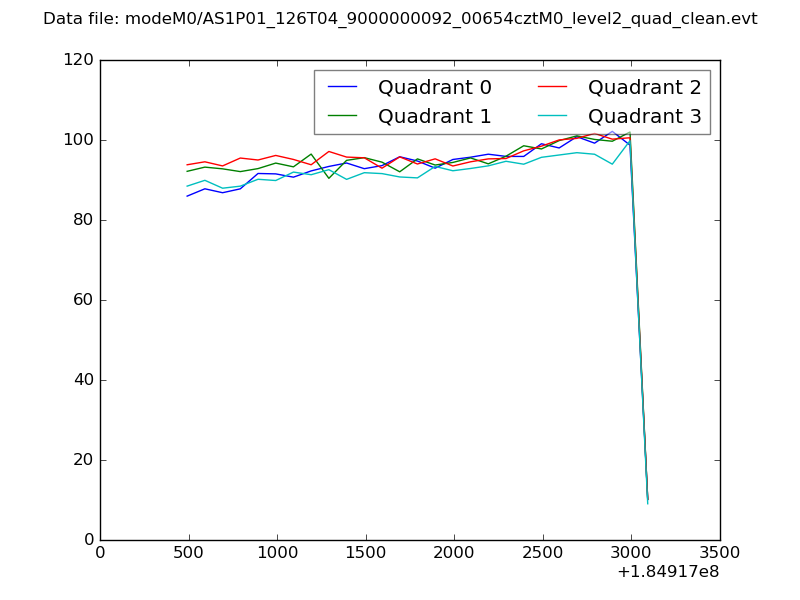 |
|
| Module-wise count rates for Quadrant A Data is divided into 100 sec bins |
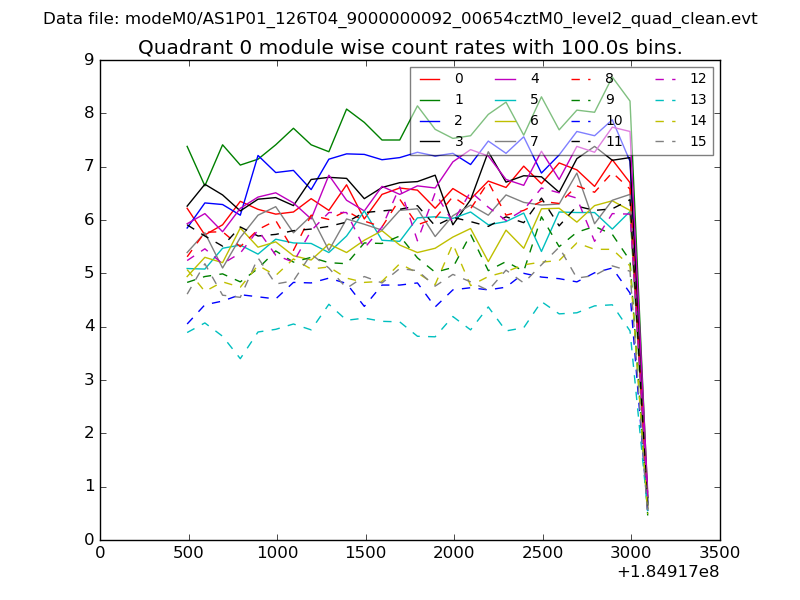 |
 |
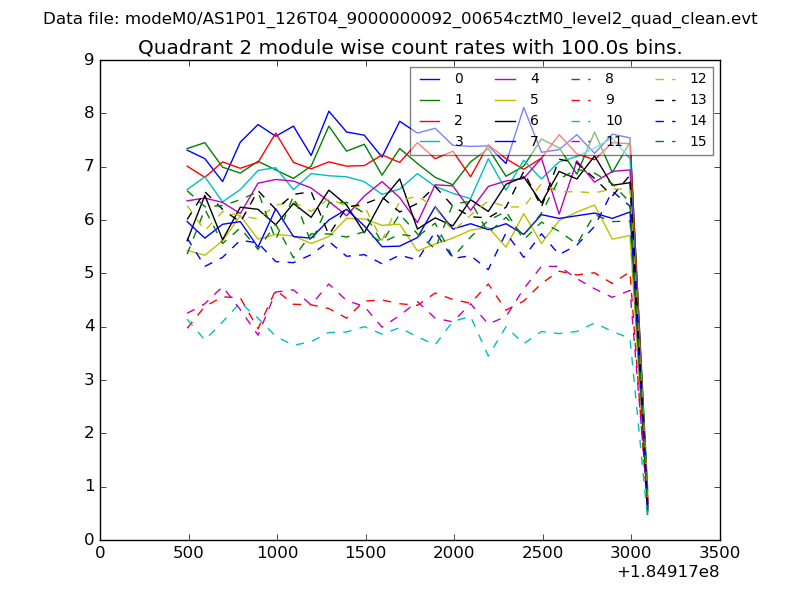
| Module-wise count rates for Quadrant B Data is divided into 100 sec bins |
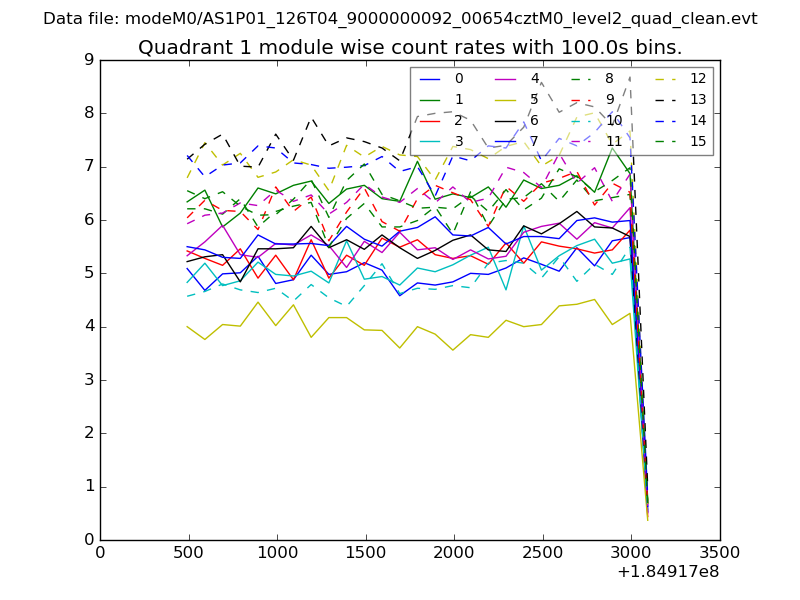 |
 |
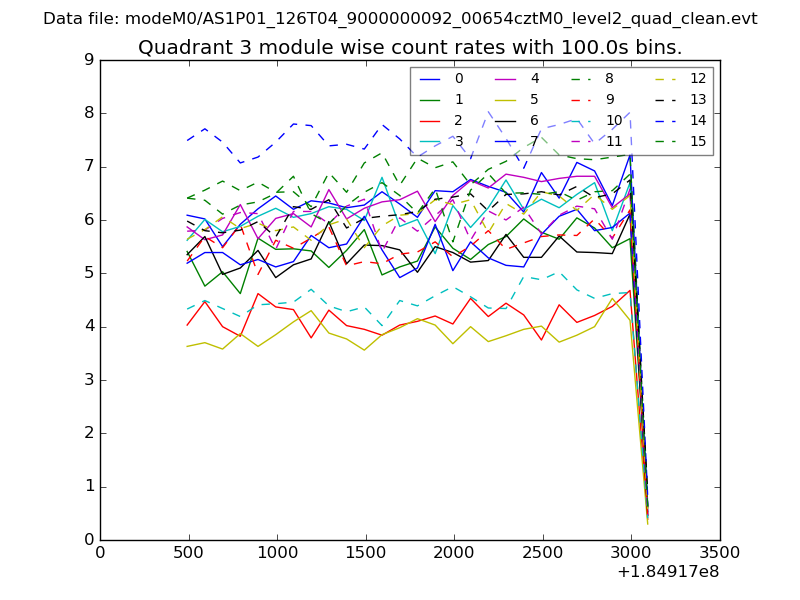
| Module-wise count rates for Quadrant C Data is divided into 100 sec bins |
 |
 |
| Module-wise count rates for Quadrant D Data is divided into 100 sec bins |
 |
 |
| Parameter | Plot |
|---|---|
| CZT HV Monitor | 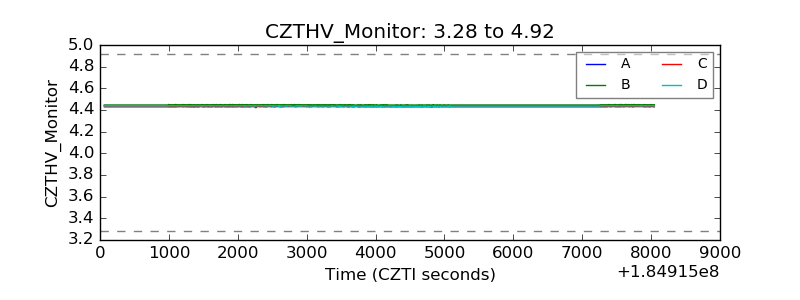 |
| D_VDD | 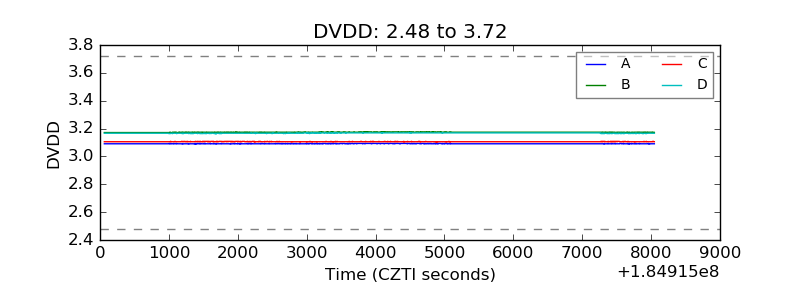 |
| Temperature 1 | 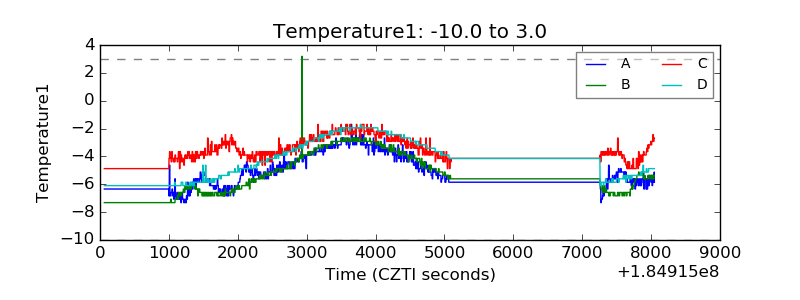 |
| Veto HV Monitor | 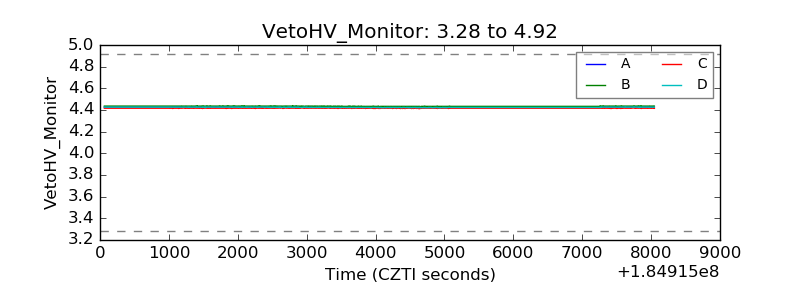 |
| Veto LLD | 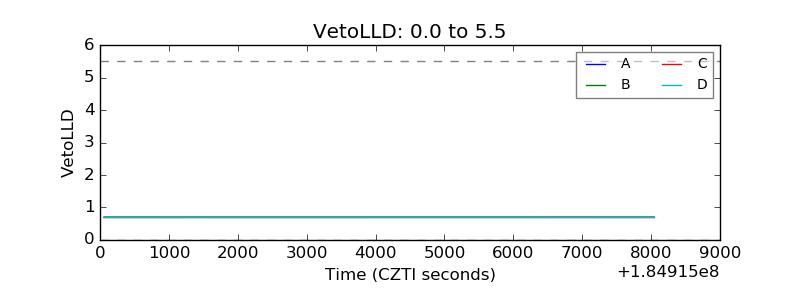 |
| Alpha Counter | 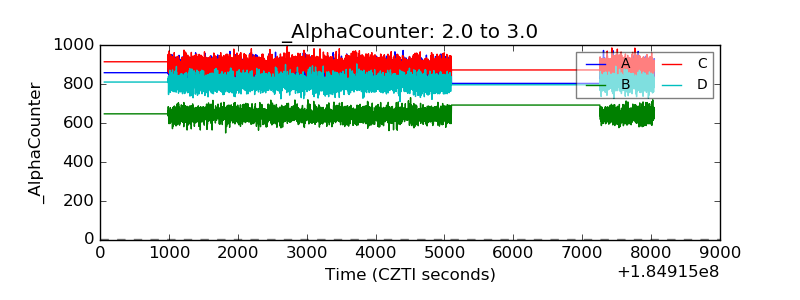 |
| _CPM_Rate | 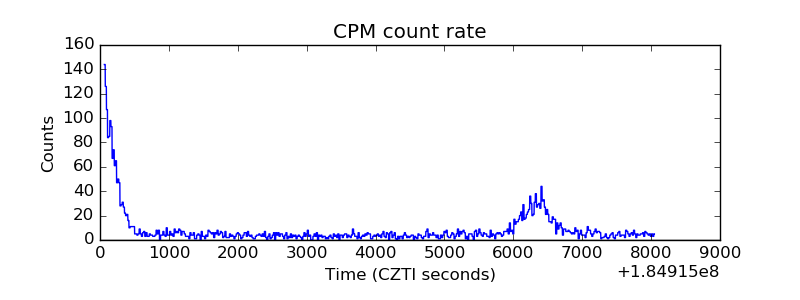 |
| CZT Counter | 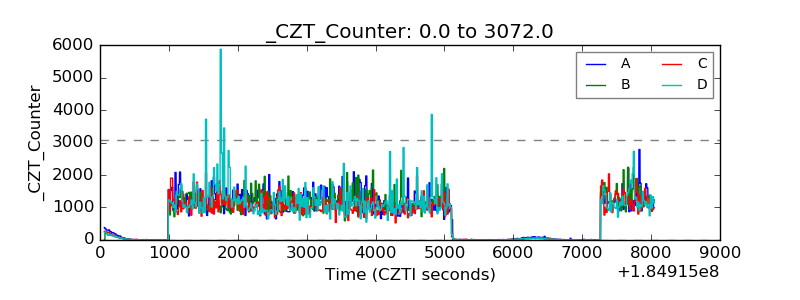 |
| +2.5 Volts monitor |  |
| +5 Volts monitor |  |
| _ROLL_ROT | 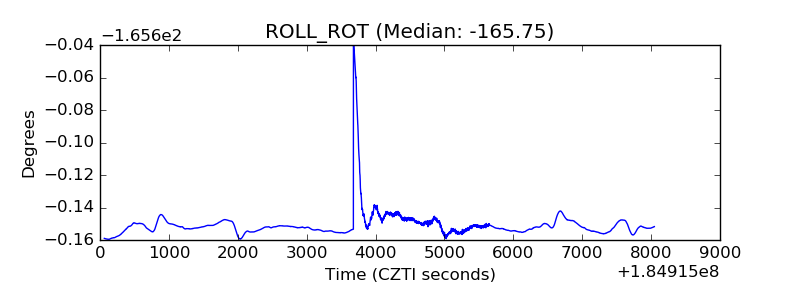 |
| _Roll_DEC | 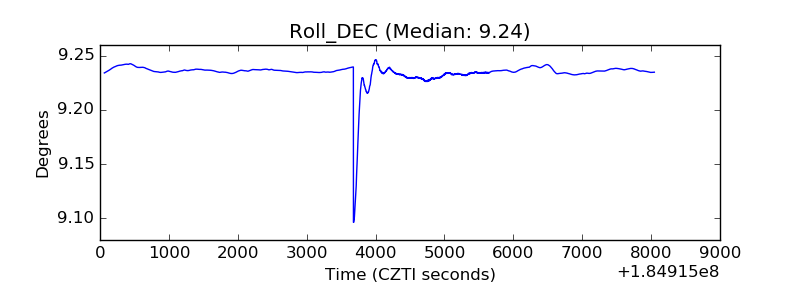 |
| _Roll_RA |  |
| Veto Counter | 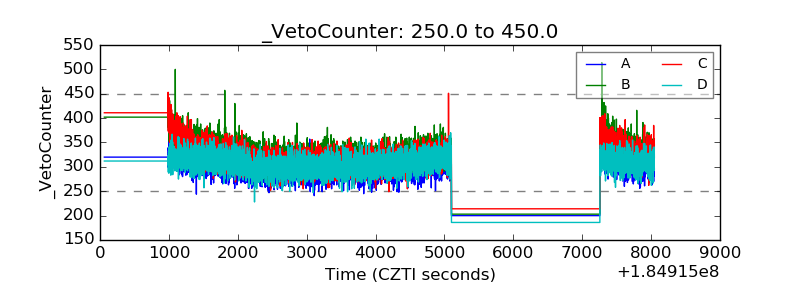 |