| Param | Original file | Final file |
|---|---|---|
| Filename | modeM0/AS1P01_126T04_9000000092_00655cztM0_level2.evt | modeM0/AS1P01_126T04_9000000092_00655cztM0_level2_quad_clean.evt |
| Size (bytes) | 789,477,120 | 51,436,800 |
| Size | 752.9 MB | 49.1 MB |
| Events in quadrant A | 6,163,135 | 299,881 |
| Events in quadrant B | 6,092,930 | 305,106 |
| Events in quadrant C | 5,471,596 | 307,293 |
| Events in quadrant D | 5,849,939 | 294,952 |
| Mode SS | |||
|---|---|---|---|
| Quadrant | BADHDUFLAG | Total packets | Discarded packets |
| A | 0 | 102 | 0 |
| B | 0 | 102 | 0 |
| C | 0 | 102 | 0 |
| D | 0 | 102 | 0 |
| Mode M0 | |||
|---|---|---|---|
| Quadrant | BADHDUFLAG | Total packets | Discarded packets |
| A | 0 | 21815 | 2 |
| B | 0 | 21668 | 2 |
| C | 0 | 19793 | 2 |
| D | 0 | 20924 | 4 |
| Mode M9 | |||
|---|---|---|---|
| Quadrant | BADHDUFLAG | Total packets | Discarded packets |
| A | 0 | 32 | 0 |
| B | 0 | 32 | 0 |
| C | 0 | 32 | 0 |
| D | 0 | 32 | 0 |
| Quadrant | Total seconds | Saturated seconds | Saturation percentage |
|---|---|---|---|
| A | 4986 | 19 | 0.381067% |
| B | 4986 | 11 | 0.220618% |
| C | 4986 | 12 | 0.240674% |
| D | 4985 | 42 | 0.842528% |
Noise dominated data is calculated using 1-second bins in cleaned event files. If a bin has >2000 counts, and if more than 50% of those come from <1% of pixels, then it is considered to be noise-dominated and hence unusable.
| Quadrant | # 1 sec bins | Bins with >0 counts | Bins with >2000 counts | High rate bins dominated by noise | Noise dominated (total time) | Noise dominated (detector-on time) | Marked lightcurve |
|---|---|---|---|---|---|---|---|
| A | 7141 | 4987 | 172 | 172 | 2.41% | 3.45% | 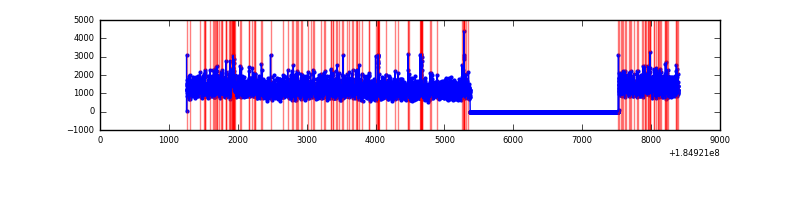 |
| B | 7141 | 4987 | 109 | 109 | 1.53% | 2.19% | 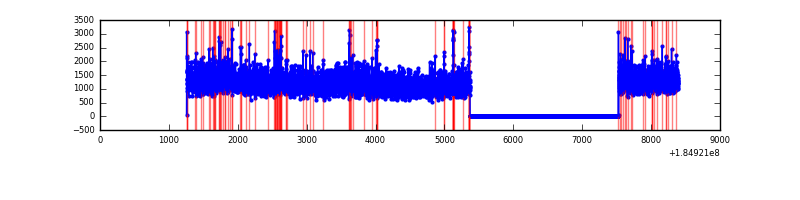 |
| C | 7141 | 4987 | 64 | 64 | 0.90% | 1.28% | 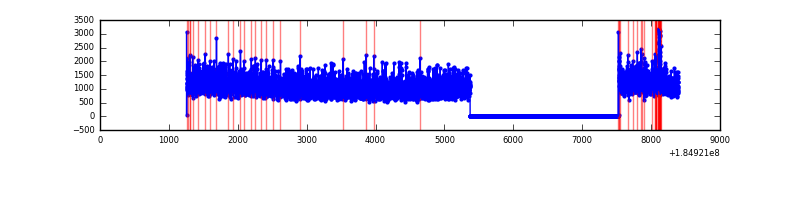 |
| D | 7140 | 4986 | 171 | 171 | 2.39% | 3.43% | 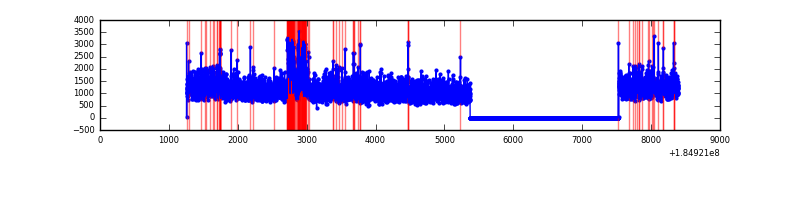 |
Top three noisy pixels from each quadrant. If the there are fewer than three noisy pixels in the level2.evt file, extra rows are filled as -1
| Pixel properties | Quadrant properties | ||||||
|---|---|---|---|---|---|---|---|
| Quadrant | DetID | PixID | Counts | Sigma | Mean | Median | Sigma |
| A | 0 | 69 | 94730 | 273.65 | 1534 | 1521 | 340.6 |
| A | 14 | 79 | 33324 | 93.37 | 1534 | 1521 | 340.6 |
| A | 0 | 238 | 33002 | 92.43 | 1534 | 1521 | 340.6 |
| B | 7 | 221 | 138331 | 382.69 | 1510 | 1524 | 357.5 |
| B | 4 | 172 | 55070 | 149.78 | 1510 | 1524 | 357.5 |
| B | 0 | 220 | 38976 | 104.76 | 1510 | 1524 | 357.5 |
| C | 10 | 117 | 69594 | 177.89 | 1362 | 1410 | 383.3 |
| C | 9 | 52 | 23787 | 58.38 | 1362 | 1410 | 383.3 |
| C | 5 | 249 | 18156 | 43.69 | 1362 | 1410 | 383.3 |
| D | 1 | 4 | 362569 | 856.0 | 1336 | 1387 | 421.9 |
| D | 13 | 216 | 100102 | 233.96 | 1336 | 1387 | 421.9 |
| D | 12 | 237 | 80512 | 187.53 | 1336 | 1387 | 421.9 |
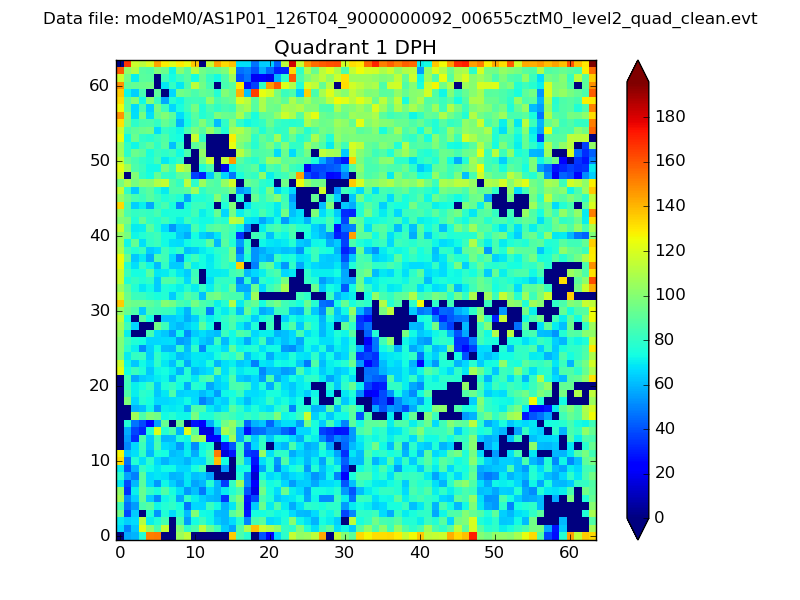
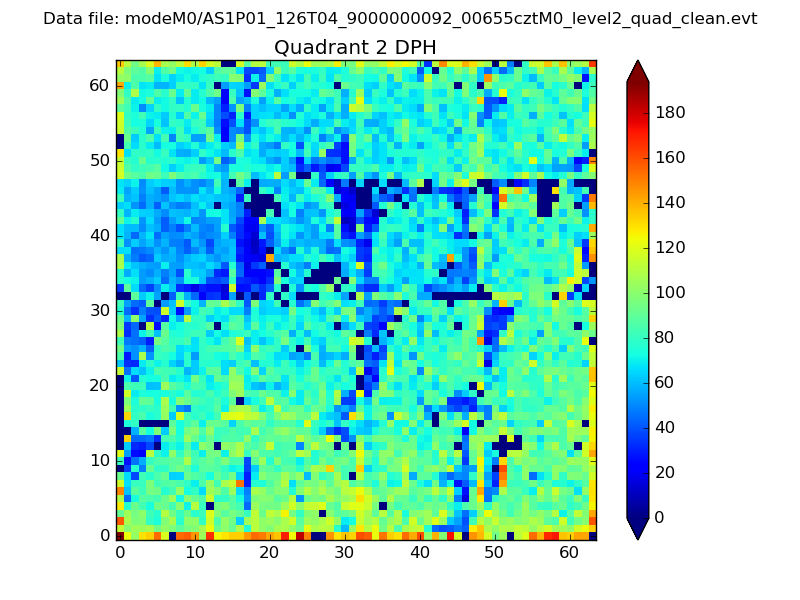
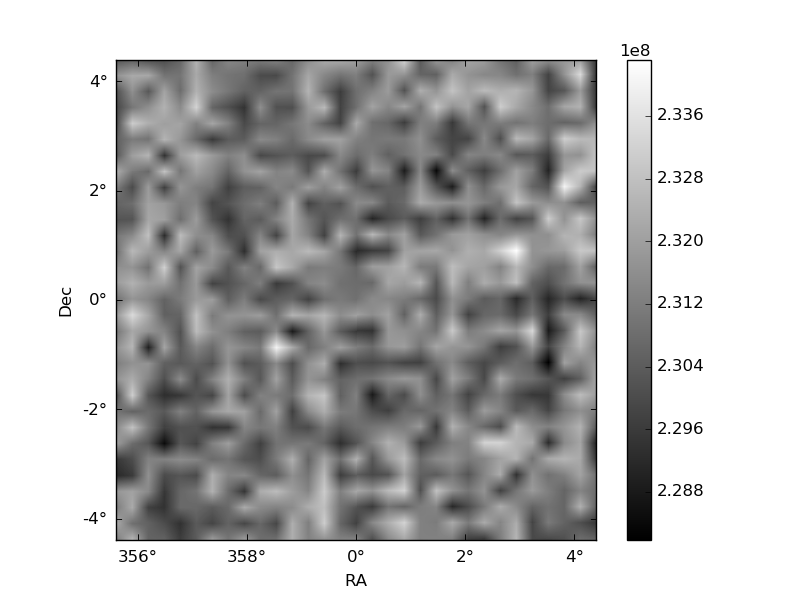
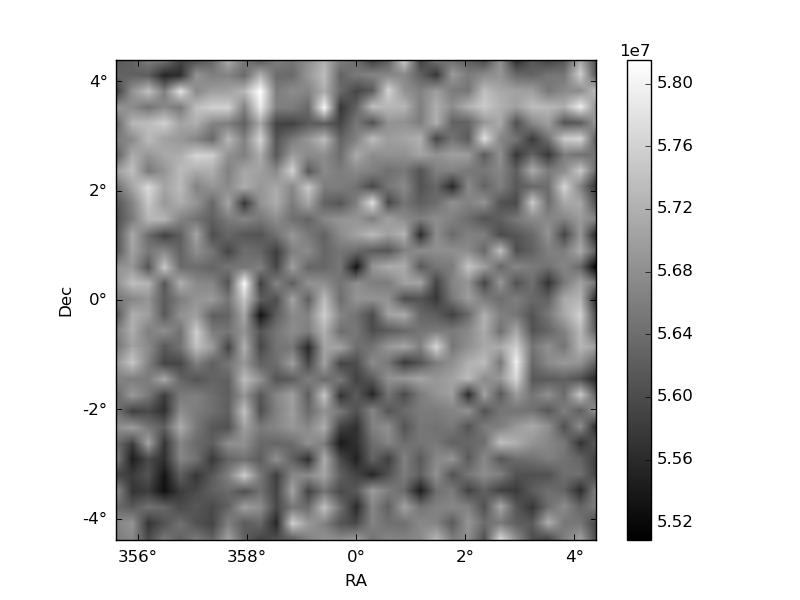
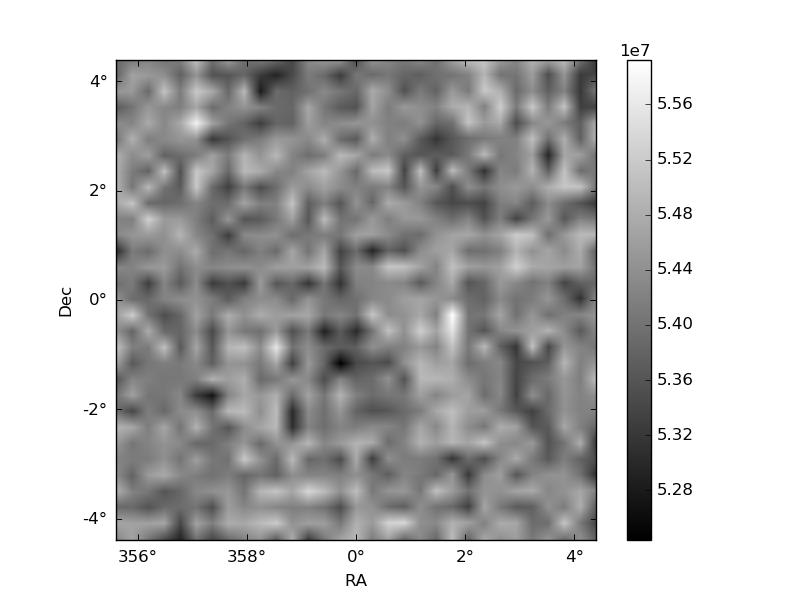
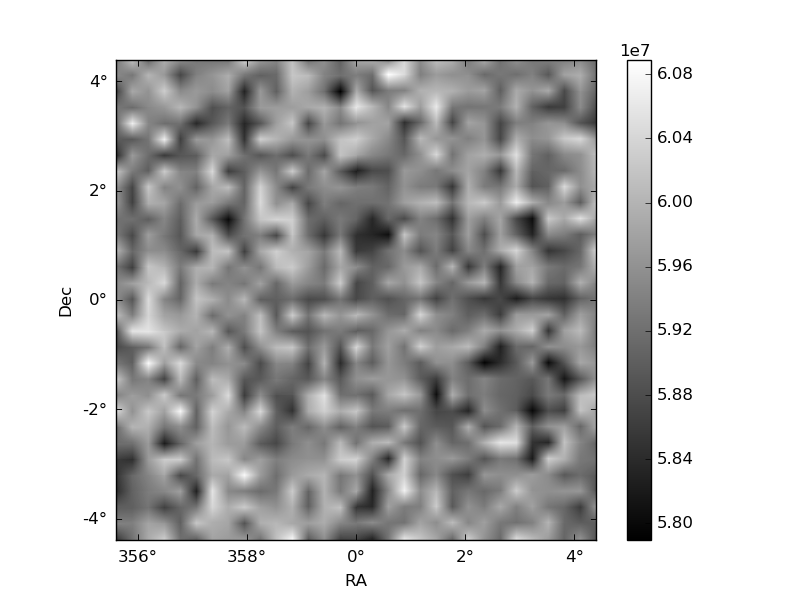
Histogram calculated using DETX and DETY for each event in the final _common_clean file
| Quadrant A |  |
 |
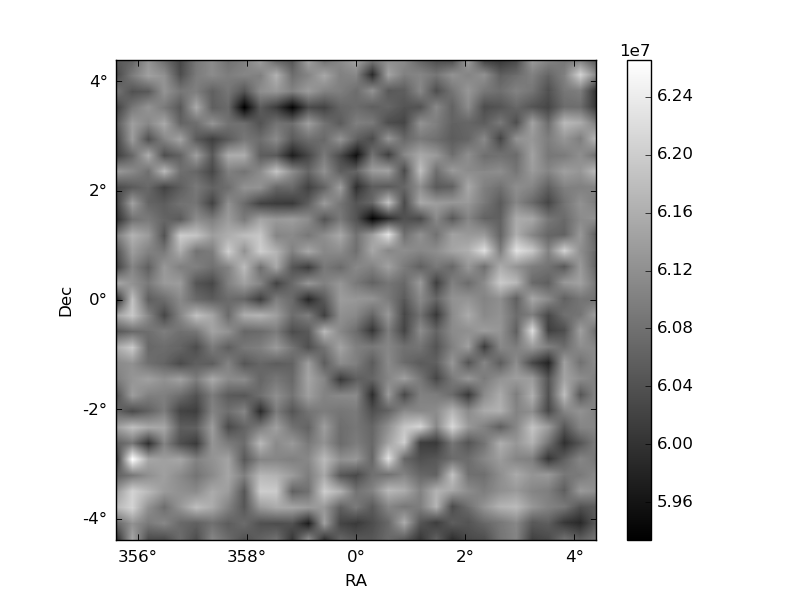
Quadrant B |
|---|---|---|---|
| Quadrant D | 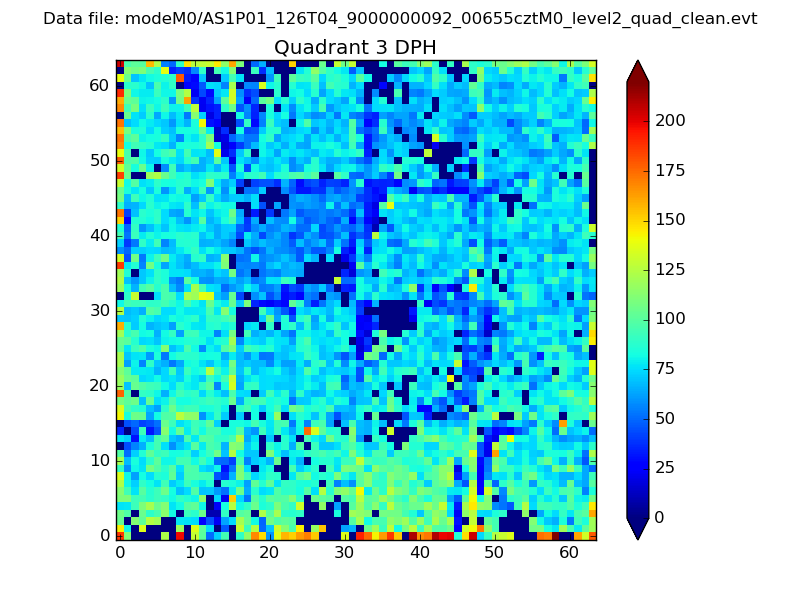 |
 |
Quadrant C |
| Plot type | Count rate plots | Images |
|---|---|---|
| Comparison with Poisson distribution Blue bars denote a histogram of data divided into 1 sec bins. Red curve is a Poisson curve with rate = median count rate of data. |
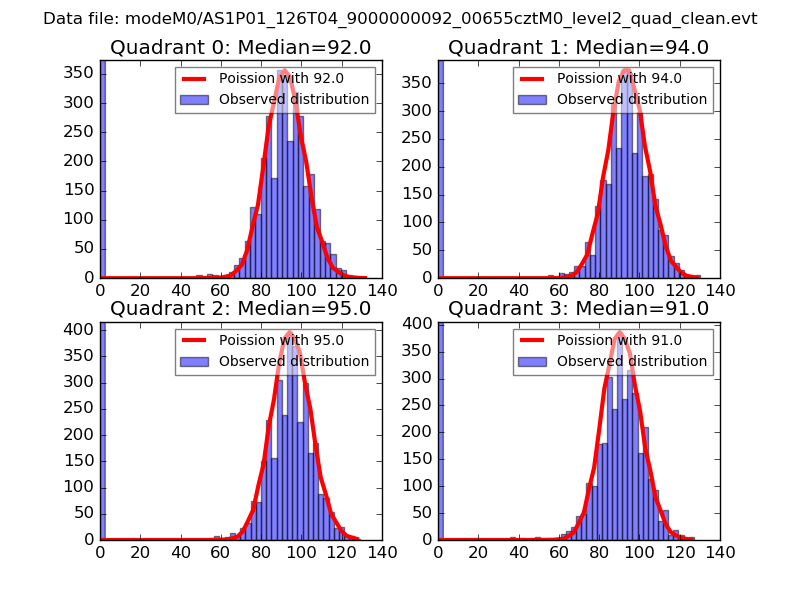 |
 |
| Quadrant-wise count rates Data is divided into 100 sec bins |
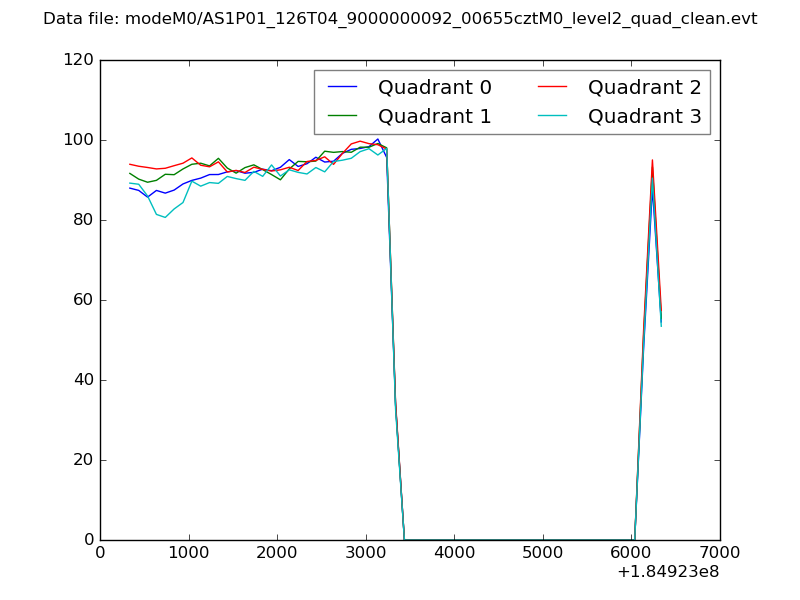 |
|
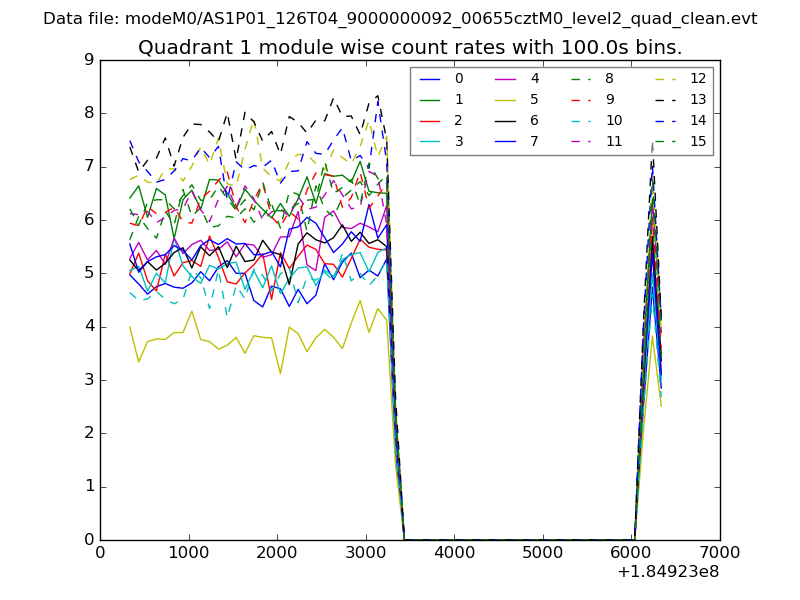
| Module-wise count rates for Quadrant A Data is divided into 100 sec bins |
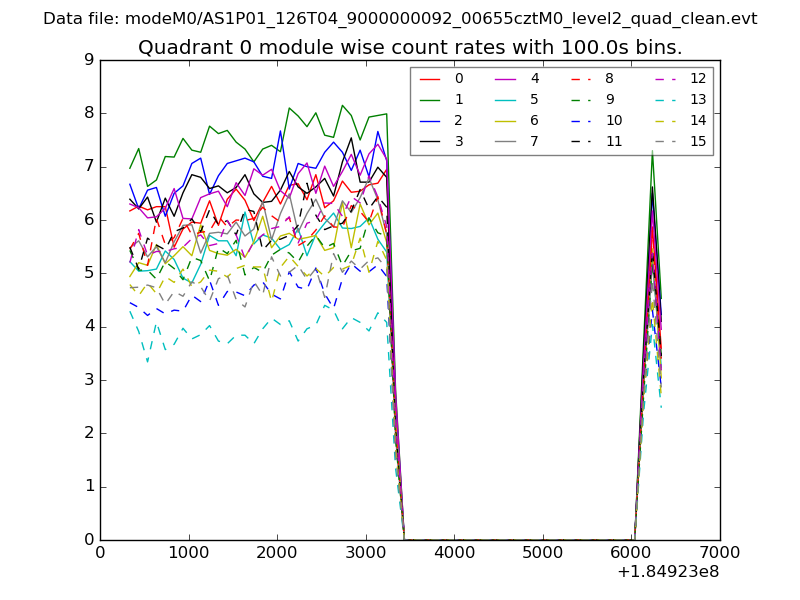 |
 |
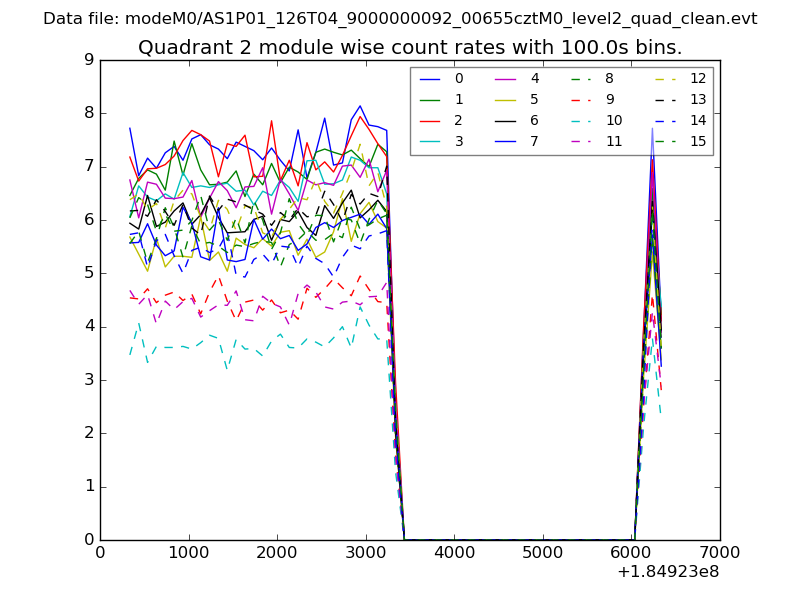
| Module-wise count rates for Quadrant B Data is divided into 100 sec bins |
 |
 |
| Module-wise count rates for Quadrant C Data is divided into 100 sec bins |
 |
 |
| Module-wise count rates for Quadrant D Data is divided into 100 sec bins |
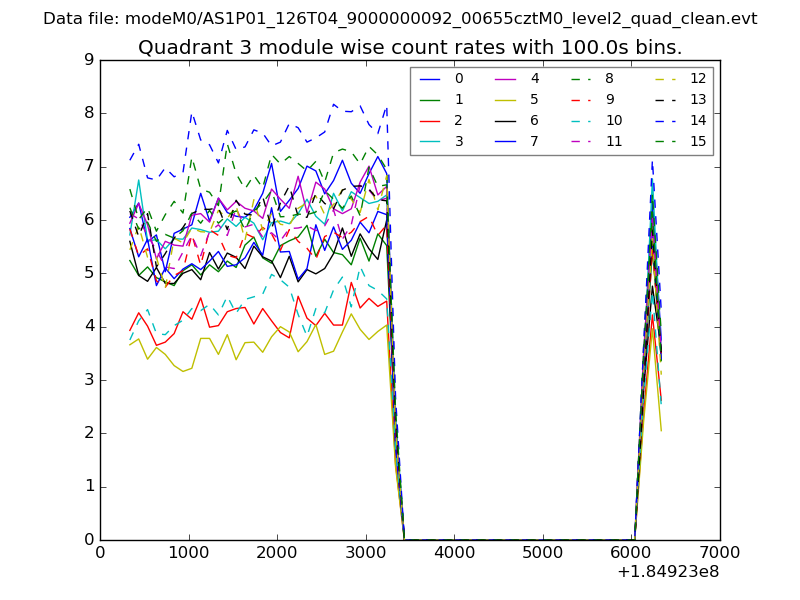 |
 |
| Parameter | Plot |
|---|---|
| CZT HV Monitor | 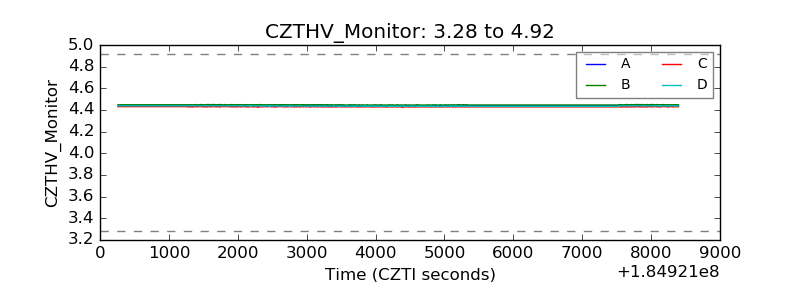 |
| D_VDD | 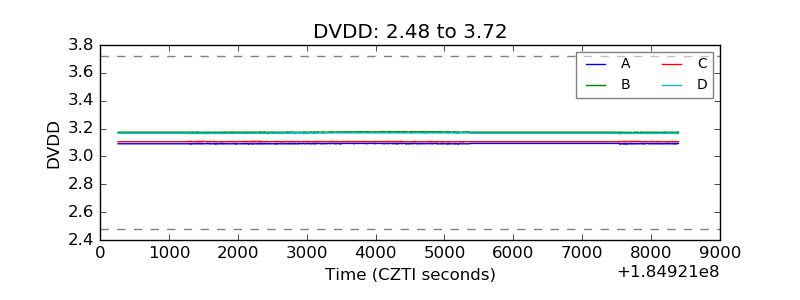 |
| Temperature 1 | 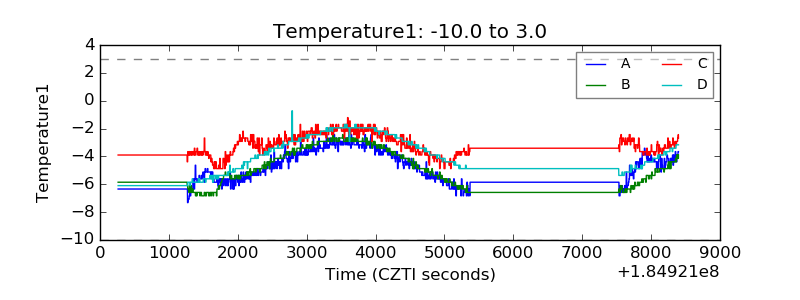 |
| Veto HV Monitor | 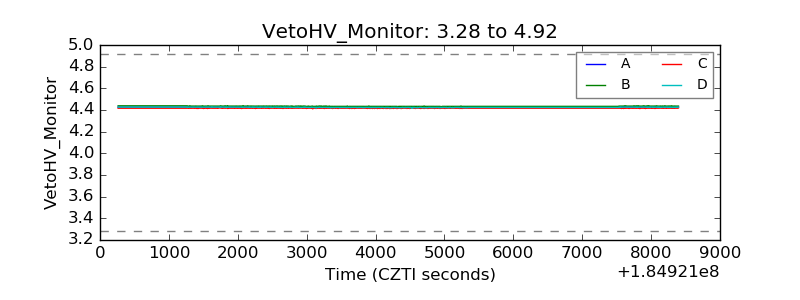 |
| Veto LLD | 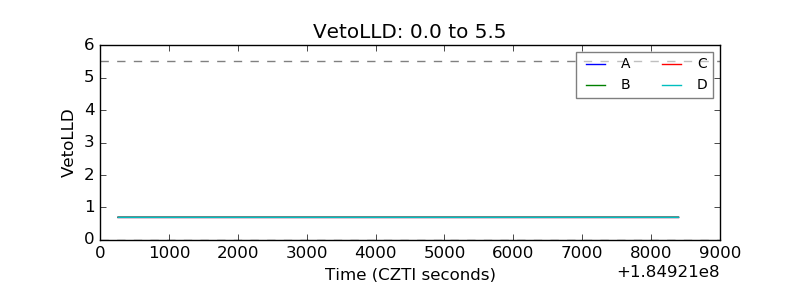 |
| Alpha Counter | 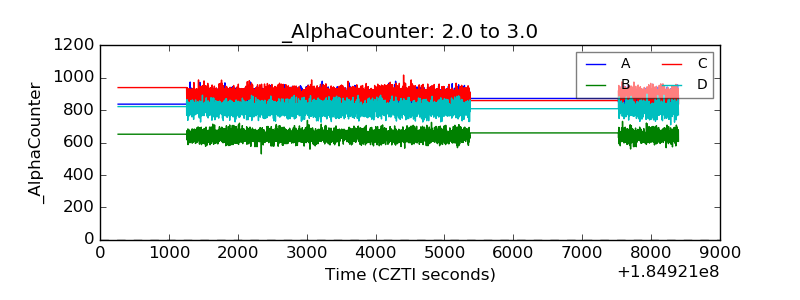 |
| _CPM_Rate | 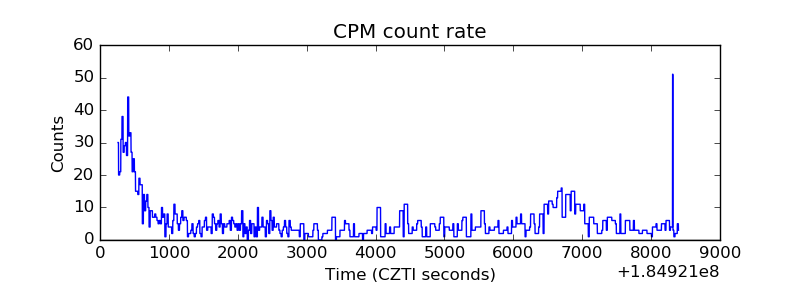 |
| CZT Counter | 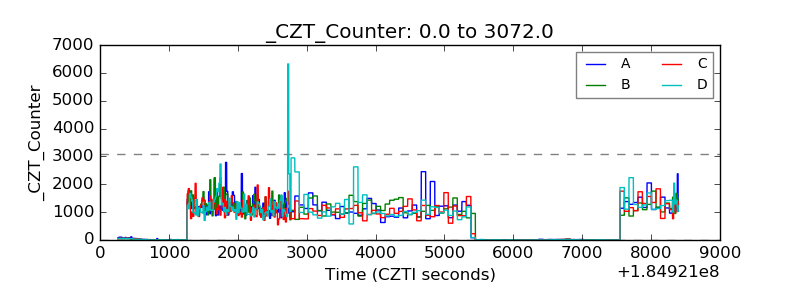 |
| +2.5 Volts monitor |  |
| +5 Volts monitor |  |
| _ROLL_ROT | 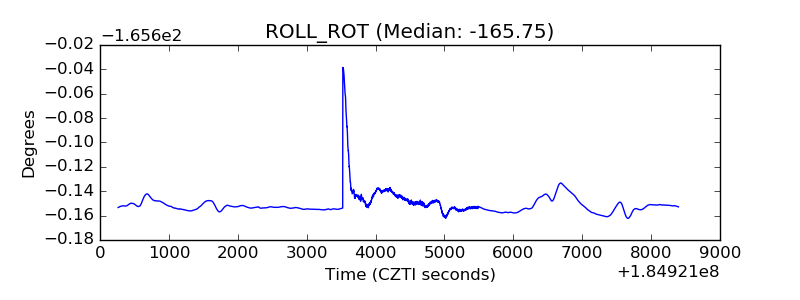 |
| _Roll_DEC | 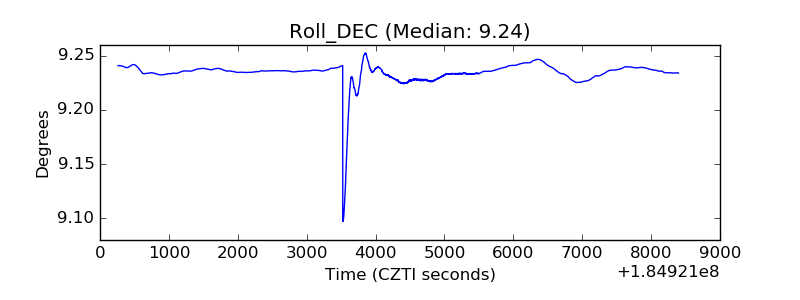 |
| _Roll_RA | 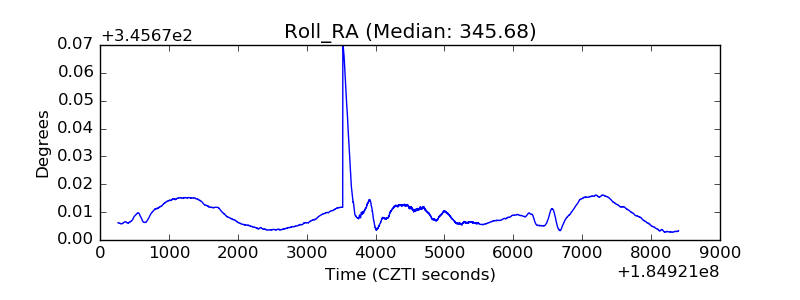 |
| Veto Counter | 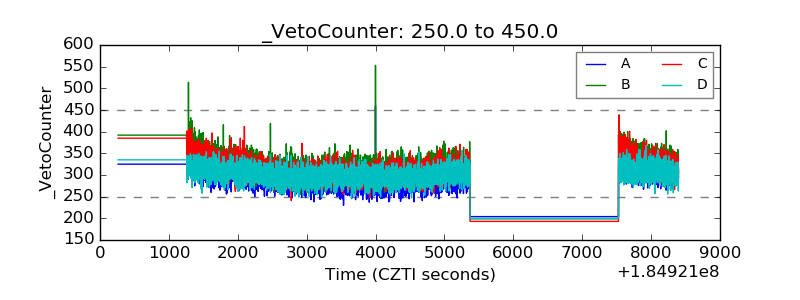 |