| Param | Original file | Final file |
|---|---|---|
| Filename | modeM0/AS1P01_126T04_9000000092_00656cztM0_level2.evt | modeM0/AS1P01_126T04_9000000092_00656cztM0_level2_quad_clean.evt |
| Size (bytes) | 368,406,720 | 24,526,080 |
| Size | 351.3 MB | 23.4 MB |
| Events in quadrant A | 2,910,197 | 142,829 |
| Events in quadrant B | 2,883,867 | 145,766 |
| Events in quadrant C | 2,529,739 | 147,997 |
| Events in quadrant D | 2,681,258 | 142,460 |
| Mode SS | |||
|---|---|---|---|
| Quadrant | BADHDUFLAG | Total packets | Discarded packets |
| A | 0 | 46 | 0 |
| B | 0 | 46 | 0 |
| C | 0 | 46 | 0 |
| D | 0 | 46 | 0 |
| Mode M0 | |||
|---|---|---|---|
| Quadrant | BADHDUFLAG | Total packets | Discarded packets |
| A | 0 | 10250 | 1 |
| B | 0 | 10165 | 1 |
| C | 0 | 9120 | 1 |
| D | 0 | 9548 | 1 |
| Mode M9 | |||
|---|---|---|---|
| Quadrant | BADHDUFLAG | Total packets | Discarded packets |
| A | 0 | 10 | 0 |
| B | 0 | 10 | 0 |
| C | 0 | 10 | 0 |
| D | 0 | 10 | 0 |
| Quadrant | Total seconds | Saturated seconds | Saturation percentage |
|---|---|---|---|
| A | 2254 | 10 | 0.443656% |
| B | 2254 | 7 | 0.310559% |
| C | 2254 | 11 | 0.488021% |
| D | 2254 | 2 | 0.088731% |
Noise dominated data is calculated using 1-second bins in cleaned event files. If a bin has >2000 counts, and if more than 50% of those come from <1% of pixels, then it is considered to be noise-dominated and hence unusable.
| Quadrant | # 1 sec bins | Bins with >0 counts | Bins with >2000 counts | High rate bins dominated by noise | Noise dominated (total time) | Noise dominated (detector-on time) | Marked lightcurve |
|---|---|---|---|---|---|---|---|
| A | 2254 | 2254 | 89 | 89 | 3.95% | 3.95% | 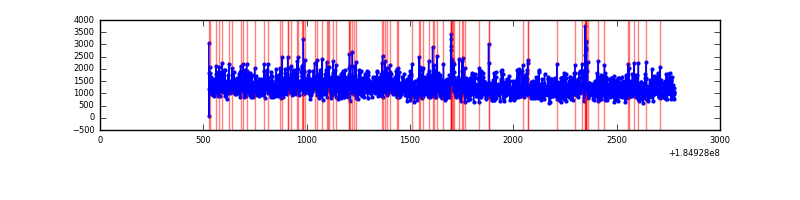 |
| B | 2254 | 2254 | 62 | 62 | 2.75% | 2.75% | 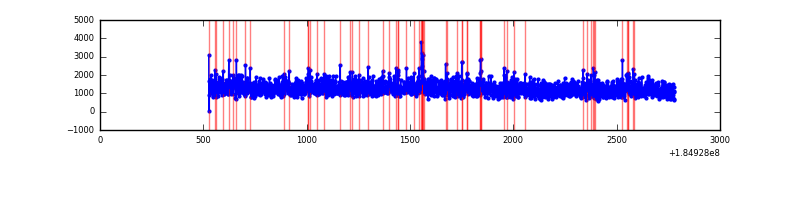 |
| C | 2254 | 2254 | 42 | 42 | 1.86% | 1.86% | 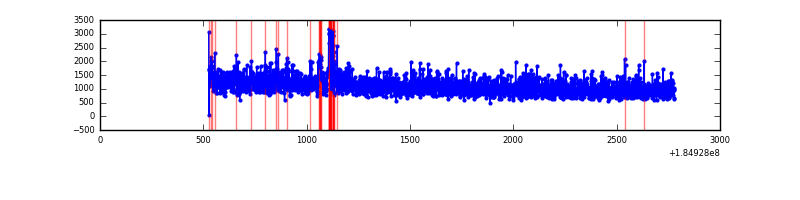 |
| D | 2254 | 2254 | 32 | 32 | 1.42% | 1.42% | 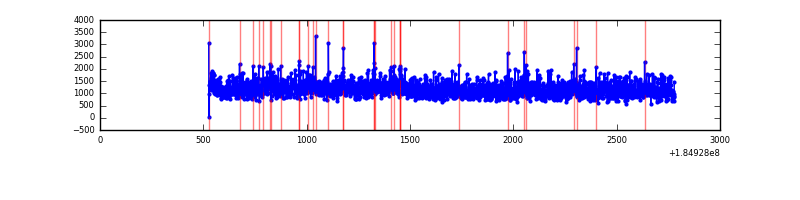 |
Top three noisy pixels from each quadrant. If the there are fewer than three noisy pixels in the level2.evt file, extra rows are filled as -1
| Pixel properties | Quadrant properties | ||||||
|---|---|---|---|---|---|---|---|
| Quadrant | DetID | PixID | Counts | Sigma | Mean | Median | Sigma |
| A | 0 | 69 | 60001 | 358.97 | 727 | 721 | 165.1 |
| A | 13 | 17 | 16452 | 95.26 | 727 | 721 | 165.1 |
| A | 0 | 238 | 6558 | 35.35 | 727 | 721 | 165.1 |
| B | 7 | 221 | 172867 | 1005.72 | 697 | 705 | 171.2 |
| B | 15 | 82 | 17119 | 95.89 | 697 | 705 | 171.2 |
| B | 0 | 220 | 9952 | 54.02 | 697 | 705 | 171.2 |
| C | 10 | 117 | 69357 | 387.66 | 622 | 644 | 177.3 |
| C | 9 | 52 | 9390 | 49.34 | 622 | 644 | 177.3 |
| C | 15 | 241 | 4615 | 22.4 | 622 | 644 | 177.3 |
| D | 13 | 216 | 140993 | 705.06 | 626 | 651 | 199.1 |
| D | 13 | 173 | 27749 | 136.14 | 626 | 651 | 199.1 |
| D | 1 | 4 | 22876 | 111.66 | 626 | 651 | 199.1 |
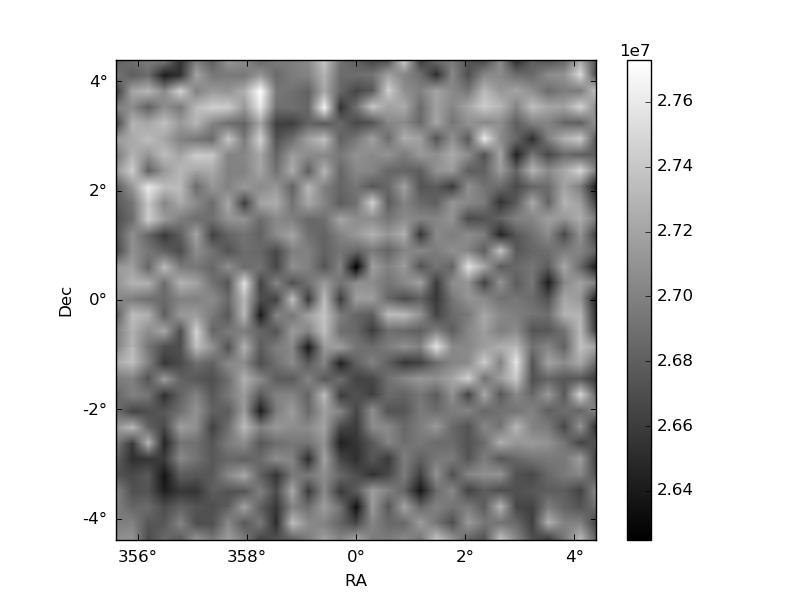
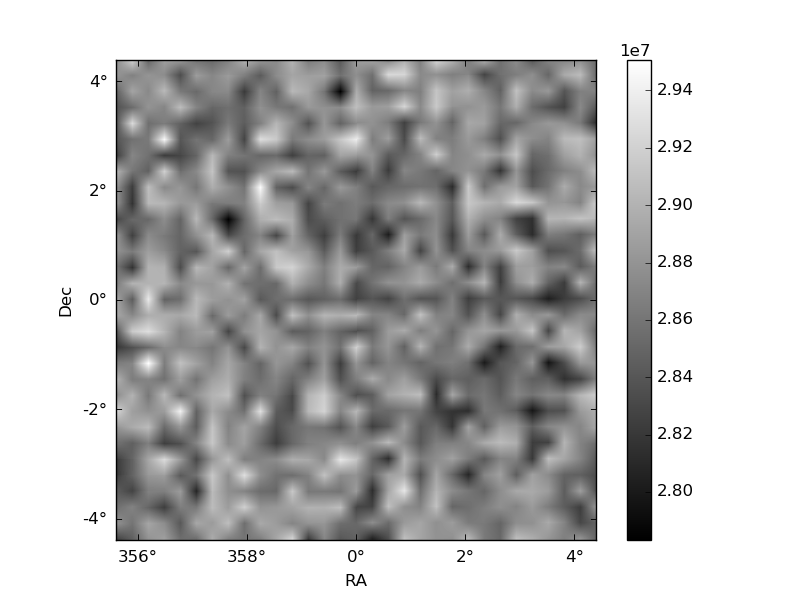
Histogram calculated using DETX and DETY for each event in the final _common_clean file
| Quadrant A | 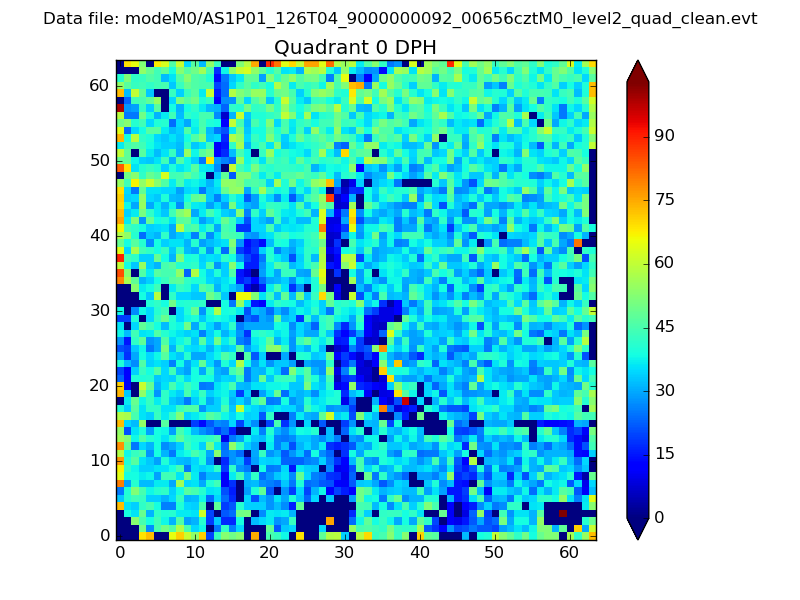 |
 |
Quadrant B |
|---|---|---|---|
| Quadrant D |  |
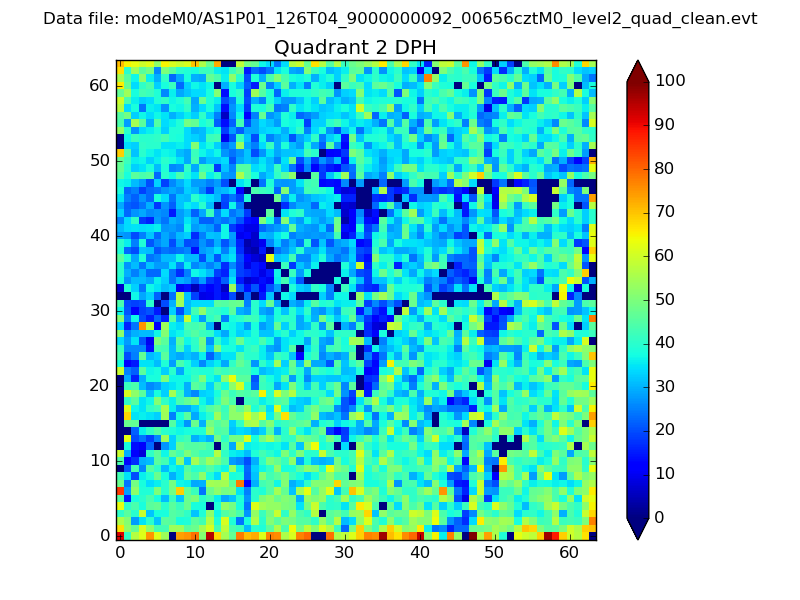 |
Quadrant C |
| Plot type | Count rate plots | Images |
|---|---|---|
| Comparison with Poisson distribution Blue bars denote a histogram of data divided into 1 sec bins. Red curve is a Poisson curve with rate = median count rate of data. |
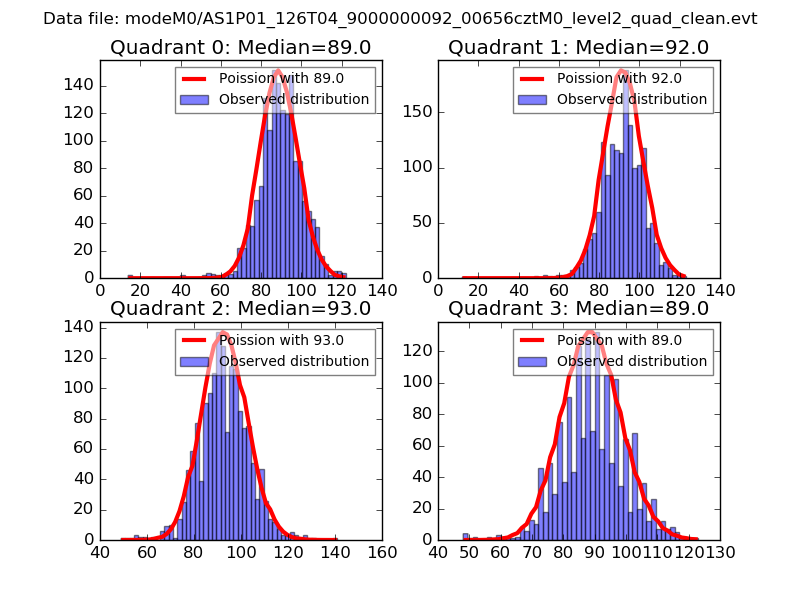 |
 |
| Quadrant-wise count rates Data is divided into 100 sec bins |
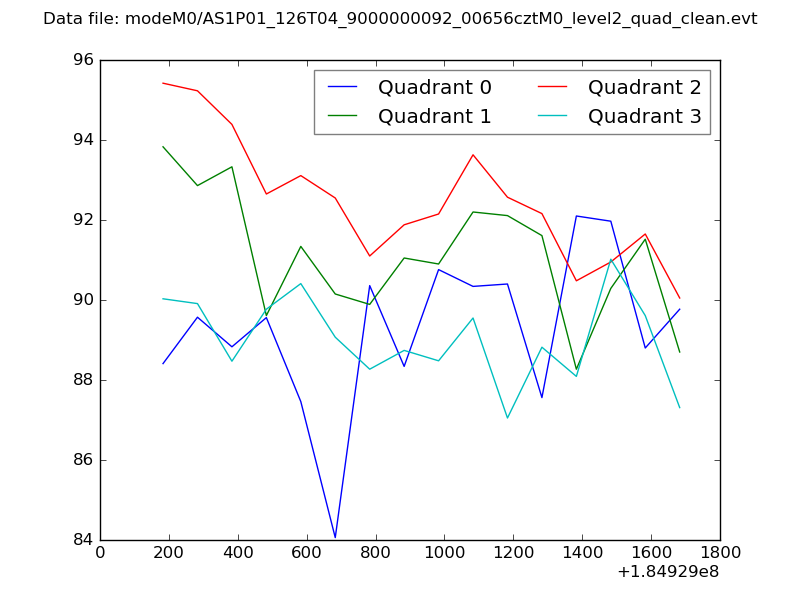 |
|
| Module-wise count rates for Quadrant A Data is divided into 100 sec bins |
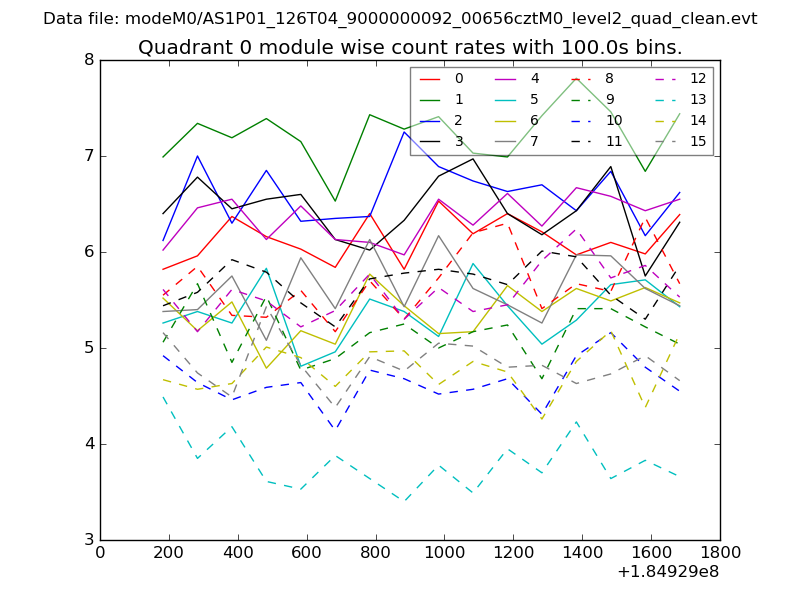 |
 |
| Module-wise count rates for Quadrant B Data is divided into 100 sec bins |
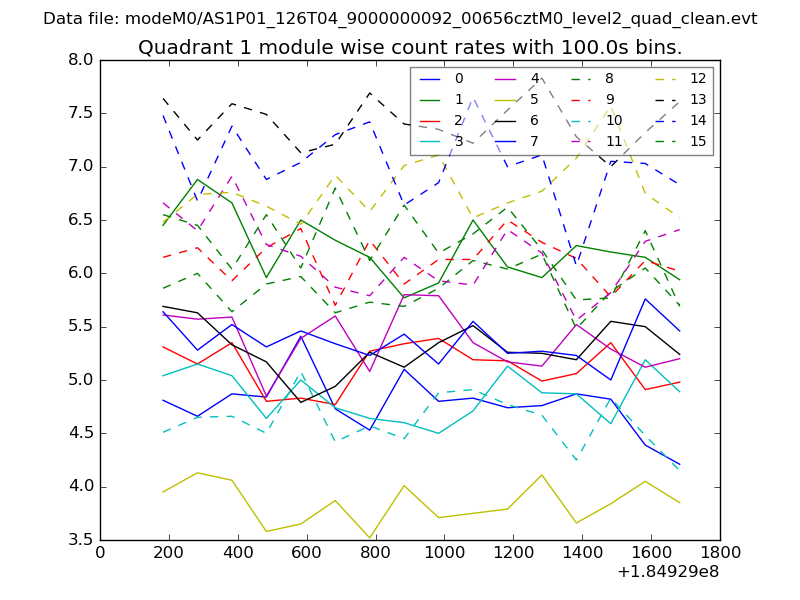 |
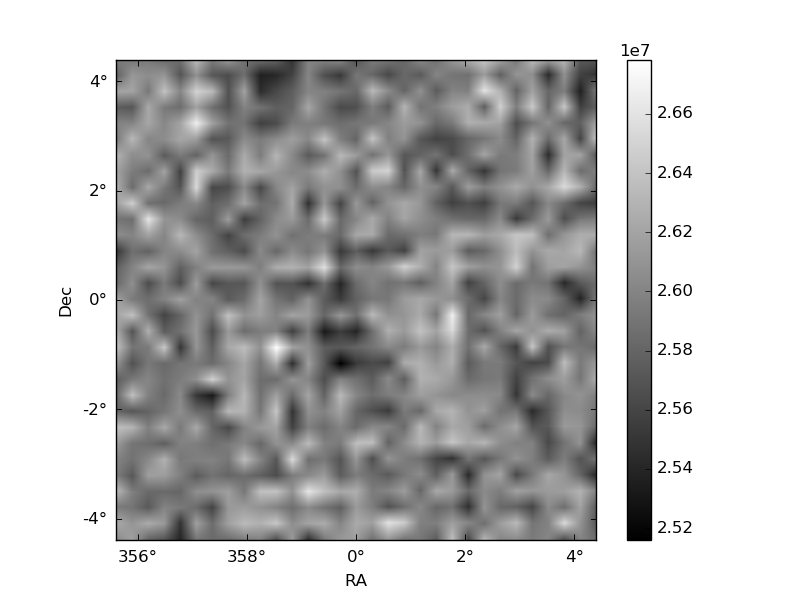 |
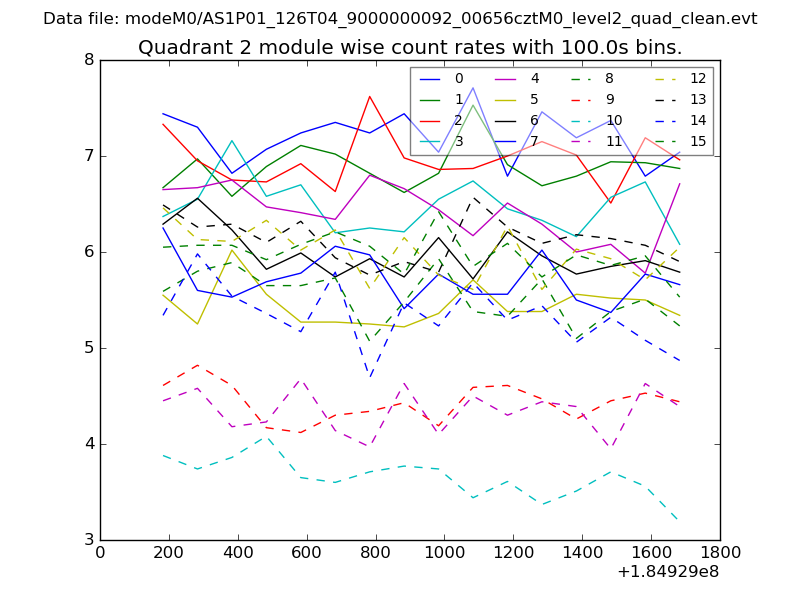
| Module-wise count rates for Quadrant C Data is divided into 100 sec bins |
 |
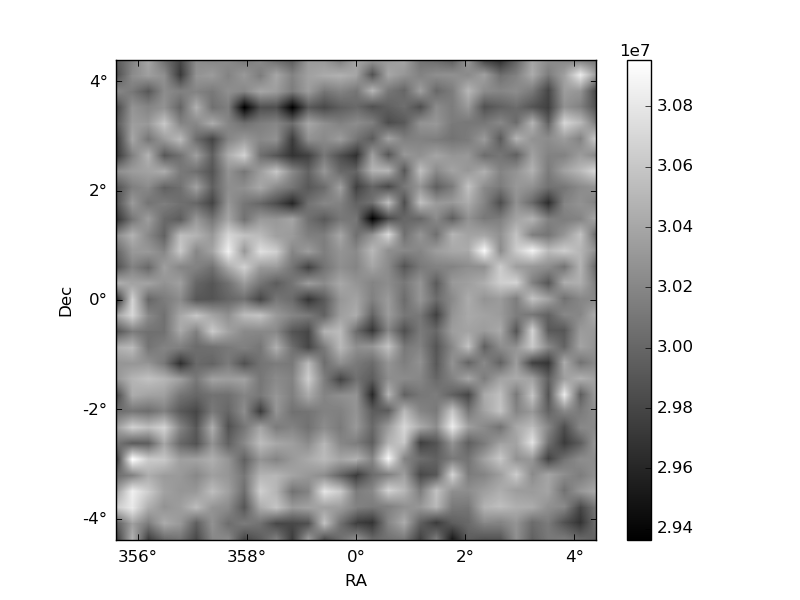 |
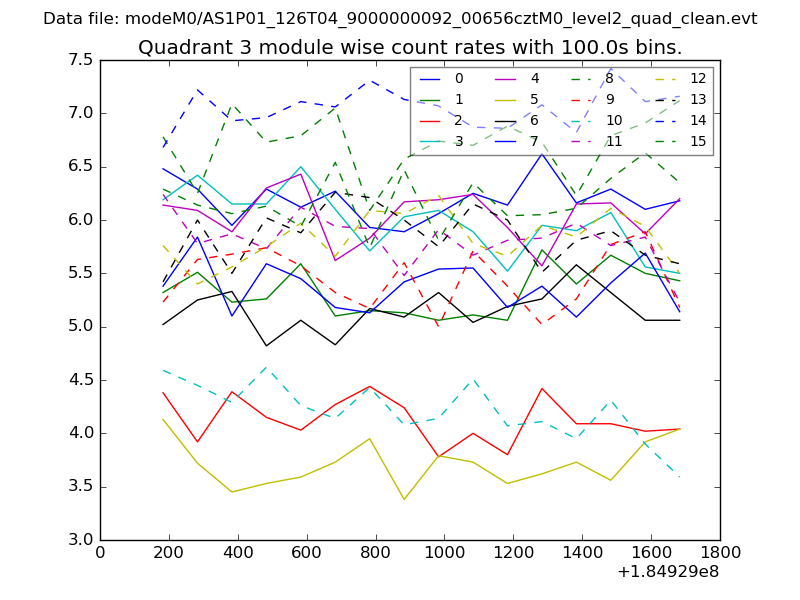
| Module-wise count rates for Quadrant D Data is divided into 100 sec bins |
 |
 |
| Parameter | Plot |
|---|---|
| CZT HV Monitor | 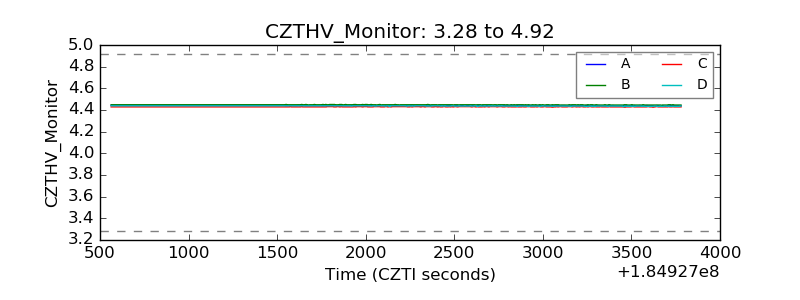 |
| D_VDD | 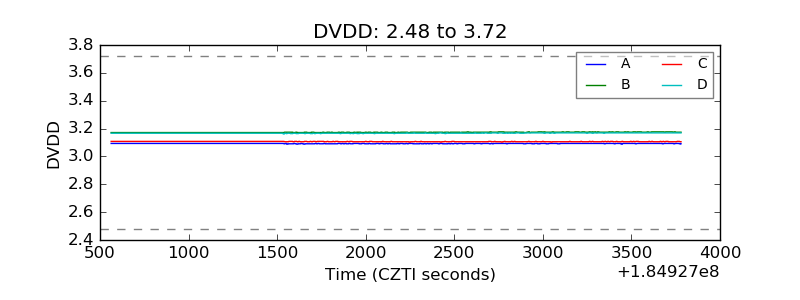 |
| Temperature 1 | 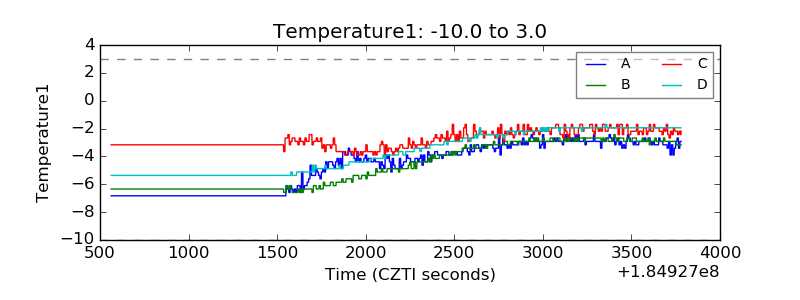 |
| Veto HV Monitor | 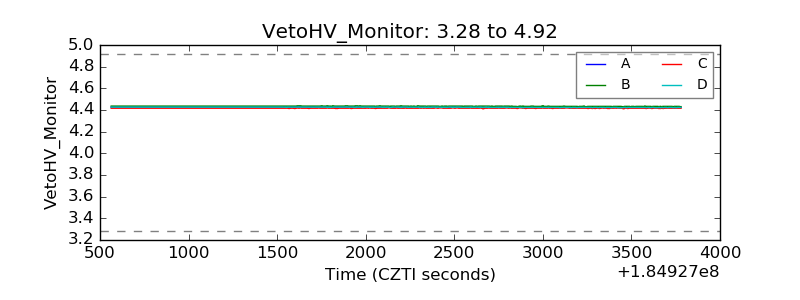 |
| Veto LLD | 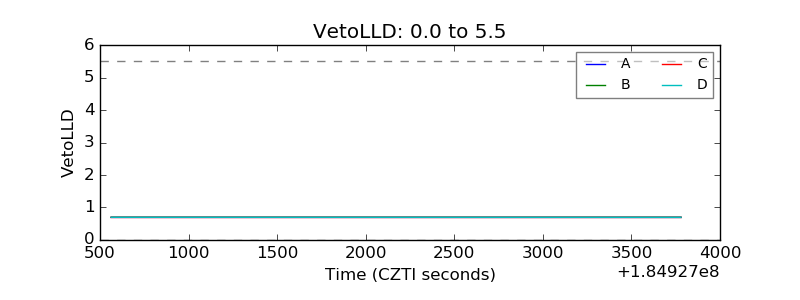 |
| Alpha Counter | 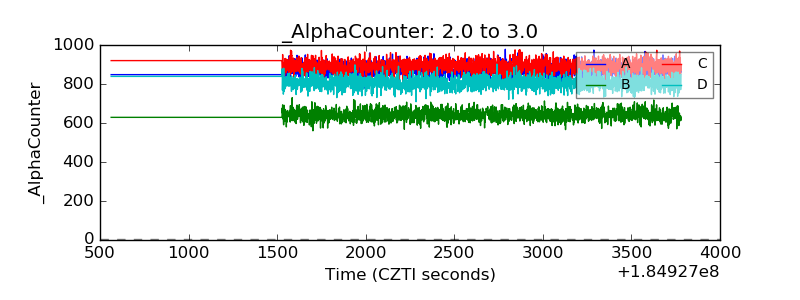 |
| _CPM_Rate | 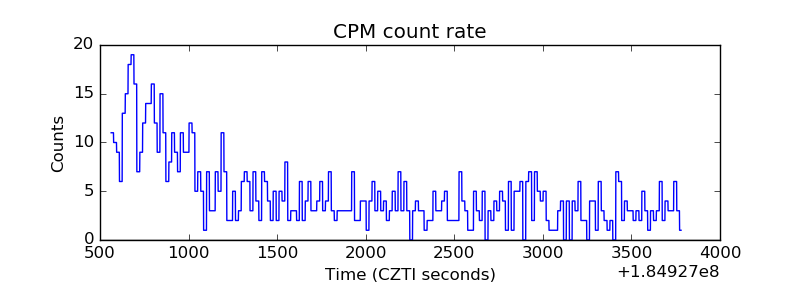 |
| CZT Counter | 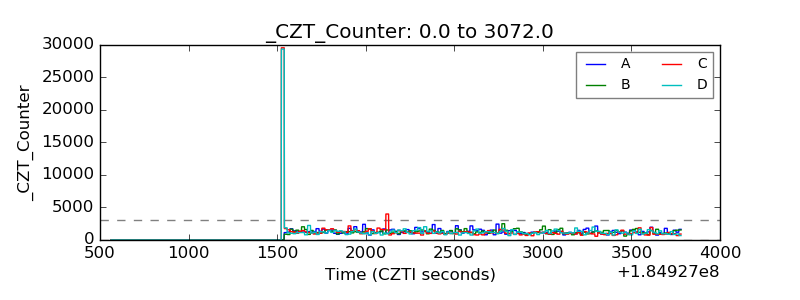 |
| +2.5 Volts monitor |  |
| +5 Volts monitor |  |
| _ROLL_ROT | 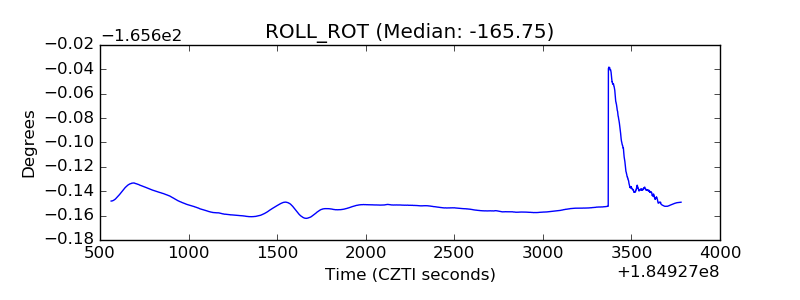 |
| _Roll_DEC | 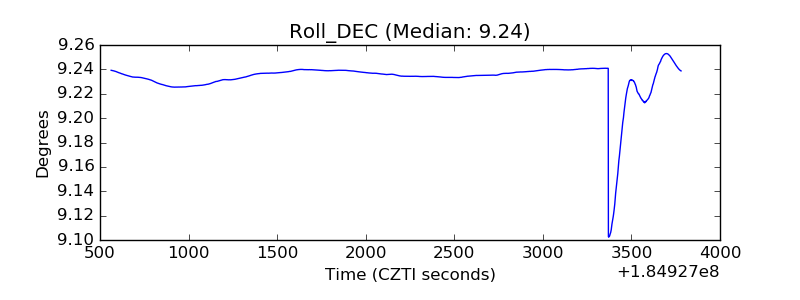 |
| _Roll_RA | 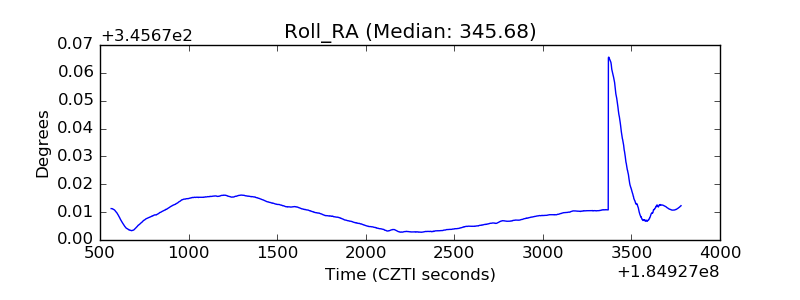 |
| Veto Counter | 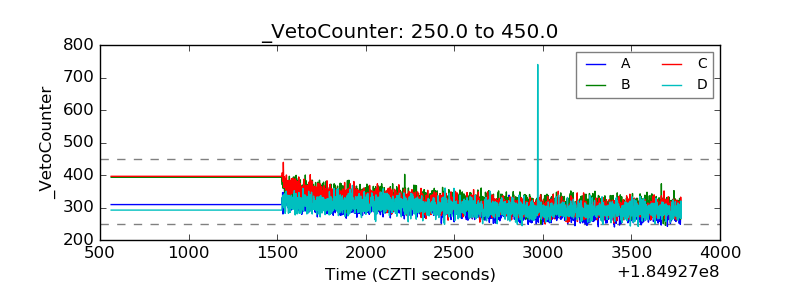 |