| Param | Original file | Final file |
|---|---|---|
| Filename | modeM0/AS1P01_127T01_9000000090cztM0_level2.fits | modeM0/AS1P01_127T01_9000000090cztM0_level2_quad_clean.evt |
| Size (bytes) | 109,932,480 | 178,341,120 |
| Size | 104.8 MB | 170.1 MB |
| Events in quadrant A | 612,552 | 1,159,419 |
| Events in quadrant B | 608,520 | 1,146,852 |
| Events in quadrant C | 615,174 | 1,122,934 |
| Events in quadrant D | 511,602 | 990,706 |
| Mode M9 | |||
|---|---|---|---|
| Quadrant | BADHDUFLAG | Total packets | Discarded packets |
| A | 0 | 70 | 0 |
| B | 0 | 70 | 0 |
| C | 0 | 70 | 0 |
| D | 0 | 70 | 0 |
| Mode SS | |||
|---|---|---|---|
| Quadrant | BADHDUFLAG | Total packets | Discarded packets |
| A | 0 | 292 | 0 |
| B | 0 | 292 | 0 |
| C | 0 | 292 | 0 |
| D | 0 | 292 | 0 |
| Mode M0 | |||
|---|---|---|---|
| Quadrant | BADHDUFLAG | Total packets | Discarded packets |
| A | 0 | 57451 | 0 |
| B | 0 | 58018 | 0 |
| C | 0 | 54698 | 0 |
| D | 0 | 64300 | 0 |
| Quadrant | Total seconds | Saturated seconds | Saturation percentage |
|---|---|---|---|
| A | 14209 | 17 | 0.119642% |
| B | 14205 | 73 | 0.513904% |
| C | 14204 | 5 | 0.035201% |
| D | 14203 | 566 | 3.985074% |
Noise dominated data is calculated using 1-second bins in cleaned event files. If a bin has >2000 counts, and if more than 50% of those come from <1% of pixels, then it is considered to be noise-dominated and hence unusable.
| Quadrant | # 1 sec bins | Bins with >0 counts | Bins with >2000 counts | High rate bins dominated by noise | Noise dominated (total time) | Noise dominated (detector-on time) | Marked lightcurve |
|---|---|---|---|---|---|---|---|
| A | 26500 | 14212 | 0 | 0 | 0.00% | 0.00% |  |
| B | 26500 | 14206 | 0 | 0 | 0.00% | 0.00% |  |
| C | 26502 | 14212 | 0 | 0 | 0.00% | 0.00% |  |
| D | 26502 | 14191 | 0 | 0 | 0.00% | 0.00% |  |
Top three noisy pixels from each quadrant. If the there are fewer than three noisy pixels in the level2.evt file, extra rows are filled as -1
| Pixel properties | Quadrant properties | ||||||
|---|---|---|---|---|---|---|---|
| Quadrant | DetID | PixID | Counts | Sigma | Mean | Median | Sigma |
| A | 0 | 29 | 586 | 10.94 | 159 | 149 | 39.9 |
| A | 7 | 110 | 554 | 10.14 | 159 | 149 | 39.9 |
| A | 0 | 28 | 433 | 7.11 | 159 | 149 | 39.9 |
| B | 2 | 9 | 499 | 11.12 | 160 | 153 | 31.1 |
| B | 14 | 254 | 453 | 9.65 | 160 | 153 | 31.1 |
| B | 2 | 18 | 408 | 8.2 | 160 | 153 | 31.1 |
| C | 2 | 191 | 438 | 6.86 | 162 | 150 | 42.0 |
| C | 1 | 81 | 437 | 6.83 | 162 | 150 | 42.0 |
| C | 12 | 241 | 415 | 6.31 | 162 | 150 | 42.0 |
| D | 6 | 231 | 401 | 7.19 | 146 | 134 | 37.1 |
| D | 11 | 82 | 389 | 6.87 | 146 | 134 | 37.1 |
| D | 6 | 44 | 386 | 6.79 | 146 | 134 | 37.1 |
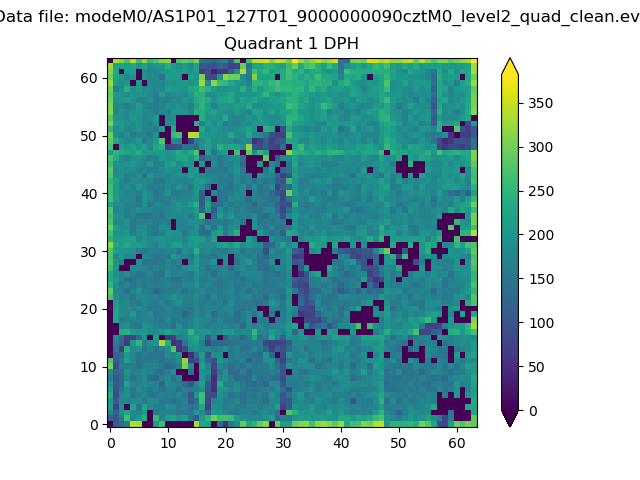
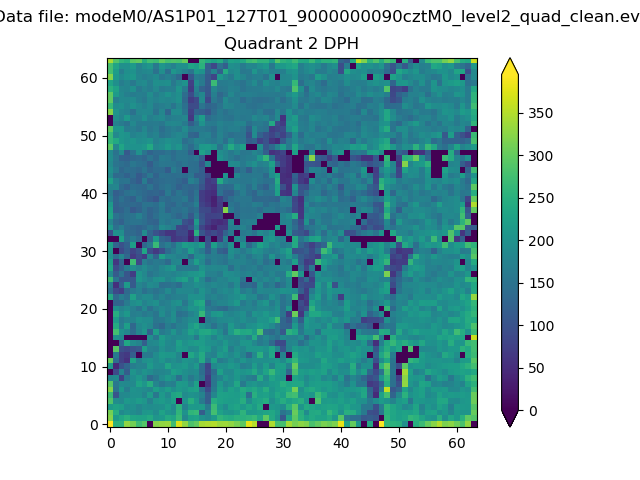
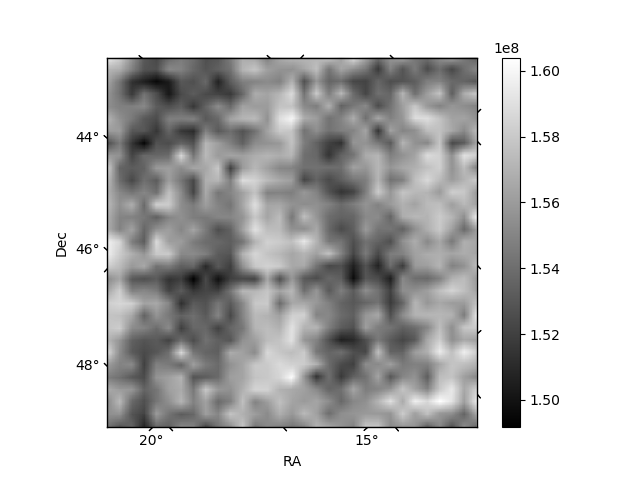
Histogram calculated using DETX and DETY for each event in the final _common_clean file
| Quadrant A |  |
 |
Quadrant B |
|---|---|---|---|
| Quadrant D | 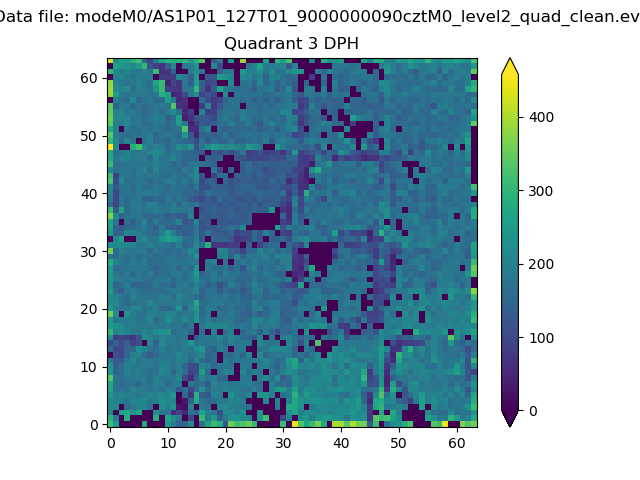 |
 |
Quadrant C |
| Plot type | Count rate plots | Images |
|---|---|---|
| Comparison with Poisson distribution Blue bars denote a histogram of data divided into 1 sec bins. Red curve is a Poisson curve with rate = median count rate of data. |
 |
 |
| Quadrant-wise count rates Data is divided into 100 sec bins |
 |
|
| Module-wise count rates for Quadrant A Data is divided into 100 sec bins |
 |
 |
| Module-wise count rates for Quadrant B Data is divided into 100 sec bins |
 |
 |
| Module-wise count rates for Quadrant C Data is divided into 100 sec bins |
 |
 |
| Module-wise count rates for Quadrant D Data is divided into 100 sec bins |
 |
 |
| Parameter | Plot |
|---|---|
| CZT HV Monitor |  |
| D_VDD | 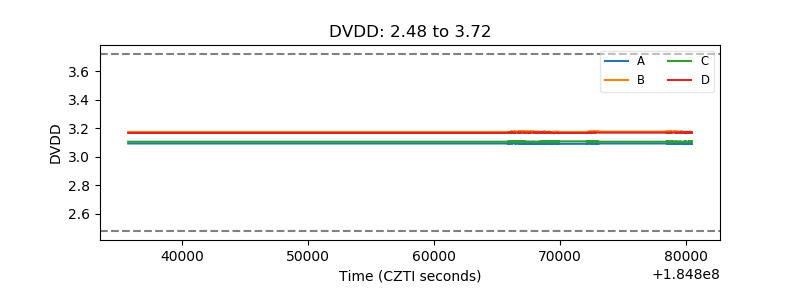 |
| Temperature 1 |  |
| Veto HV Monitor |  |
| Veto LLD |  |
| Alpha Counter |  |
| _CPM_Rate |  |
| CZT Counter |  |
| +2.5 Volts monitor |  |
| +5 Volts monitor |  |
| _ROLL_ROT |  |
| _Roll_DEC |  |
| _Roll_RA |  |
| Veto Counter |  |