| Param | Original file | Final file |
|---|---|---|
| Filename | modeM0/AS1P01_127T01_9000000090_00644cztM0_level2.evt | modeM0/AS1P01_127T01_9000000090_00644cztM0_level2_quad_clean.evt |
| Size (bytes) | 1,259,631,360 | 112,685,760 |
| Size | 1.2 GB | 107.5 MB |
| Events in quadrant A | 9,281,625 | 725,867 |
| Events in quadrant B | 9,205,001 | 721,277 |
| Events in quadrant C | 8,589,293 | 723,446 |
| Events in quadrant D | 10,537,268 | 681,300 |
| Mode M9 | |||
|---|---|---|---|
| Quadrant | BADHDUFLAG | Total packets | Discarded packets |
| A | 0 | 43 | 0 |
| B | 0 | 44 | 1 |
| C | 0 | 43 | 0 |
| D | 0 | 43 | 0 |
| Mode SS | |||
|---|---|---|---|
| Quadrant | BADHDUFLAG | Total packets | Discarded packets |
| A | 0 | 175 | 7 |
| B | 0 | 173 | 5 |
| C | 0 | 174 | 6 |
| D | 0 | 173 | 5 |
| Mode M0 | |||
|---|---|---|---|
| Quadrant | BADHDUFLAG | Total packets | Discarded packets |
| A | 0 | 34764 | 1445 |
| B | 0 | 34727 | 1635 |
| C | 0 | 32589 | 1346 |
| D | 0 | 38730 | 1676 |
| Quadrant | Total seconds | Saturated seconds | Saturation percentage |
|---|---|---|---|
| A | 8061 | 12 | 0.148865% |
| B | 8057 | 35 | 0.434405% |
| C | 8056 | 3 | 0.037239% |
| D | 8056 | 326 | 4.046673% |
Noise dominated data is calculated using 1-second bins in cleaned event files. If a bin has >2000 counts, and if more than 50% of those come from <1% of pixels, then it is considered to be noise-dominated and hence unusable.
| Quadrant | # 1 sec bins | Bins with >0 counts | Bins with >2000 counts | High rate bins dominated by noise | Noise dominated (total time) | Noise dominated (detector-on time) | Marked lightcurve |
|---|---|---|---|---|---|---|---|
| A | 12905 | 8073 | 180 | 180 | 1.39% | 2.23% | 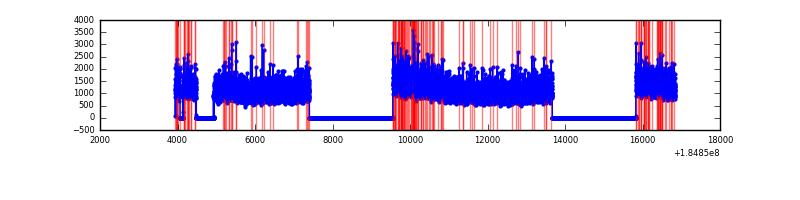 |
| B | 12905 | 8072 | 149 | 149 | 1.15% | 1.85% | 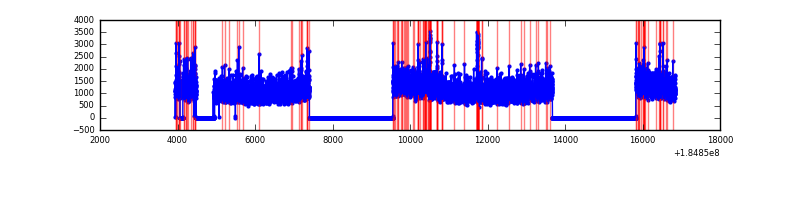 |
| C | 12907 | 8076 | 52 | 52 | 0.40% | 0.64% | 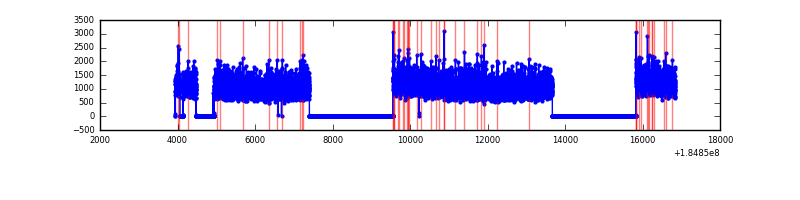 |
| D | 12907 | 8072 | 751 | 751 | 5.82% | 9.30% |  |
Top three noisy pixels from each quadrant. If the there are fewer than three noisy pixels in the level2.evt file, extra rows are filled as -1
| Pixel properties | Quadrant properties | ||||||
|---|---|---|---|---|---|---|---|
| Quadrant | DetID | PixID | Counts | Sigma | Mean | Median | Sigma |
| A | 14 | 79 | 70843 | 132.22 | 2344 | 2316 | 518.3 |
| A | 0 | 238 | 49972 | 91.95 | 2344 | 2316 | 518.3 |
| A | 12 | 133 | 35561 | 64.15 | 2344 | 2316 | 518.3 |
| B | 7 | 221 | 127506 | 230.16 | 2316 | 2332 | 543.9 |
| B | 5 | 249 | 80471 | 143.67 | 2316 | 2332 | 543.9 |
| B | 0 | 230 | 37303 | 64.3 | 2316 | 2332 | 543.9 |
| C | 15 | 241 | 30825 | 46.9 | 2172 | 2256 | 609.2 |
| C | 10 | 17 | 14395 | 19.93 | 2172 | 2256 | 609.2 |
| C | 9 | 52 | 13930 | 19.16 | 2172 | 2256 | 609.2 |
| D | 1 | 4 | 736263 | 1139.34 | 2066 | 2154 | 644.3 |
| D | 13 | 216 | 382316 | 590.01 | 2066 | 2154 | 644.3 |
| D | 13 | 221 | 342915 | 528.86 | 2066 | 2154 | 644.3 |
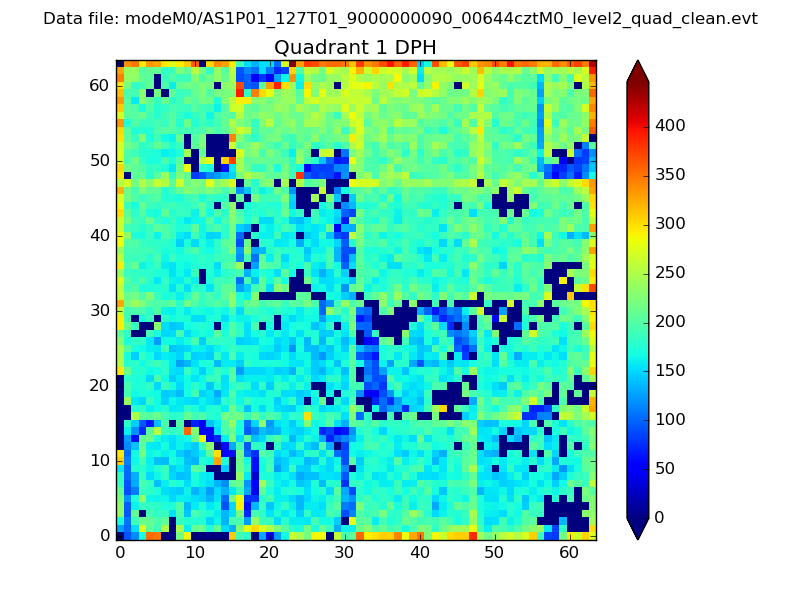
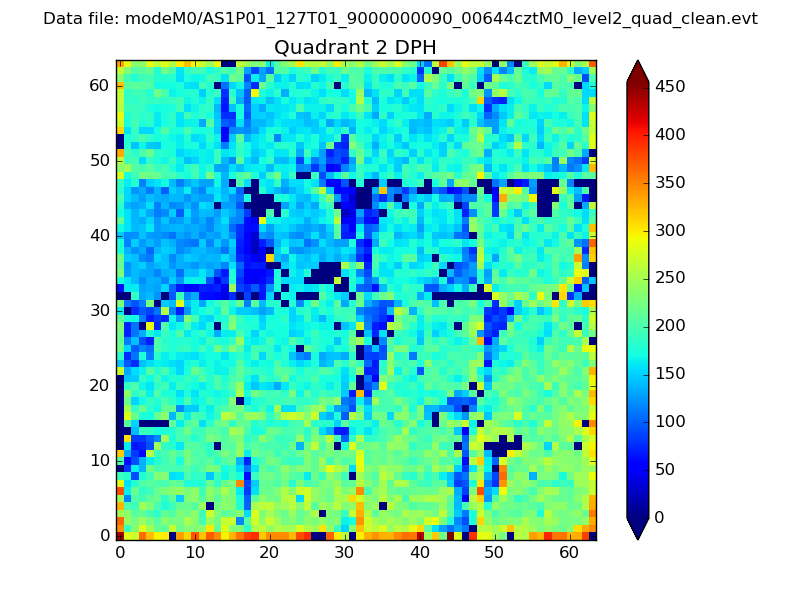
Histogram calculated using DETX and DETY for each event in the final _common_clean file
| Quadrant A | 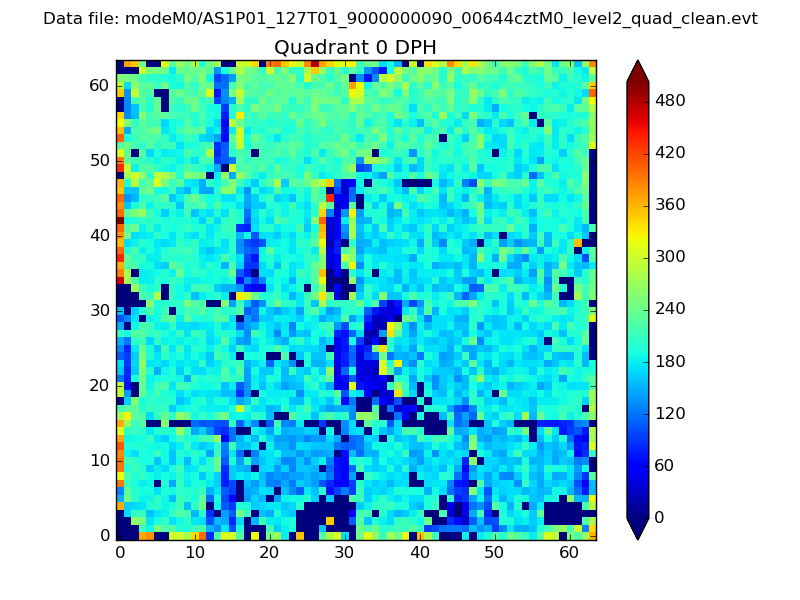 |
 |
Quadrant B |
|---|---|---|---|
| Quadrant D | 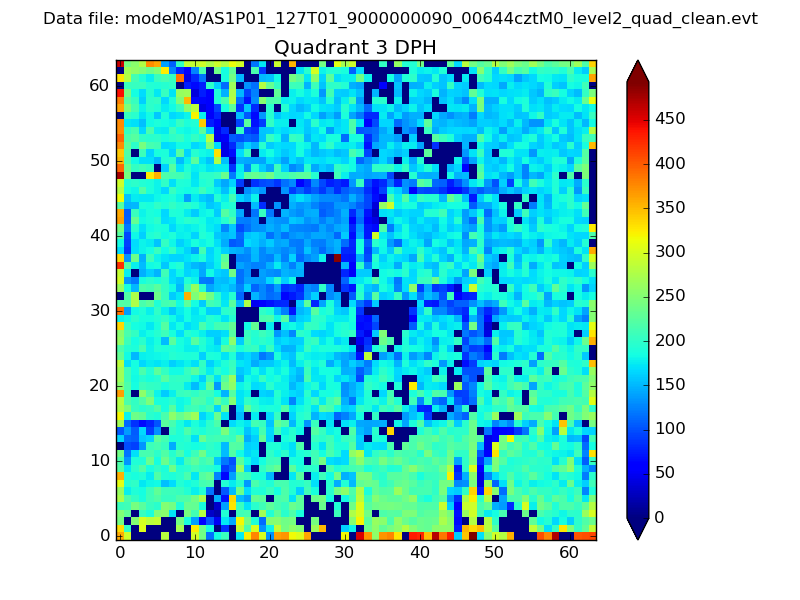 |
 |
Quadrant C |
| Plot type | Count rate plots | Images |
|---|---|---|
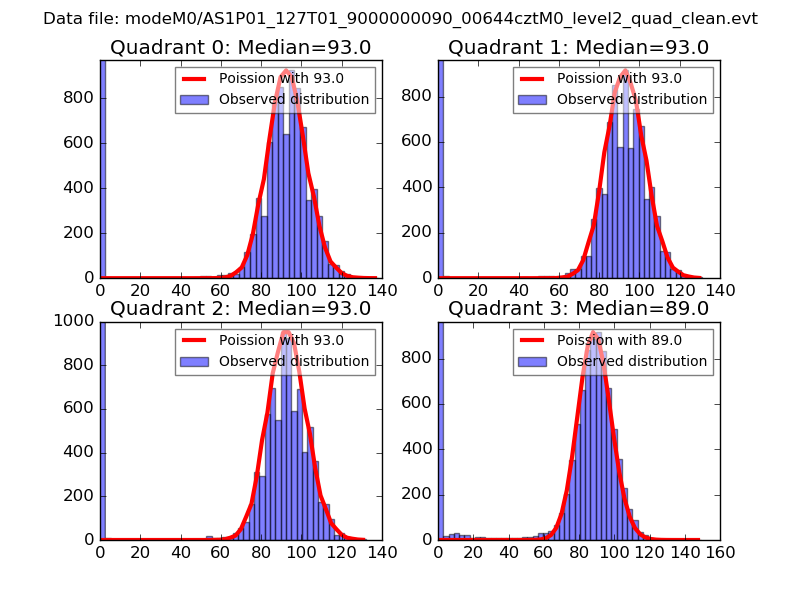
| Comparison with Poisson distribution Blue bars denote a histogram of data divided into 1 sec bins. Red curve is a Poisson curve with rate = median count rate of data. |
 |
 |
| Quadrant-wise count rates Data is divided into 100 sec bins |
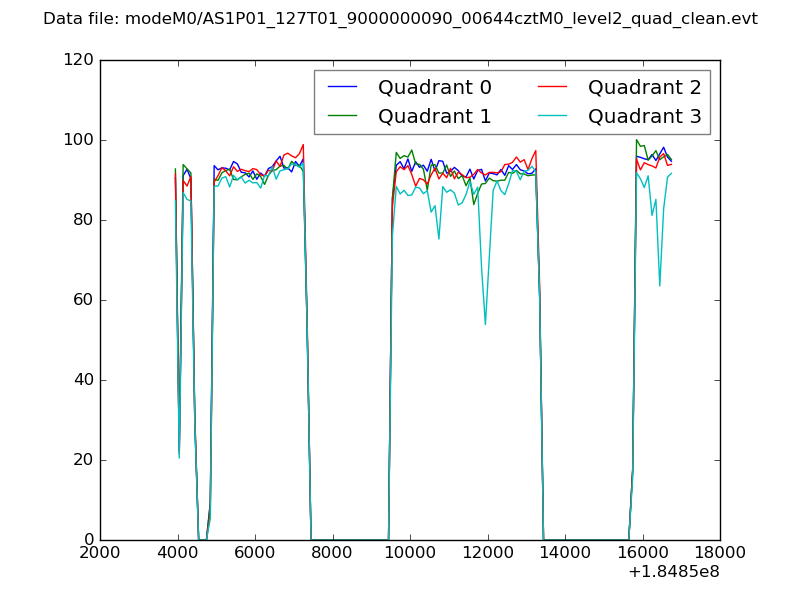 |
|
| Module-wise count rates for Quadrant A Data is divided into 100 sec bins |
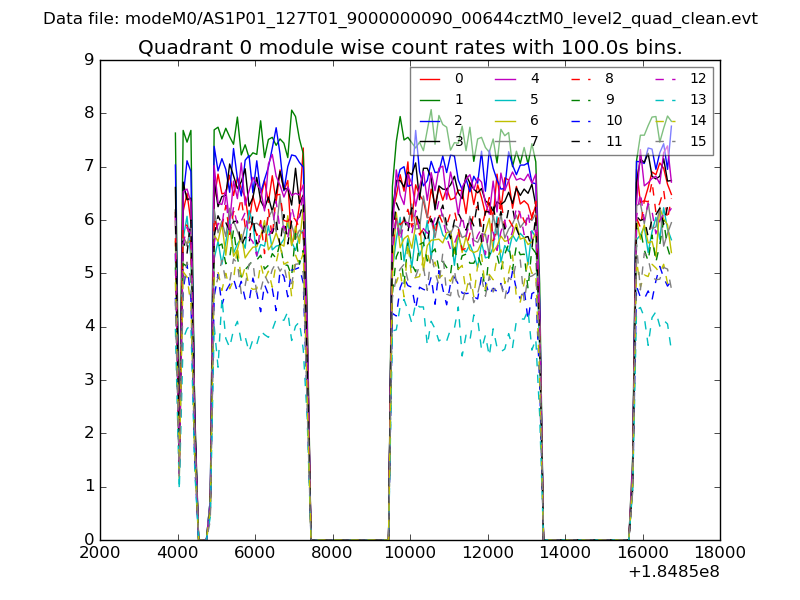 |
 |
| Module-wise count rates for Quadrant B Data is divided into 100 sec bins |
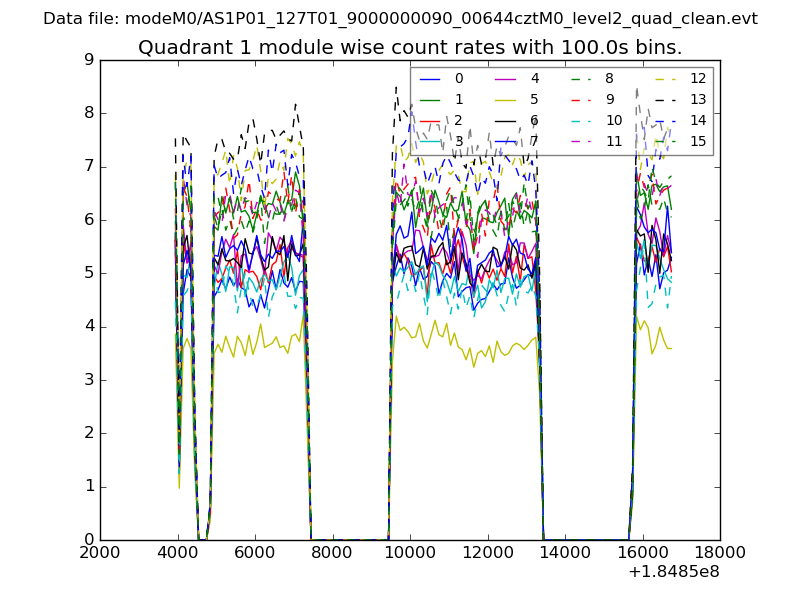 |
 |
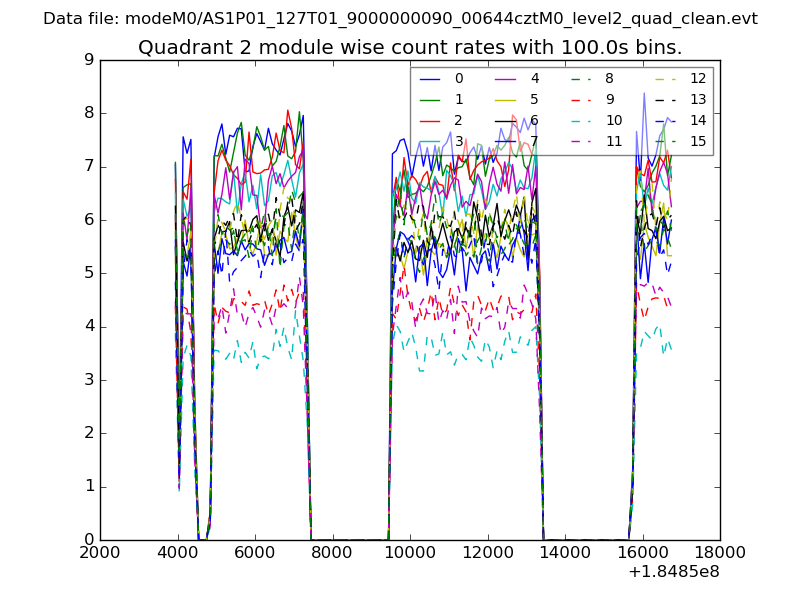
| Module-wise count rates for Quadrant C Data is divided into 100 sec bins |
 |
 |
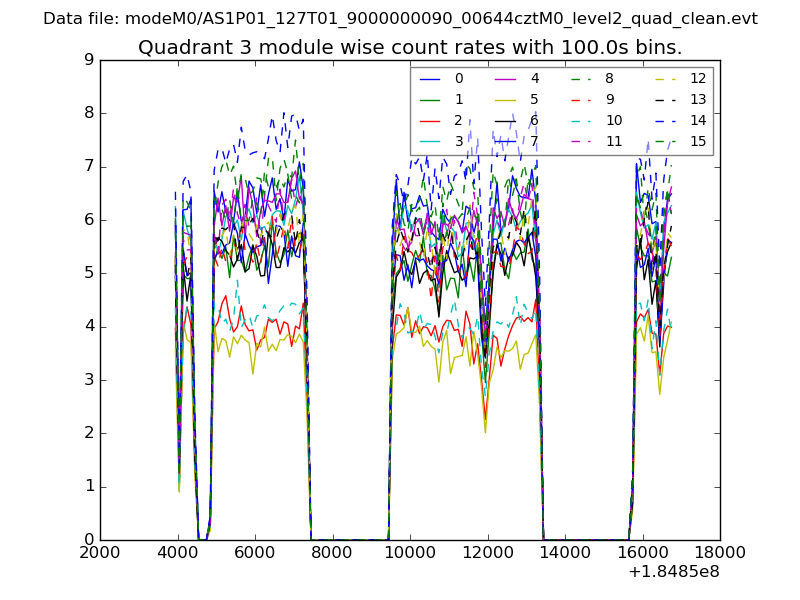
| Module-wise count rates for Quadrant D Data is divided into 100 sec bins |
 |
 |
| Parameter | Plot |
|---|---|
| CZT HV Monitor | 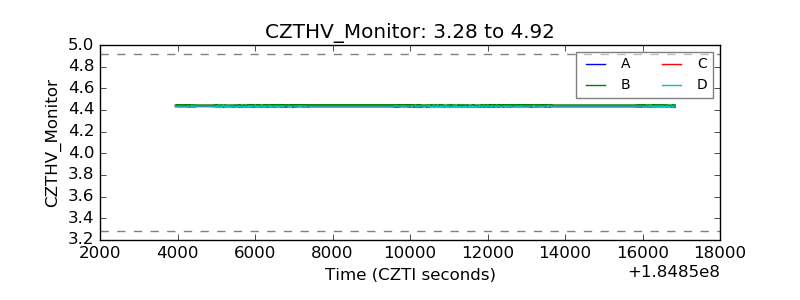 |
| D_VDD |  |
| Temperature 1 | 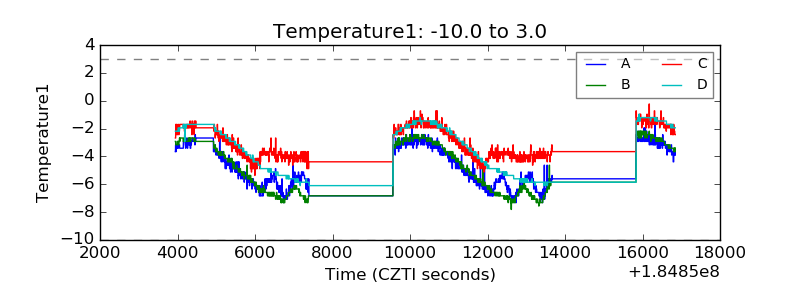 |
| Veto HV Monitor |  |
| Veto LLD |  |
| Alpha Counter |  |
| _CPM_Rate | 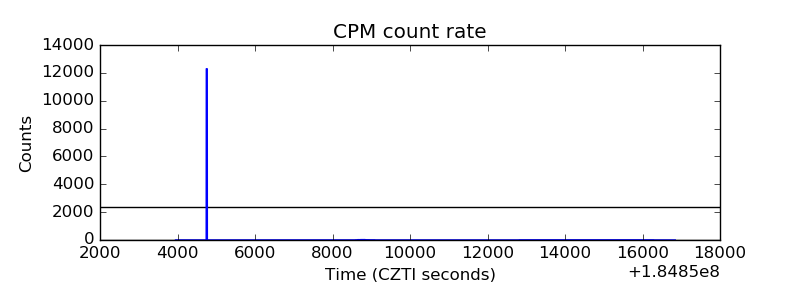 |
| CZT Counter | 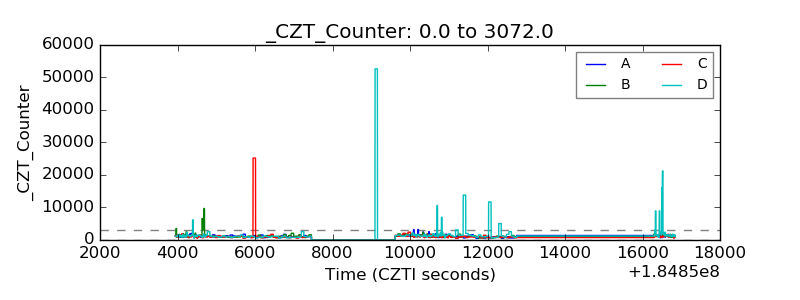 |
| +2.5 Volts monitor |  |
| +5 Volts monitor |  |
| _ROLL_ROT | 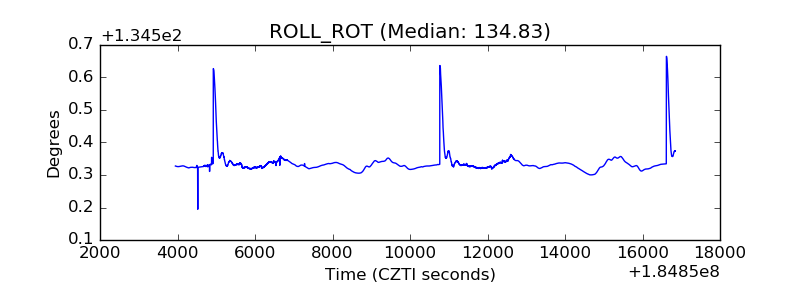 |
| _Roll_DEC | 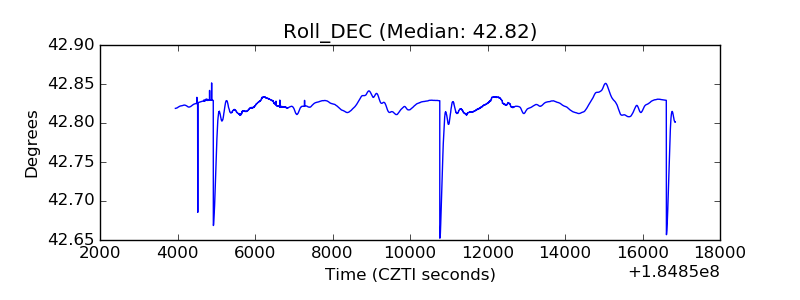 |
| _Roll_RA | 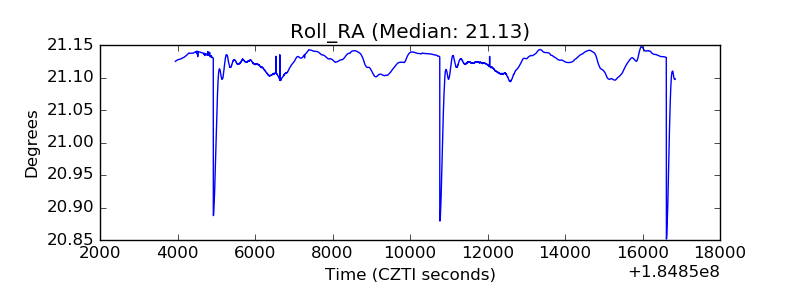 |
| Veto Counter | 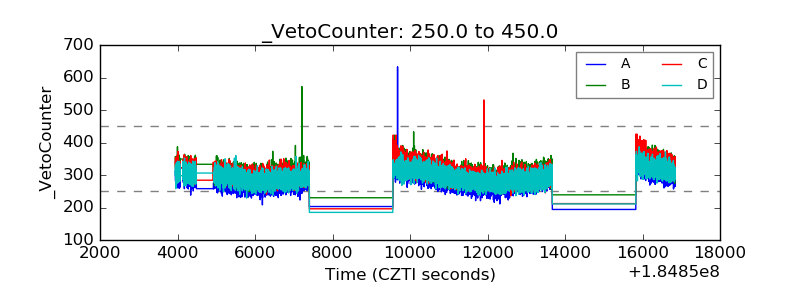 |