| Param | Original file | Final file |
|---|---|---|
| Filename | modeM0/AS1P01_127T01_9000000090_00645cztM0_level2.evt | modeM0/AS1P01_127T01_9000000090_00645cztM0_level2_quad_clean.evt |
| Size (bytes) | 801,308,160 | 65,617,920 |
| Size | 764.2 MB | 62.6 MB |
| Events in quadrant A | 5,830,635 | 414,644 |
| Events in quadrant B | 5,899,497 | 410,632 |
| Events in quadrant C | 5,485,095 | 414,167 |
| Events in quadrant D | 6,713,453 | 390,260 |
| Mode M9 | |||
|---|---|---|---|
| Quadrant | BADHDUFLAG | Total packets | Discarded packets |
| A | 0 | 25 | 0 |
| B | 0 | 25 | 0 |
| C | 0 | 25 | 0 |
| D | 0 | 25 | 0 |
| Mode SS | |||
|---|---|---|---|
| Quadrant | BADHDUFLAG | Total packets | Discarded packets |
| A | 0 | 104 | 0 |
| B | 0 | 104 | 0 |
| C | 0 | 104 | 0 |
| D | 0 | 104 | 0 |
| Mode M0 | |||
|---|---|---|---|
| Quadrant | BADHDUFLAG | Total packets | Discarded packets |
| A | 0 | 20955 | 2 |
| B | 0 | 21132 | 2 |
| C | 0 | 19927 | 2 |
| D | 0 | 23595 | 8 |
| Quadrant | Total seconds | Saturated seconds | Saturation percentage |
|---|---|---|---|
| A | 5093 | 6 | 0.117809% |
| B | 5093 | 11 | 0.215983% |
| C | 5093 | 2 | 0.039270% |
| D | 5092 | 192 | 3.770621% |
Noise dominated data is calculated using 1-second bins in cleaned event files. If a bin has >2000 counts, and if more than 50% of those come from <1% of pixels, then it is considered to be noise-dominated and hence unusable.
| Quadrant | # 1 sec bins | Bins with >0 counts | Bins with >2000 counts | High rate bins dominated by noise | Noise dominated (total time) | Noise dominated (detector-on time) | Marked lightcurve |
|---|---|---|---|---|---|---|---|
| A | 7249 | 5094 | 101 | 101 | 1.39% | 1.98% | 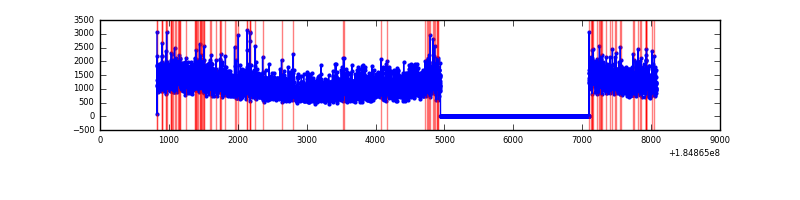 |
| B | 7249 | 5094 | 105 | 105 | 1.45% | 2.06% | 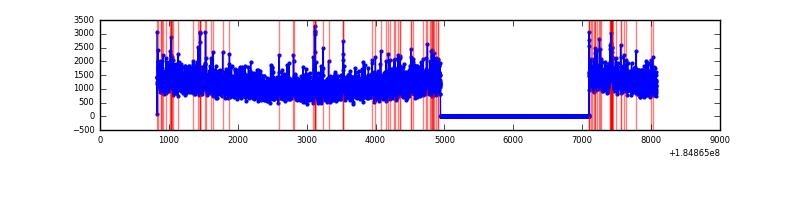 |
| C | 7249 | 5094 | 33 | 33 | 0.46% | 0.65% |  |
| D | 7248 | 5093 | 533 | 533 | 7.35% | 10.47% | 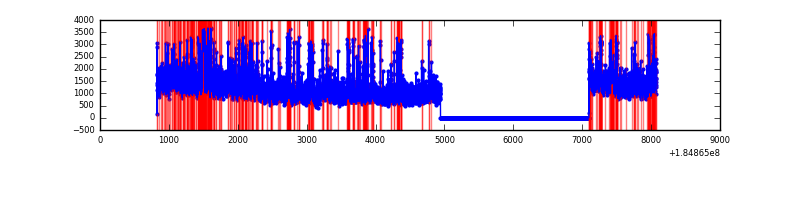 |
Top three noisy pixels from each quadrant. If the there are fewer than three noisy pixels in the level2.evt file, extra rows are filled as -1
| Pixel properties | Quadrant properties | ||||||
|---|---|---|---|---|---|---|---|
| Quadrant | DetID | PixID | Counts | Sigma | Mean | Median | Sigma |
| A | 0 | 238 | 30125 | 87.17 | 1486 | 1465 | 328.8 |
| A | 13 | 160 | 19085 | 53.59 | 1486 | 1465 | 328.8 |
| A | 0 | 69 | 19070 | 53.55 | 1486 | 1465 | 328.8 |
| B | 0 | 220 | 65517 | 181.59 | 1487 | 1496 | 352.6 |
| B | 5 | 249 | 43886 | 120.23 | 1487 | 1496 | 352.6 |
| B | 0 | 230 | 32670 | 88.42 | 1487 | 1496 | 352.6 |
| C | 10 | 17 | 9810 | 21.54 | 1386 | 1442 | 388.5 |
| C | 15 | 241 | 9573 | 20.93 | 1386 | 1442 | 388.5 |
| C | 5 | 17 | 6815 | 13.83 | 1386 | 1442 | 388.5 |
| D | 1 | 4 | 538436 | 1307.65 | 1312 | 1364 | 410.7 |
| D | 13 | 216 | 243010 | 588.35 | 1312 | 1364 | 410.7 |
| D | 13 | 221 | 221259 | 535.4 | 1312 | 1364 | 410.7 |
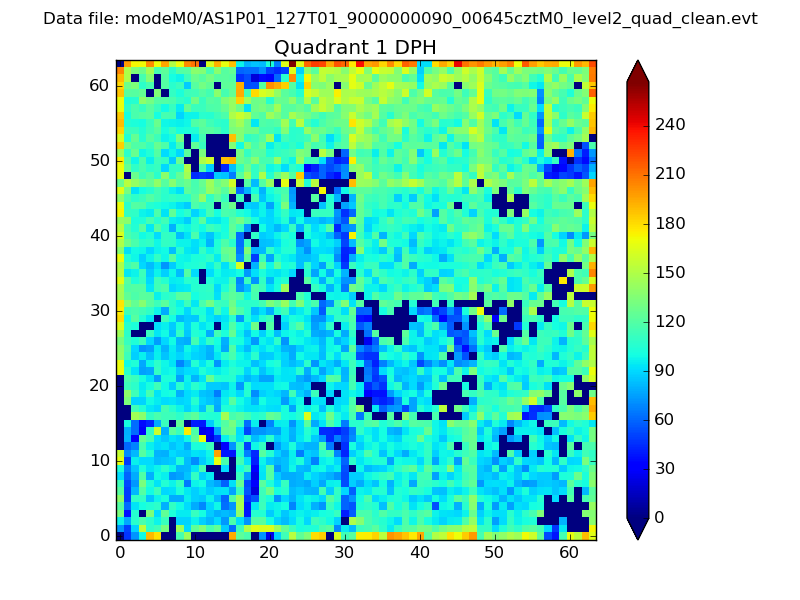
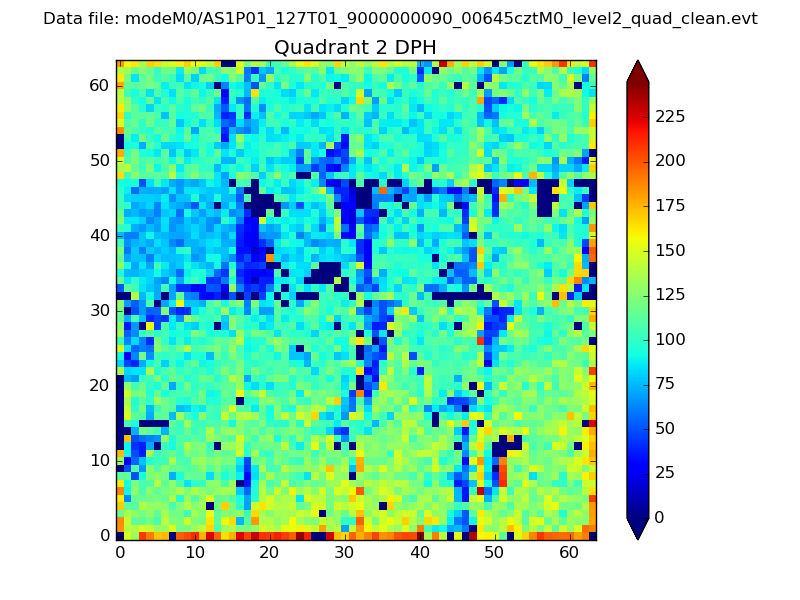
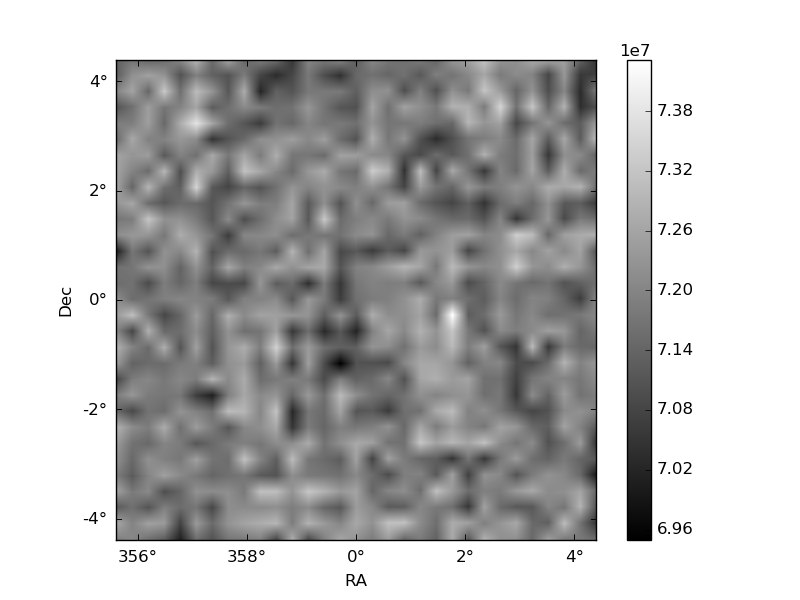
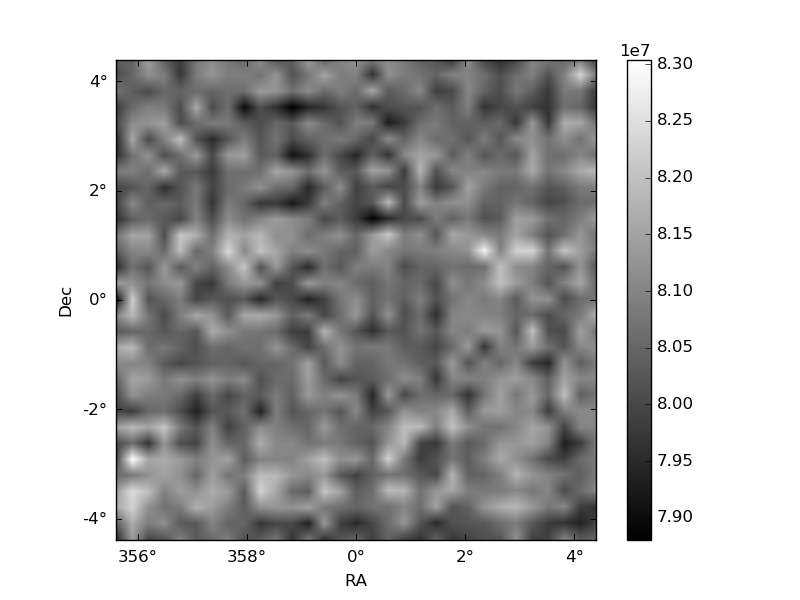
Histogram calculated using DETX and DETY for each event in the final _common_clean file
| Quadrant A |  |
 |
Quadrant B |
|---|---|---|---|
| Quadrant D | 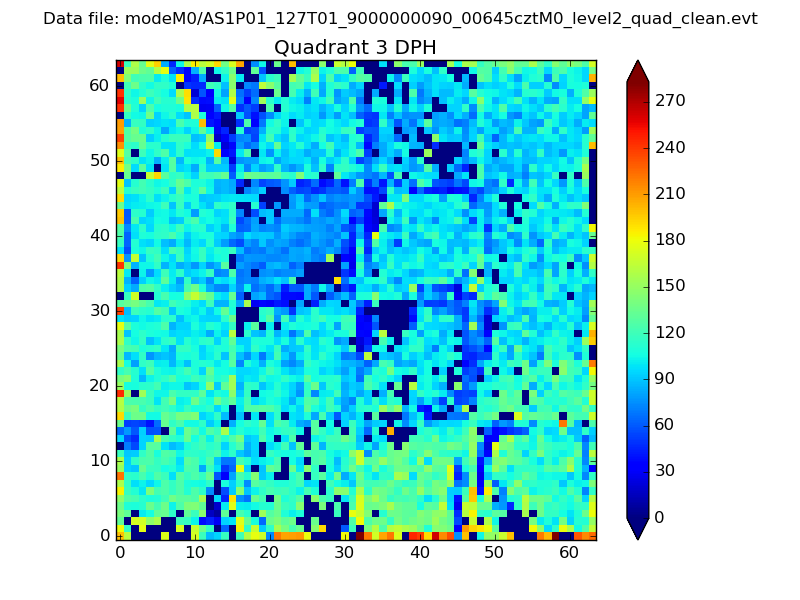 |
 |
Quadrant C |
| Plot type | Count rate plots | Images |
|---|---|---|
| Comparison with Poisson distribution Blue bars denote a histogram of data divided into 1 sec bins. Red curve is a Poisson curve with rate = median count rate of data. |
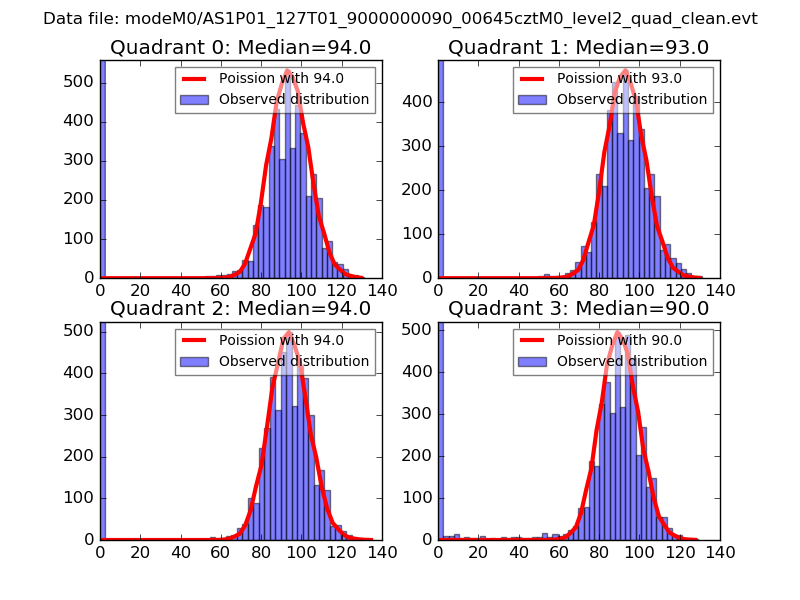 |
 |
| Quadrant-wise count rates Data is divided into 100 sec bins |
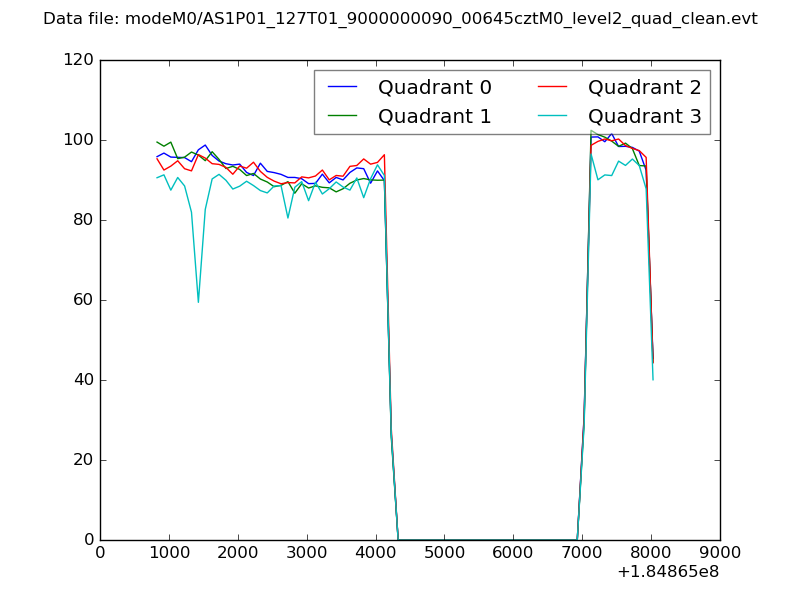 |
|
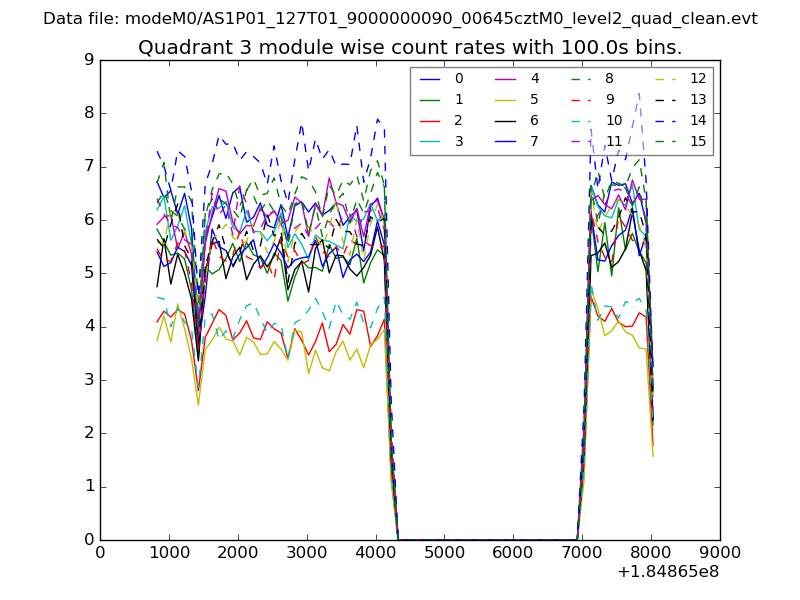
| Module-wise count rates for Quadrant A Data is divided into 100 sec bins |
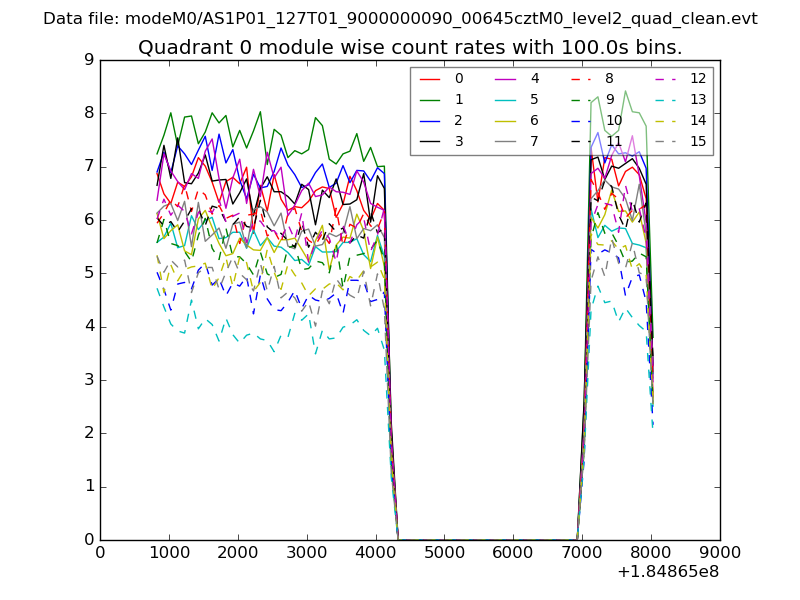 |
 |
| Module-wise count rates for Quadrant B Data is divided into 100 sec bins |
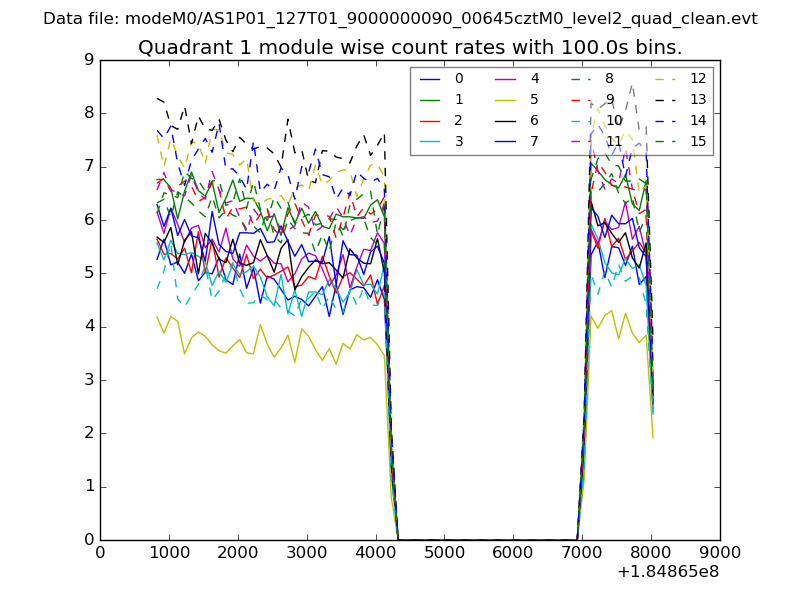 |
 |
| Module-wise count rates for Quadrant C Data is divided into 100 sec bins |
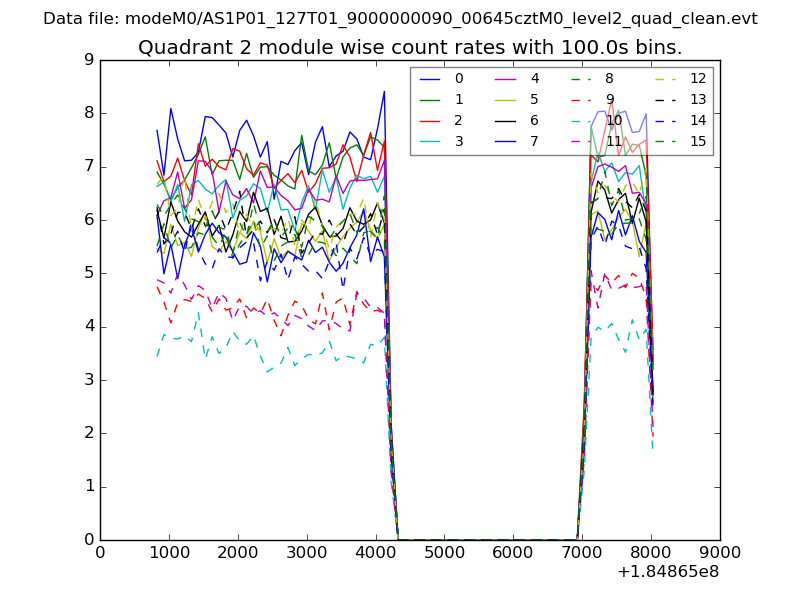 |
 |
| Module-wise count rates for Quadrant D Data is divided into 100 sec bins |
 |
 |
| Parameter | Plot |
|---|---|
| CZT HV Monitor | 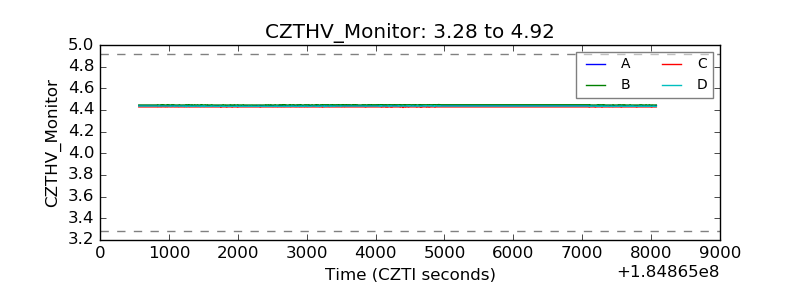 |
| D_VDD | 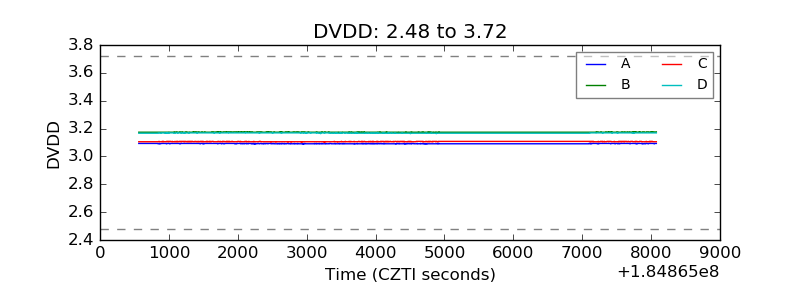 |
| Temperature 1 | 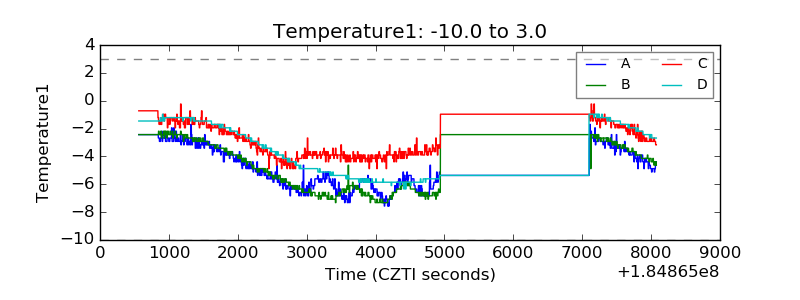 |
| Veto HV Monitor | 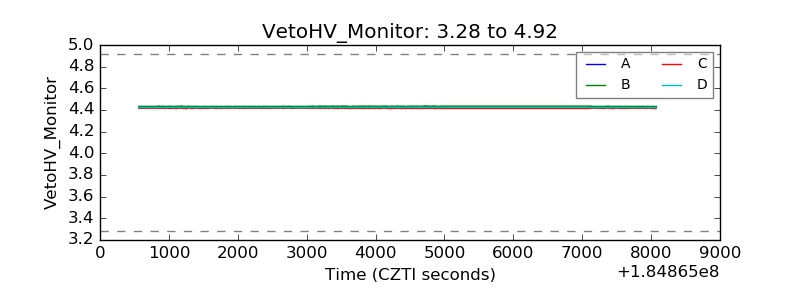 |
| Veto LLD | 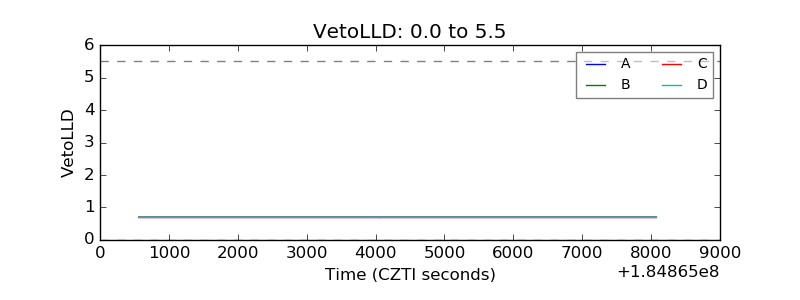 |
| Alpha Counter | 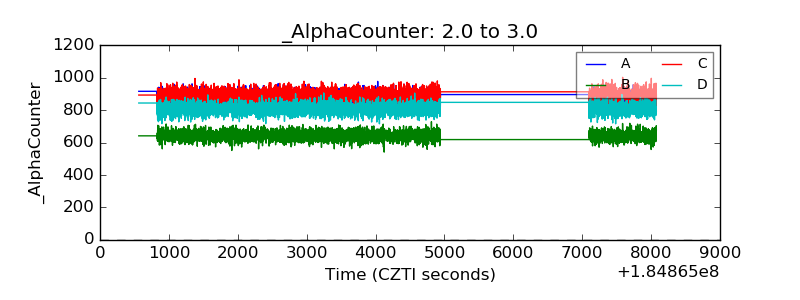 |
| _CPM_Rate | 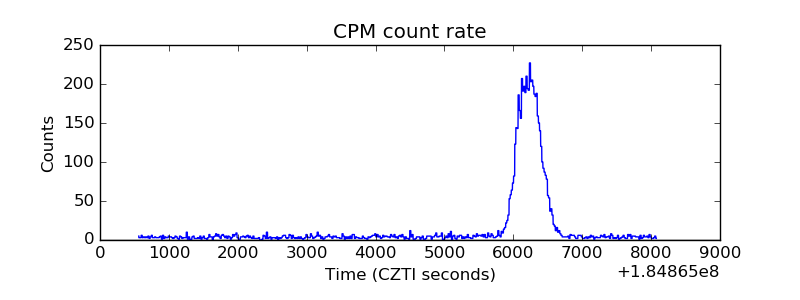 |
| CZT Counter | 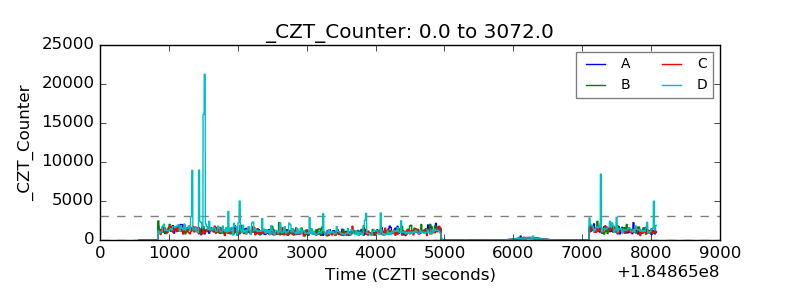 |
| +2.5 Volts monitor |  |
| +5 Volts monitor |  |
| _ROLL_ROT | 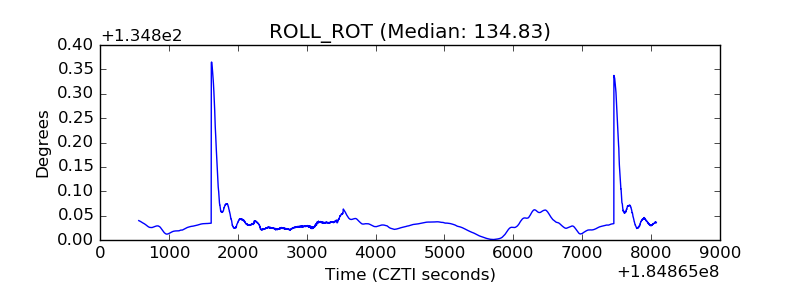 |
| _Roll_DEC | 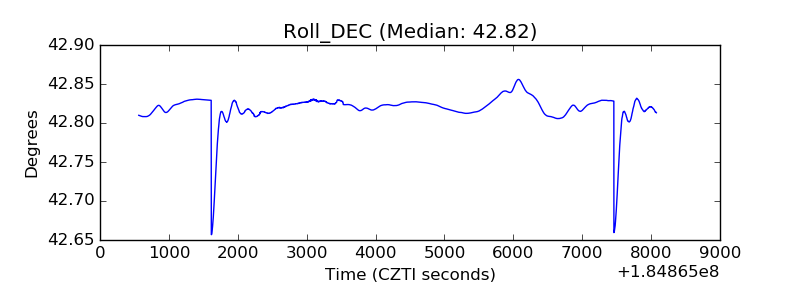 |
| _Roll_RA |  |
| Veto Counter | 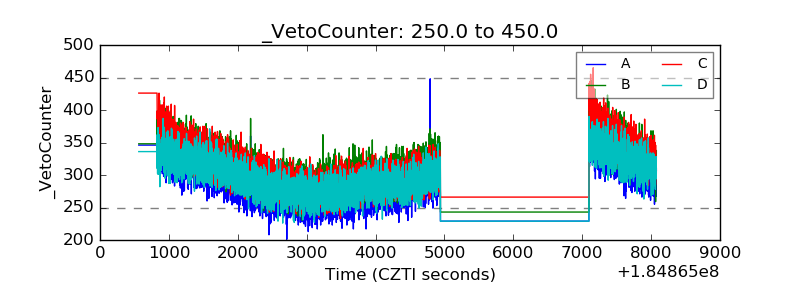 |