| Param | Original file | Final file |
|---|---|---|
| Filename | modeM0/AS1P01_124T01_9000000094cztM0_level2.fits | modeM0/AS1P01_124T01_9000000094cztM0_level2_quad_clean.evt |
| Size (bytes) | 332,064,000 | 369,982,080 |
| Size | 316.7 MB | 352.8 MB |
| Events in quadrant A | 1,872,044 | 2,178,717 |
| Events in quadrant B | 1,878,602 | 2,206,563 |
| Events in quadrant C | 1,858,780 | 2,081,124 |
| Events in quadrant D | 1,535,644 | 1,827,783 |
| Mode M9 | |||
|---|---|---|---|
| Quadrant | BADHDUFLAG | Total packets | Discarded packets |
| A | 0 | 216 | 0 |
| B | 0 | 216 | 0 |
| C | 0 | 216 | 0 |
| D | 0 | 216 | 0 |
| Mode M0 | |||
|---|---|---|---|
| Quadrant | BADHDUFLAG | Total packets | Discarded packets |
| A | 0 | 177519 | 0 |
| B | 0 | 178404 | 0 |
| C | 0 | 165342 | 0 |
| D | 0 | 189804 | 0 |
| Mode SS | |||
|---|---|---|---|
| Quadrant | BADHDUFLAG | Total packets | Discarded packets |
| A | 0 | 868 | 0 |
| B | 0 | 868 | 0 |
| C | 0 | 868 | 0 |
| D | 0 | 868 | 0 |
| Quadrant | Total seconds | Saturated seconds | Saturation percentage |
|---|---|---|---|
| A | 42390 | 165 | 0.389243% |
| B | 42390 | 223 | 0.526067% |
| C | 42390 | 330 | 0.778485% |
| D | 42390 | 1765 | 4.163718% |
Noise dominated data is calculated using 1-second bins in cleaned event files. If a bin has >2000 counts, and if more than 50% of those come from <1% of pixels, then it is considered to be noise-dominated and hence unusable.
| Quadrant | # 1 sec bins | Bins with >0 counts | Bins with >2000 counts | High rate bins dominated by noise | Noise dominated (total time) | Noise dominated (detector-on time) | Marked lightcurve |
|---|---|---|---|---|---|---|---|
| A | 63951 | 42388 | 0 | 0 | 0.00% | 0.00% | 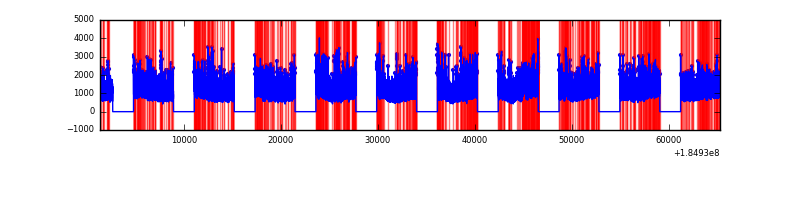 |
| B | 63951 | 42389 | 0 | 0 | 0.00% | 0.00% | 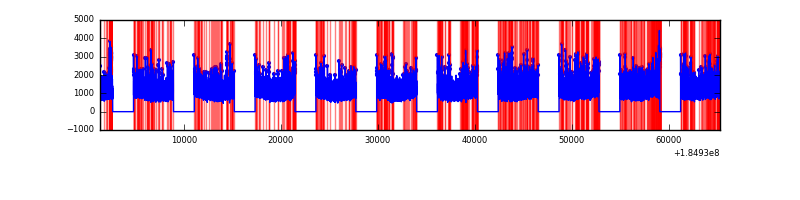 |
| C | 63951 | 42362 | 0 | 0 | 0.00% | 0.00% |  |
| D | 63951 | 42360 | 0 | 0 | 0.00% | 0.00% |  |
Top three noisy pixels from each quadrant. If the there are fewer than three noisy pixels in the level2.evt file, extra rows are filled as -1
| Pixel properties | Quadrant properties | ||||||
|---|---|---|---|---|---|---|---|
| Quadrant | DetID | PixID | Counts | Sigma | Mean | Median | Sigma |
| A | 7 | 110 | 1821 | 11.79 | 487 | 455 | 115.8 |
| A | 0 | 29 | 1717 | 10.89 | 487 | 455 | 115.8 |
| A | 0 | 30 | 1338 | 7.62 | 487 | 455 | 115.8 |
| B | 2 | 9 | 1536 | 12.11 | 495 | 471 | 87.9 |
| B | 14 | 254 | 1274 | 9.13 | 495 | 471 | 87.9 |
| B | 2 | 8 | 1214 | 8.45 | 495 | 471 | 87.9 |
| C | 2 | 191 | 1305 | 6.99 | 491 | 455 | 121.6 |
| C | 12 | 241 | 1303 | 6.97 | 491 | 455 | 121.6 |
| C | 3 | 235 | 1270 | 6.7 | 491 | 455 | 121.6 |
| D | 6 | 231 | 1166 | 7.1 | 439 | 404 | 107.3 |
| D | 6 | 44 | 1140 | 6.86 | 439 | 404 | 107.3 |
| D | 11 | 82 | 1103 | 6.51 | 439 | 404 | 107.3 |
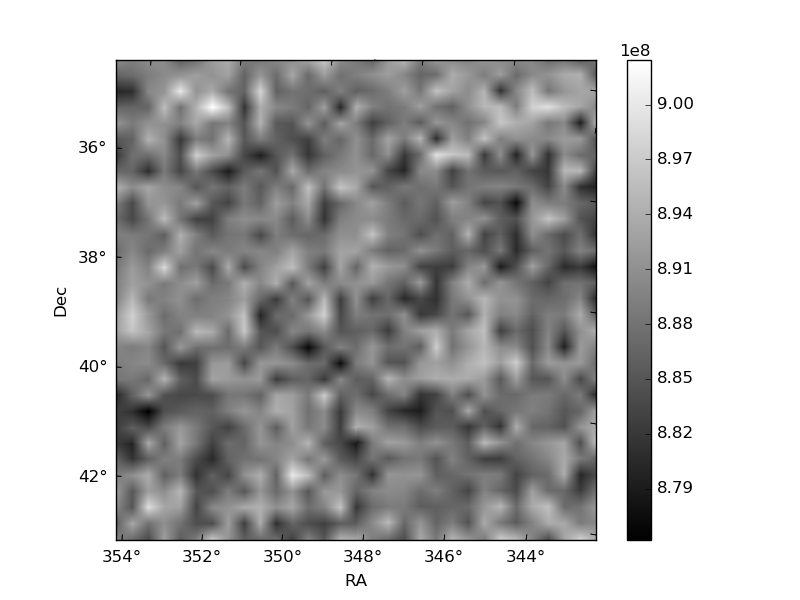
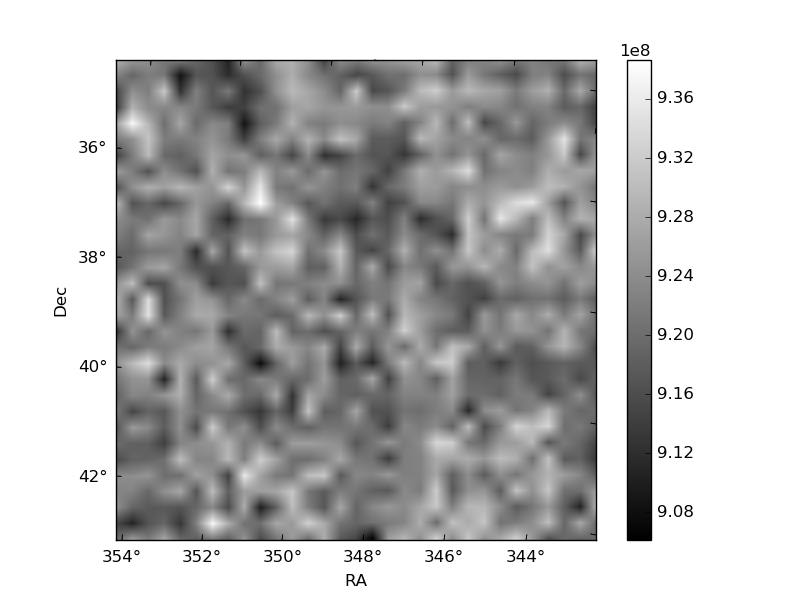
Histogram calculated using DETX and DETY for each event in the final _common_clean file
| Quadrant A |  |
 |
Quadrant B |
|---|---|---|---|
| Quadrant D |  |
 |
Quadrant C |
| Plot type | Count rate plots | Images |
|---|---|---|
| Comparison with Poisson distribution Blue bars denote a histogram of data divided into 1 sec bins. Red curve is a Poisson curve with rate = median count rate of data. |
 |
 |
| Quadrant-wise count rates Data is divided into 100 sec bins |
 |
|
| Module-wise count rates for Quadrant A Data is divided into 100 sec bins |
 |
 |
| Module-wise count rates for Quadrant B Data is divided into 100 sec bins |
 |
 |
| Module-wise count rates for Quadrant C Data is divided into 100 sec bins |
 |
 |
| Module-wise count rates for Quadrant D Data is divided into 100 sec bins |
 |
 |
| Parameter | Plot |
|---|---|
| CZT HV Monitor |  |
| D_VDD |  |
| Temperature 1 |  |
| Veto HV Monitor |  |
| Veto LLD | 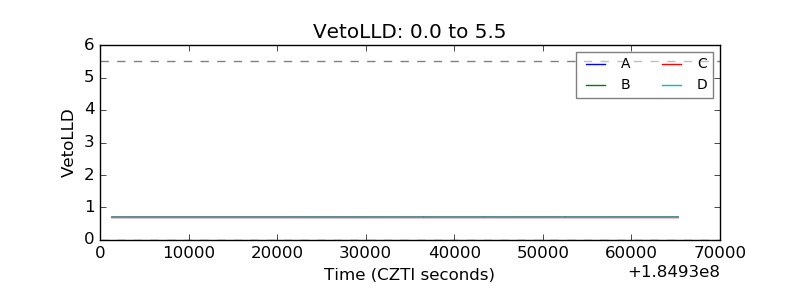 |
| Alpha Counter |  |
| _CPM_Rate |  |
| CZT Counter |  |
| +2.5 Volts monitor |  |
| +5 Volts monitor | 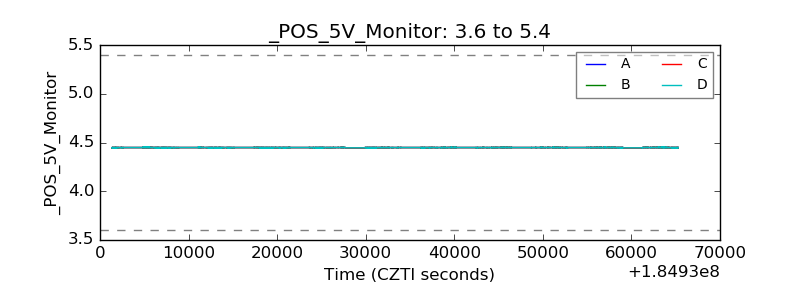 |
| _ROLL_ROT | 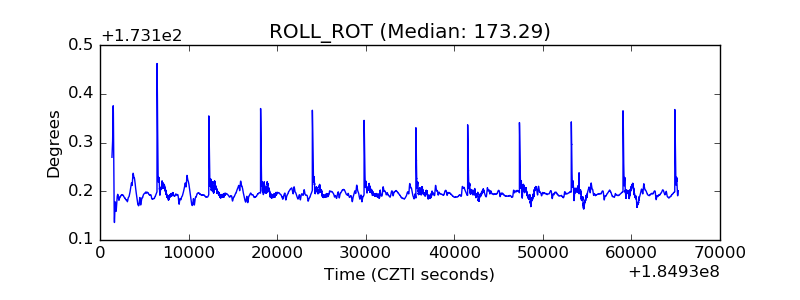 |
| _Roll_DEC |  |
| _Roll_RA |  |
| Veto Counter |  |