| Param | Original file | Final file |
|---|---|---|
| Filename | modeM0/AS1P01_124T01_9000000094_00657cztM0_level2.evt | modeM0/AS1P01_124T01_9000000094_00657cztM0_level2_quad_clean.evt |
| Size (bytes) | 843,249,600 | 69,819,840 |
| Size | 804.2 MB | 66.6 MB |
| Events in quadrant A | 6,158,422 | 446,869 |
| Events in quadrant B | 5,952,088 | 450,247 |
| Events in quadrant C | 5,469,735 | 444,422 |
| Events in quadrant D | 7,615,819 | 412,090 |
| Mode M9 | |||
|---|---|---|---|
| Quadrant | BADHDUFLAG | Total packets | Discarded packets |
| A | 0 | 35 | 0 |
| B | 0 | 35 | 0 |
| C | 0 | 35 | 0 |
| D | 0 | 35 | 0 |
| Mode M0 | |||
|---|---|---|---|
| Quadrant | BADHDUFLAG | Total packets | Discarded packets |
| A | 0 | 21941 | 2 |
| B | 0 | 21370 | 2 |
| C | 0 | 19896 | 2 |
| D | 0 | 26343 | 2 |
| Mode SS | |||
|---|---|---|---|
| Quadrant | BADHDUFLAG | Total packets | Discarded packets |
| A | 0 | 104 | 0 |
| B | 0 | 104 | 0 |
| C | 0 | 104 | 0 |
| D | 0 | 104 | 0 |
| Quadrant | Total seconds | Saturated seconds | Saturation percentage |
|---|---|---|---|
| A | 5144 | 4 | 0.077760% |
| B | 5144 | 5 | 0.097201% |
| C | 5144 | 2 | 0.038880% |
| D | 5144 | 381 | 7.406687% |
Noise dominated data is calculated using 1-second bins in cleaned event files. If a bin has >2000 counts, and if more than 50% of those come from <1% of pixels, then it is considered to be noise-dominated and hence unusable.
| Quadrant | # 1 sec bins | Bins with >0 counts | Bins with >2000 counts | High rate bins dominated by noise | Noise dominated (total time) | Noise dominated (detector-on time) | Marked lightcurve |
|---|---|---|---|---|---|---|---|
| A | 7300 | 5145 | 123 | 123 | 1.68% | 2.39% | 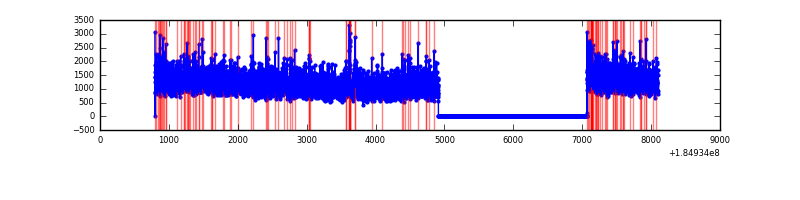 |
| B | 7300 | 5145 | 76 | 76 | 1.04% | 1.48% | 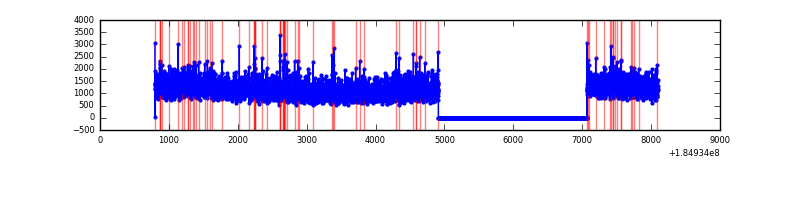 |
| C | 7300 | 5145 | 39 | 39 | 0.53% | 0.76% | 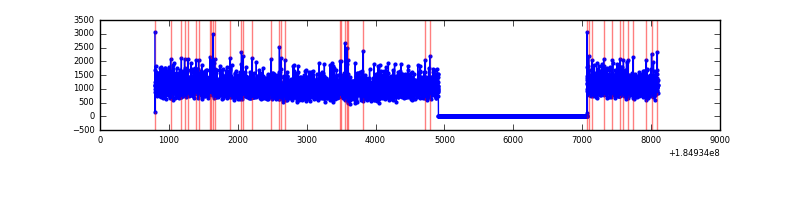 |
| D | 7300 | 5145 | 768 | 768 | 10.52% | 14.93% | 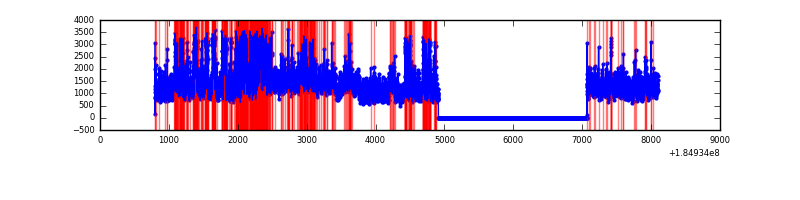 |
Top three noisy pixels from each quadrant. If the there are fewer than three noisy pixels in the level2.evt file, extra rows are filled as -1
| Pixel properties | Quadrant properties | ||||||
|---|---|---|---|---|---|---|---|
| Quadrant | DetID | PixID | Counts | Sigma | Mean | Median | Sigma |
| A | 0 | 69 | 42207 | 118.13 | 1548 | 1534 | 344.3 |
| A | 0 | 238 | 36629 | 101.93 | 1548 | 1534 | 344.3 |
| A | 13 | 147 | 31527 | 87.11 | 1548 | 1534 | 344.3 |
| B | 5 | 191 | 28715 | 75.69 | 1511 | 1524 | 359.2 |
| B | 3 | 6 | 23594 | 61.44 | 1511 | 1524 | 359.2 |
| B | 7 | 221 | 23322 | 60.68 | 1511 | 1524 | 359.2 |
| C | 9 | 83 | 20272 | 48.79 | 1380 | 1431 | 386.2 |
| C | 15 | 241 | 9727 | 21.48 | 1380 | 1431 | 386.2 |
| C | 9 | 52 | 9317 | 20.42 | 1380 | 1431 | 386.2 |
| D | 1 | 4 | 1323502 | 3127.97 | 1343 | 1394 | 422.7 |
| D | 13 | 25 | 494516 | 1166.68 | 1343 | 1394 | 422.7 |
| D | 13 | 216 | 181374 | 425.81 | 1343 | 1394 | 422.7 |
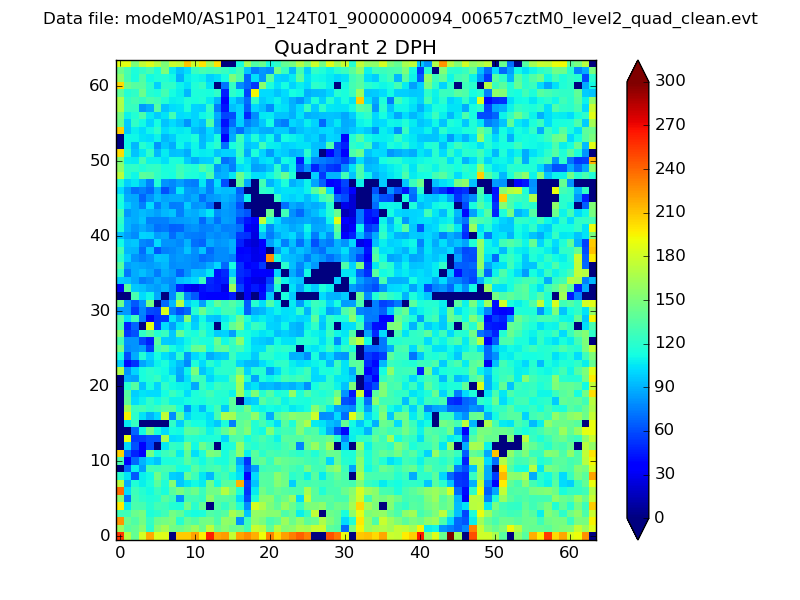
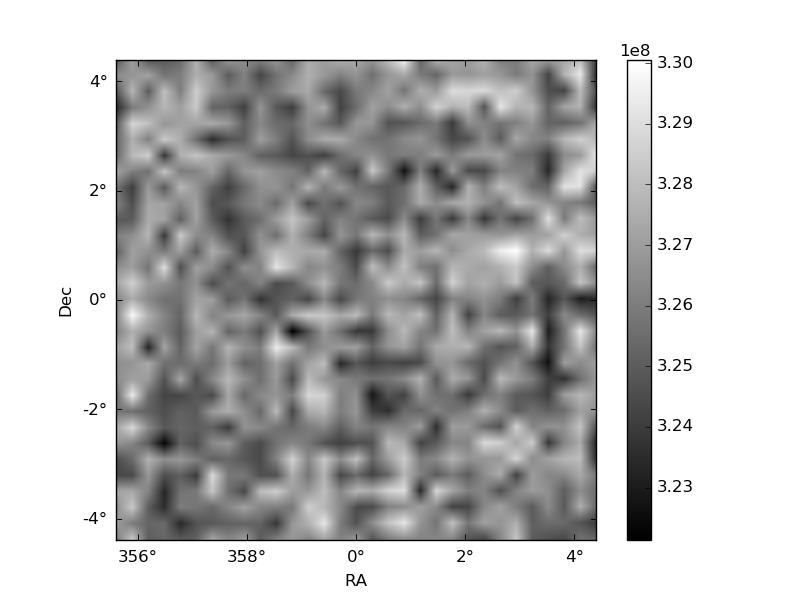
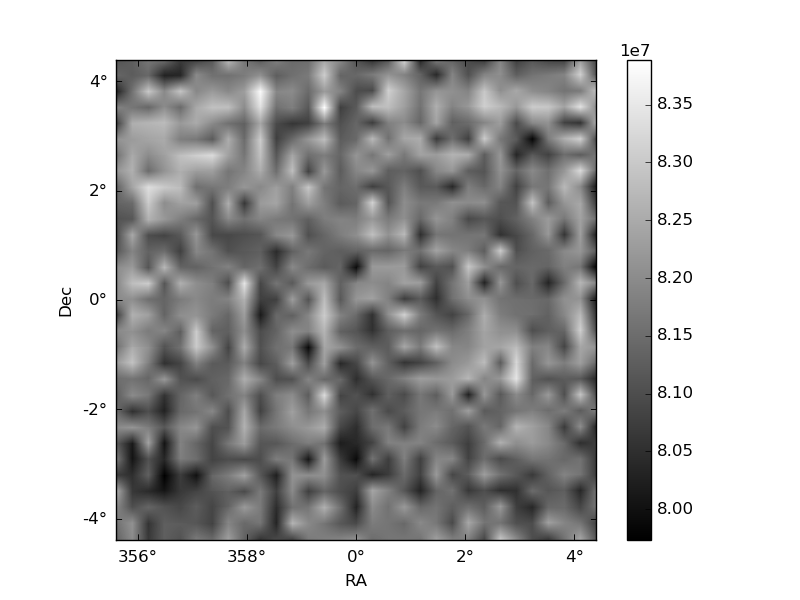
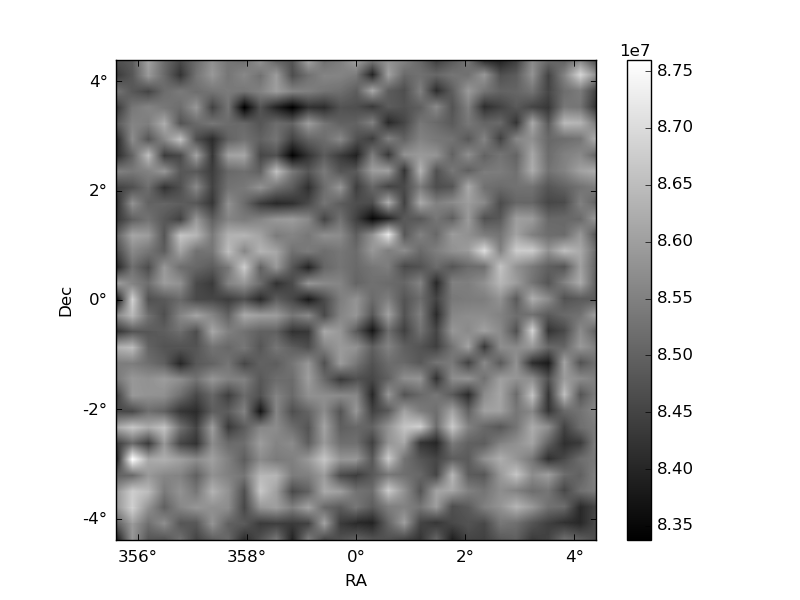
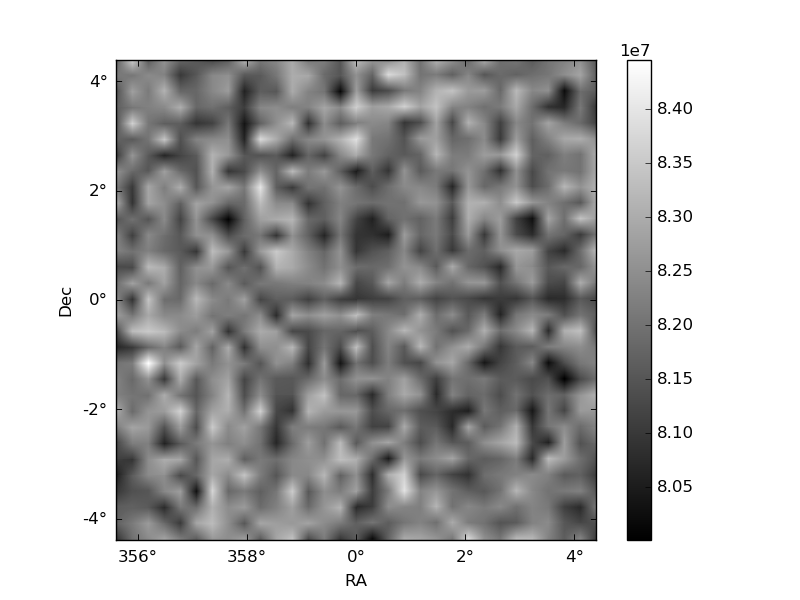
Histogram calculated using DETX and DETY for each event in the final _common_clean file
| Quadrant A | 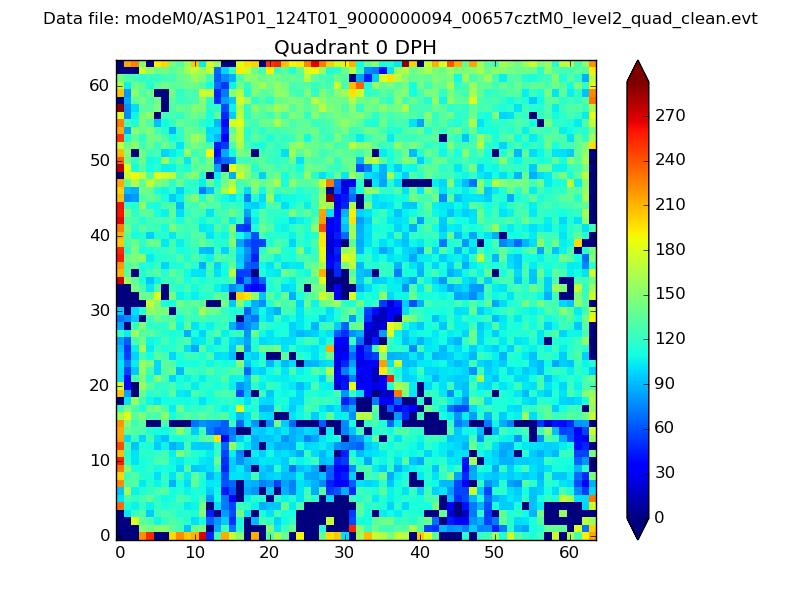 |
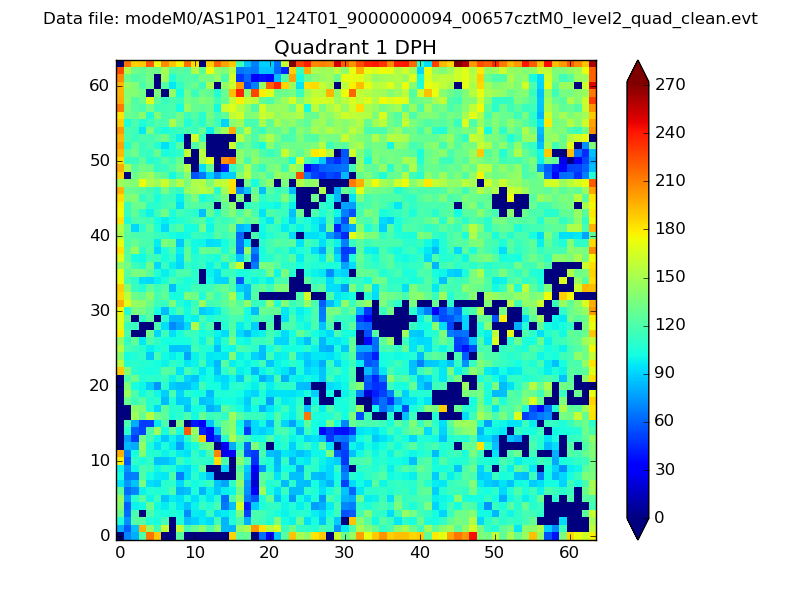 |
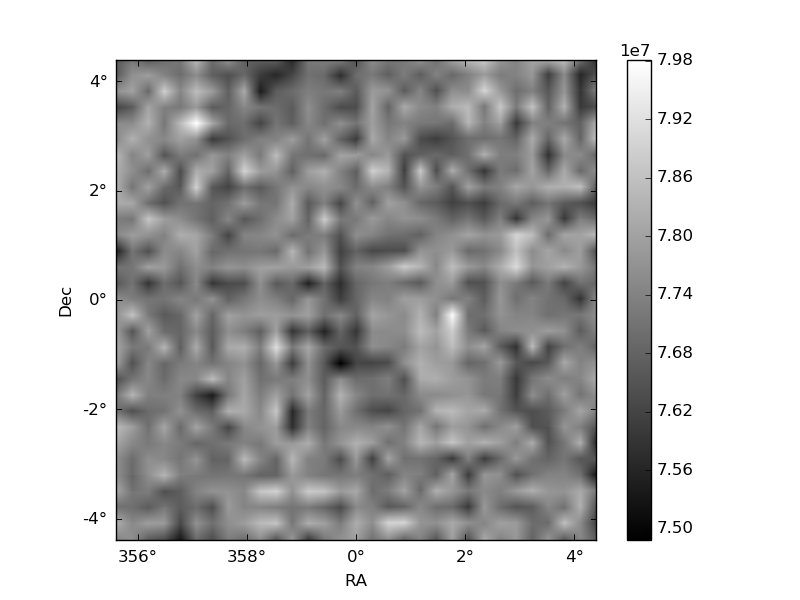
Quadrant B |
|---|---|---|---|
| Quadrant D | 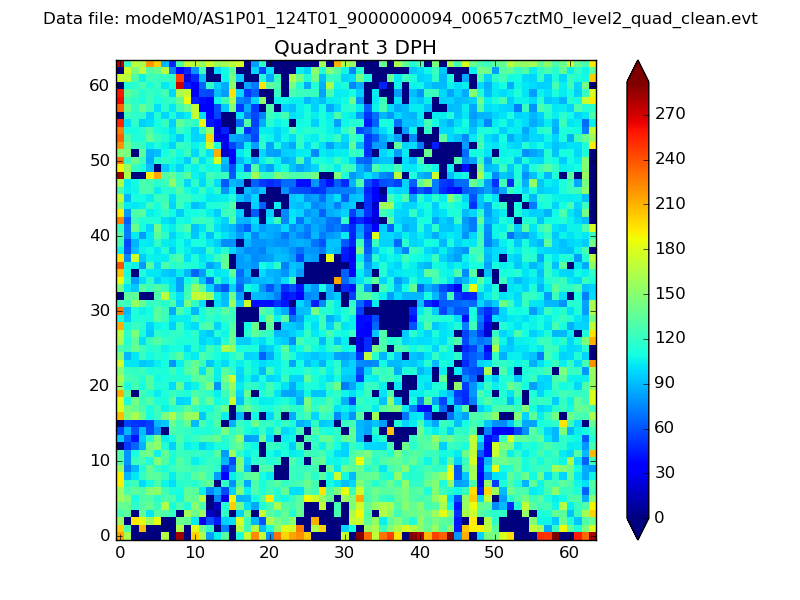 |
 |
Quadrant C |
| Plot type | Count rate plots | Images |
|---|---|---|
| Comparison with Poisson distribution Blue bars denote a histogram of data divided into 1 sec bins. Red curve is a Poisson curve with rate = median count rate of data. |
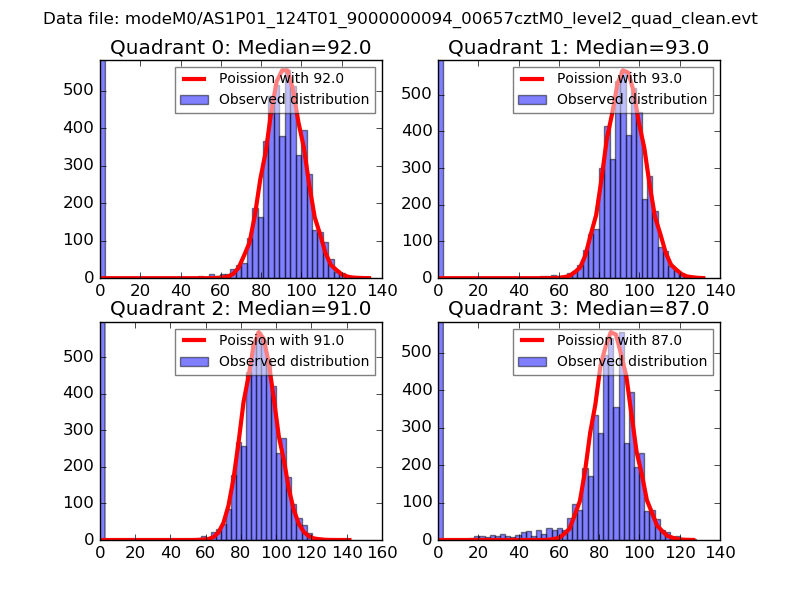 |
 |
| Quadrant-wise count rates Data is divided into 100 sec bins |
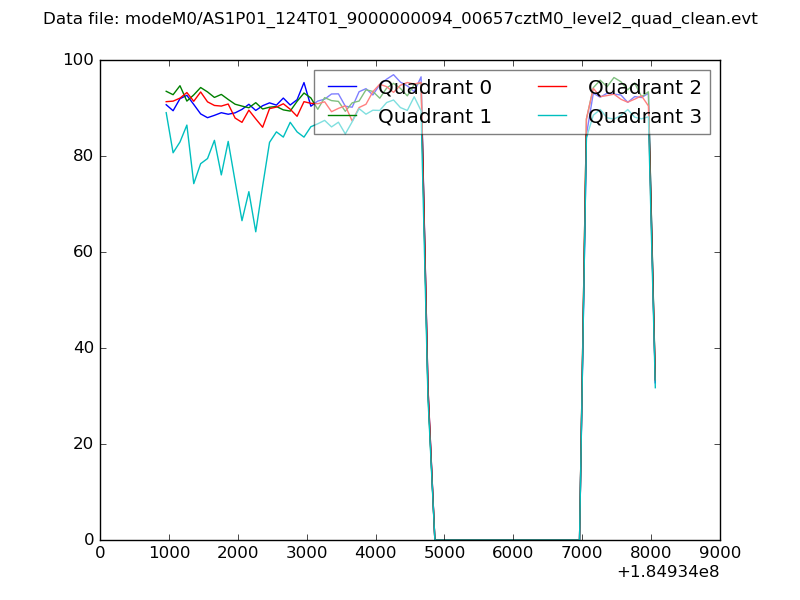 |
|
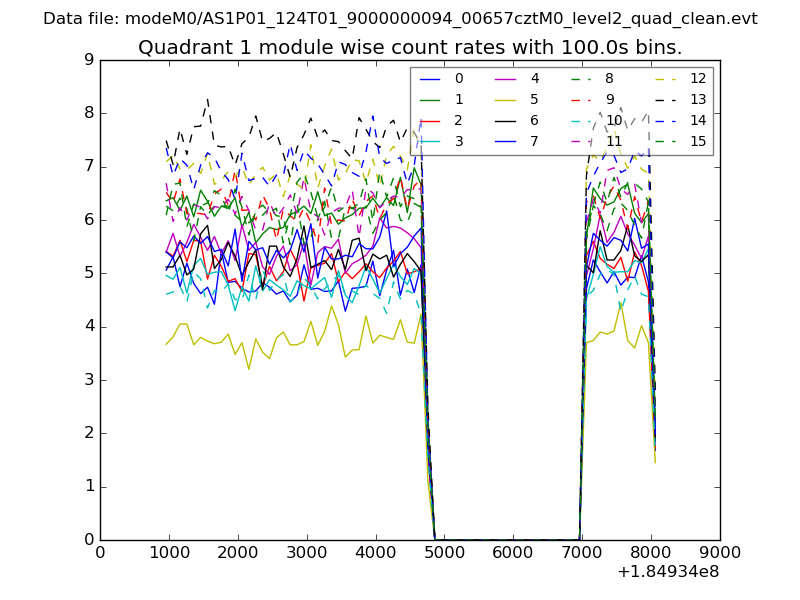
| Module-wise count rates for Quadrant A Data is divided into 100 sec bins |
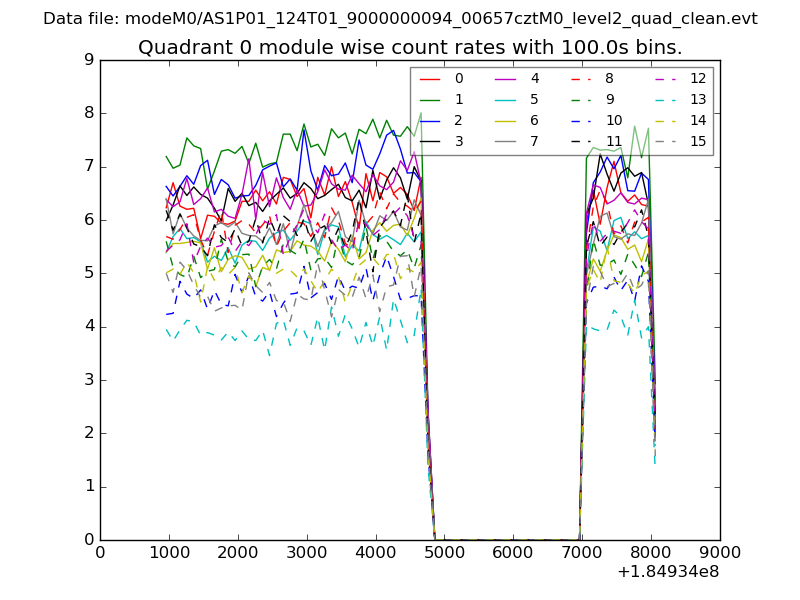 |
 |
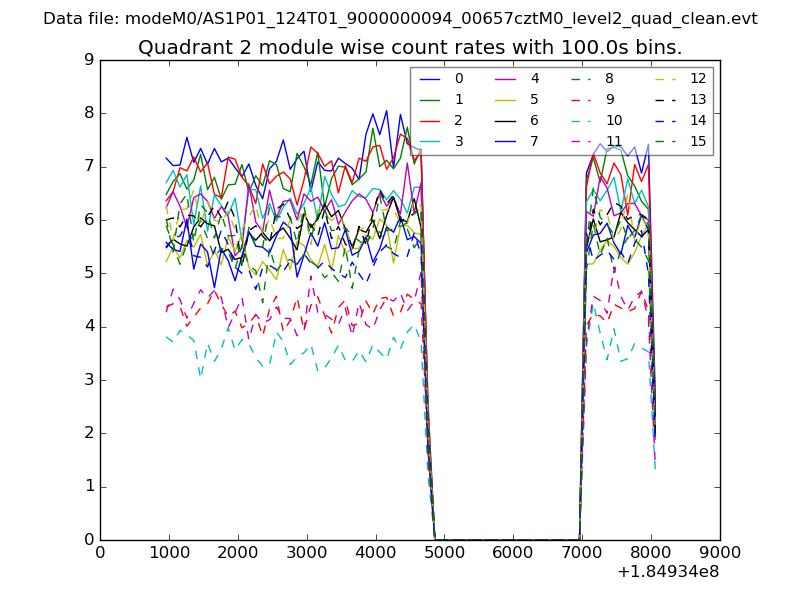
| Module-wise count rates for Quadrant B Data is divided into 100 sec bins |
 |
 |
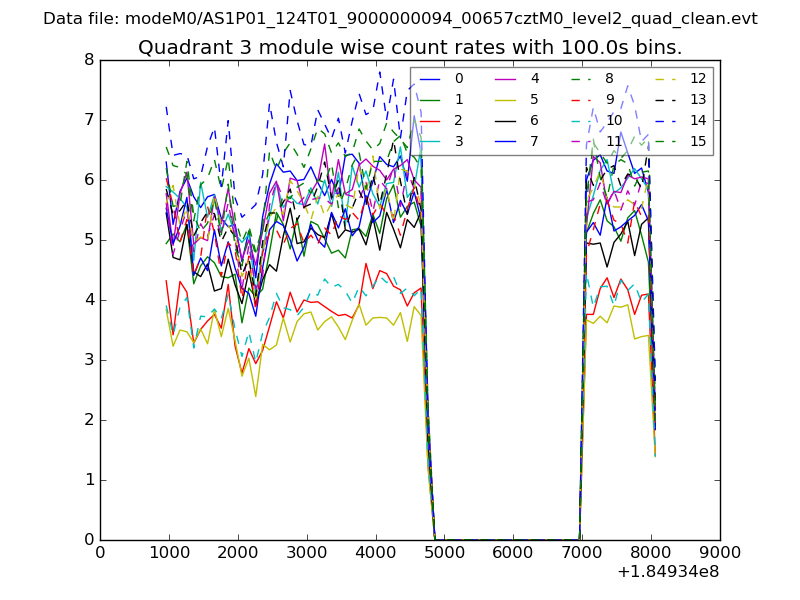
| Module-wise count rates for Quadrant C Data is divided into 100 sec bins |
 |
 |
| Module-wise count rates for Quadrant D Data is divided into 100 sec bins |
 |
 |
| Parameter | Plot |
|---|---|
| CZT HV Monitor | 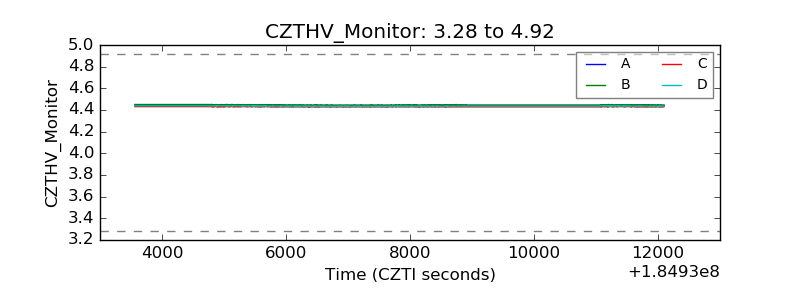 |
| D_VDD | 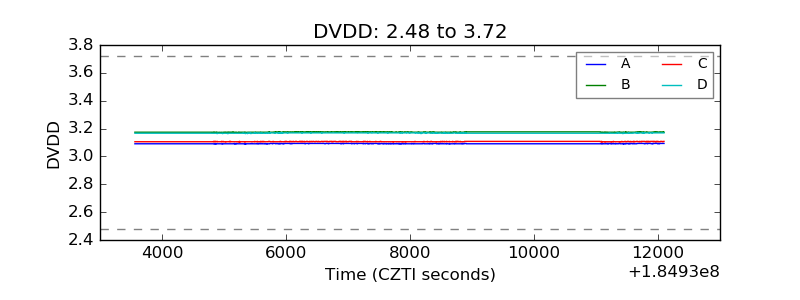 |
| Temperature 1 | 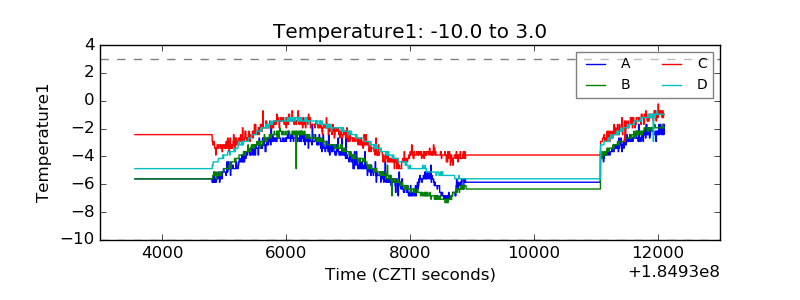 |
| Veto HV Monitor | 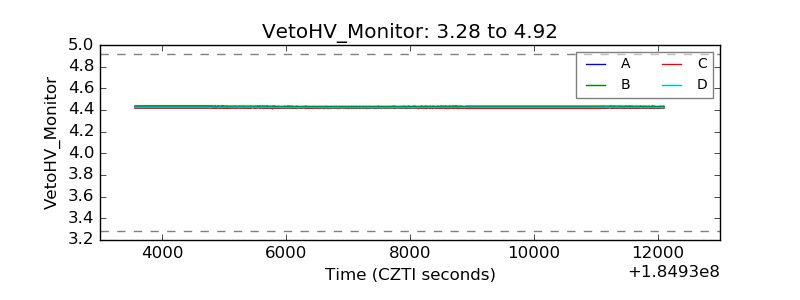 |
| Veto LLD | 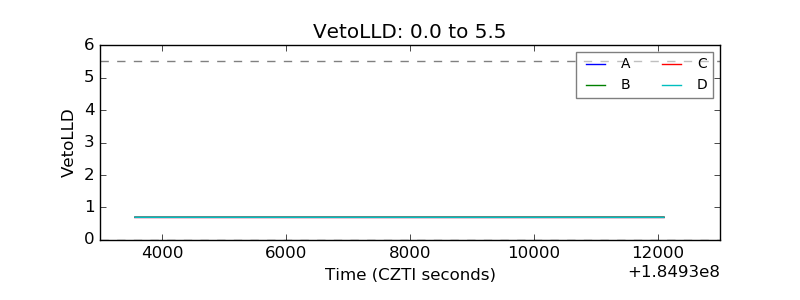 |
| Alpha Counter | 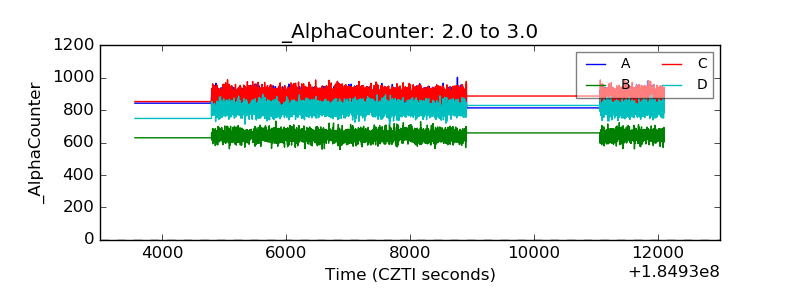 |
| _CPM_Rate | 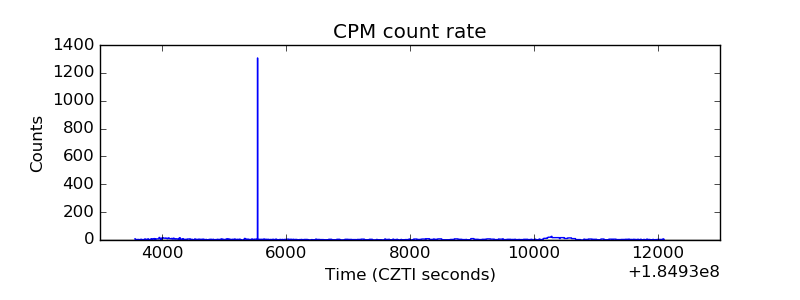 |
| CZT Counter | 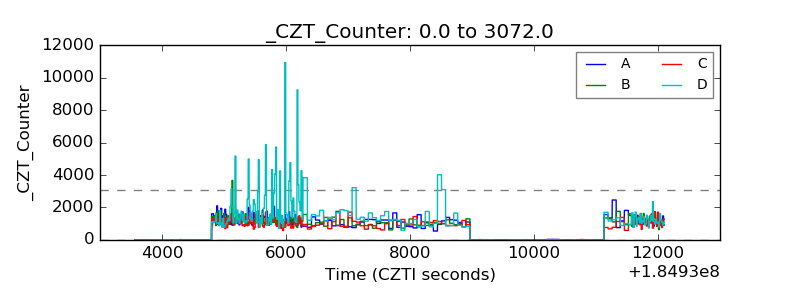 |
| +2.5 Volts monitor |  |
| +5 Volts monitor |  |
| _ROLL_ROT | 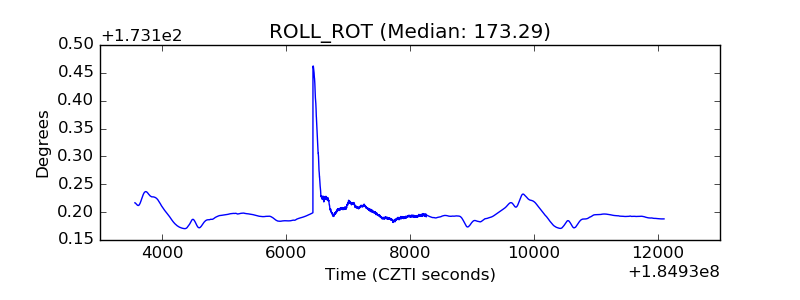 |
| _Roll_DEC | 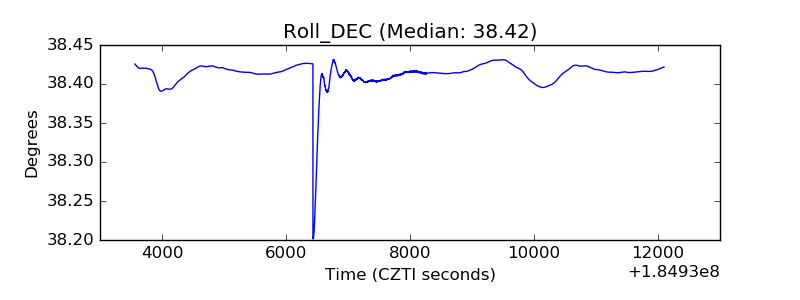 |
| _Roll_RA | 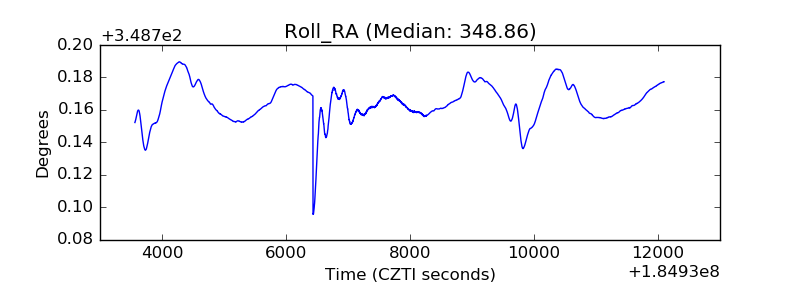 |
| Veto Counter | 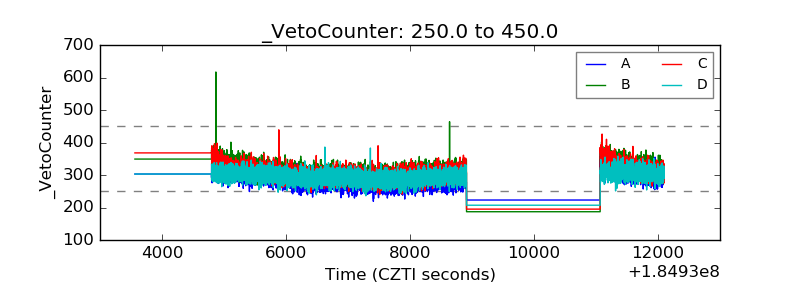 |