| Param | Original file | Final file |
|---|---|---|
| Filename | modeM0/AS1P01_124T01_9000000094_00660cztM0_level2.evt | modeM0/AS1P01_124T01_9000000094_00660cztM0_level2_quad_clean.evt |
| Size (bytes) | 802,601,280 | 54,155,520 |
| Size | 765.4 MB | 51.6 MB |
| Events in quadrant A | 5,958,866 | 329,269 |
| Events in quadrant B | 5,662,535 | 330,694 |
| Events in quadrant C | 5,575,333 | 326,138 |
| Events in quadrant D | 6,781,460 | 306,886 |
| Mode M9 | |||
|---|---|---|---|
| Quadrant | BADHDUFLAG | Total packets | Discarded packets |
| A | 0 | 22 | 0 |
| B | 0 | 22 | 0 |
| C | 0 | 22 | 0 |
| D | 0 | 22 | 0 |
| Mode M0 | |||
|---|---|---|---|
| Quadrant | BADHDUFLAG | Total packets | Discarded packets |
| A | 0 | 21207 | 1 |
| B | 0 | 20323 | 1 |
| C | 0 | 20070 | 1 |
| D | 0 | 23751 | 5 |
| Mode SS | |||
|---|---|---|---|
| Quadrant | BADHDUFLAG | Total packets | Discarded packets |
| A | 0 | 100 | 0 |
| B | 0 | 100 | 0 |
| C | 0 | 100 | 0 |
| D | 0 | 100 | 0 |
| Quadrant | Total seconds | Saturated seconds | Saturation percentage |
|---|---|---|---|
| A | 4942 | 37 | 0.748685% |
| B | 4942 | 2 | 0.040469% |
| C | 4942 | 51 | 1.031971% |
| D | 4942 | 342 | 6.920275% |
Noise dominated data is calculated using 1-second bins in cleaned event files. If a bin has >2000 counts, and if more than 50% of those come from <1% of pixels, then it is considered to be noise-dominated and hence unusable.
| Quadrant | # 1 sec bins | Bins with >0 counts | Bins with >2000 counts | High rate bins dominated by noise | Noise dominated (total time) | Noise dominated (detector-on time) | Marked lightcurve |
|---|---|---|---|---|---|---|---|
| A | 7098 | 4943 | 193 | 193 | 2.72% | 3.90% | 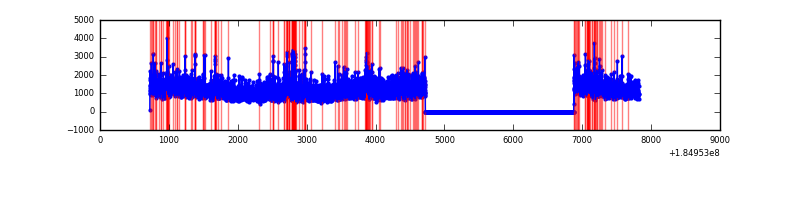 |
| B | 7098 | 4943 | 90 | 90 | 1.27% | 1.82% | 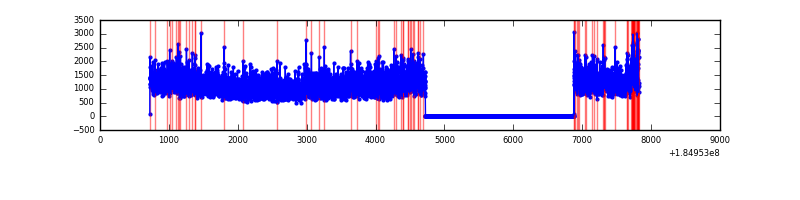 |
| C | 7098 | 4943 | 141 | 141 | 1.99% | 2.85% | 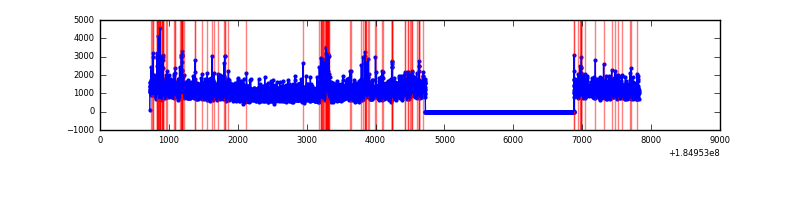 |
| D | 7098 | 4943 | 718 | 718 | 10.12% | 14.53% | 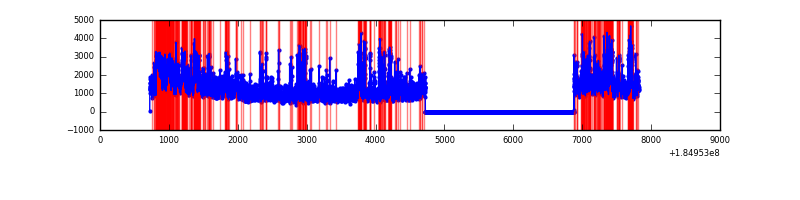 |
Top three noisy pixels from each quadrant. If the there are fewer than three noisy pixels in the level2.evt file, extra rows are filled as -1
| Pixel properties | Quadrant properties | ||||||
|---|---|---|---|---|---|---|---|
| Quadrant | DetID | PixID | Counts | Sigma | Mean | Median | Sigma |
| A | 15 | 171 | 280796 | 903.39 | 1413 | 1403 | 309.3 |
| A | 0 | 69 | 103213 | 329.19 | 1413 | 1403 | 309.3 |
| A | 13 | 147 | 44022 | 137.8 | 1413 | 1403 | 309.3 |
| B | 8 | 38 | 99704 | 291.9 | 1430 | 1435 | 336.7 |
| B | 4 | 172 | 22854 | 63.62 | 1430 | 1435 | 336.7 |
| B | 5 | 176 | 19709 | 54.28 | 1430 | 1435 | 336.7 |
| C | 9 | 52 | 355145 | 949.02 | 1324 | 1374 | 372.8 |
| C | 15 | 241 | 8318 | 18.63 | 1324 | 1374 | 372.8 |
| C | 9 | 83 | 6153 | 12.82 | 1324 | 1374 | 372.8 |
| D | 1 | 4 | 904146 | 2291.34 | 1247 | 1294 | 394.0 |
| D | 2 | 152 | 270979 | 684.43 | 1247 | 1294 | 394.0 |
| D | 13 | 221 | 251643 | 635.36 | 1247 | 1294 | 394.0 |
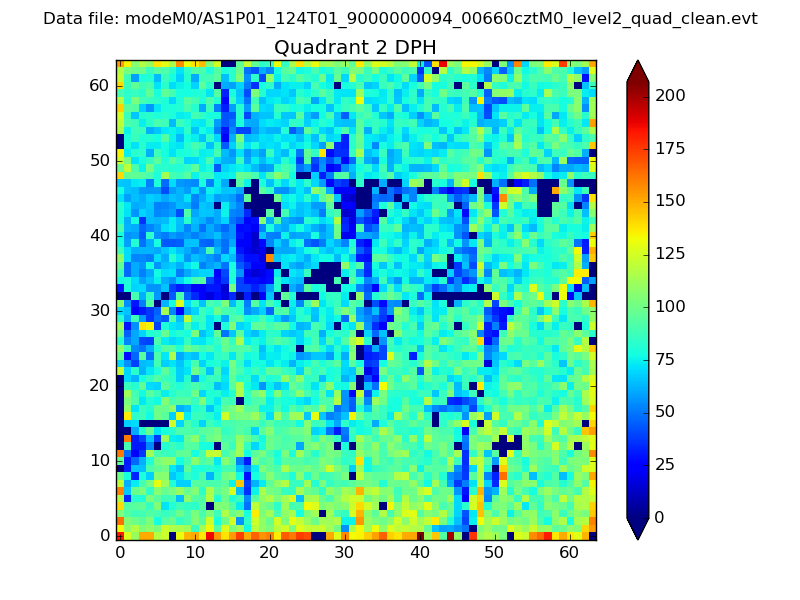
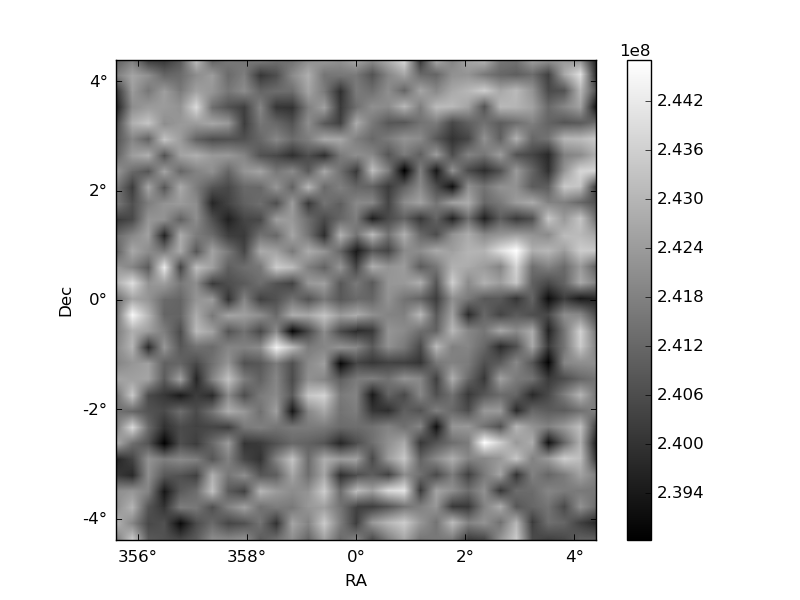
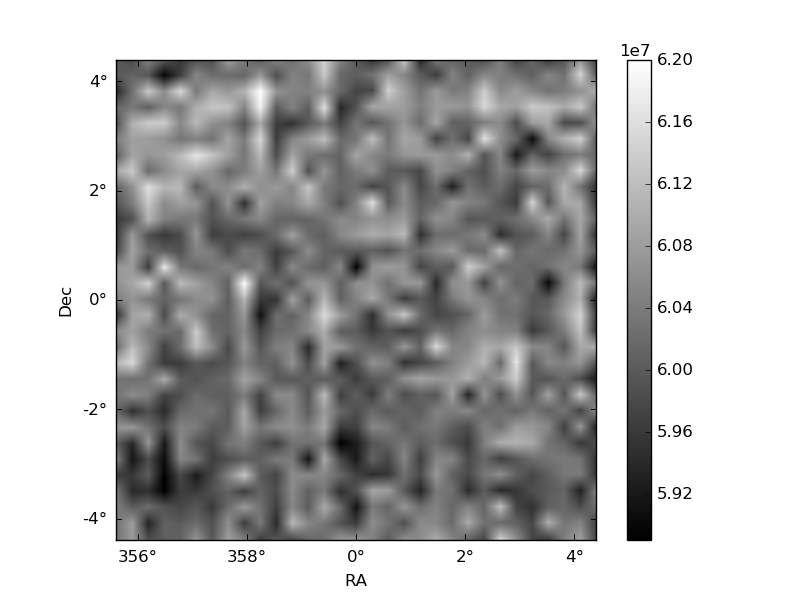
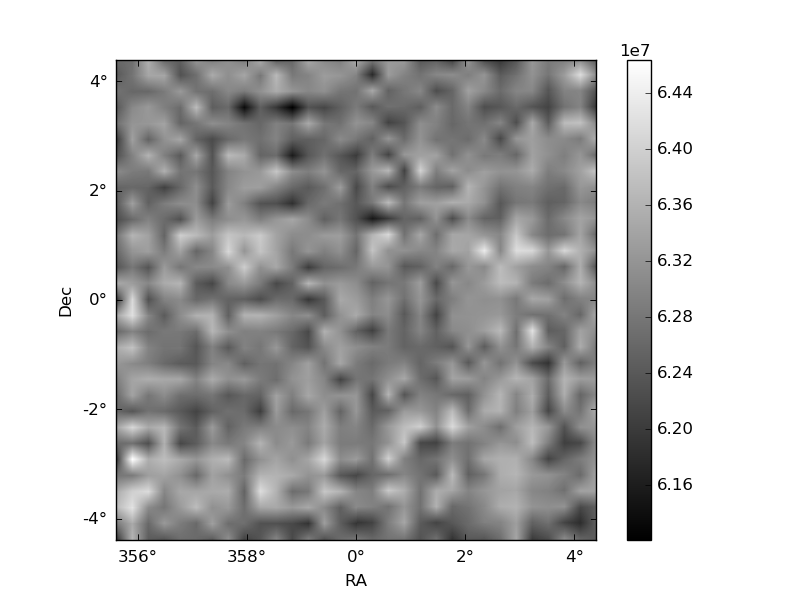
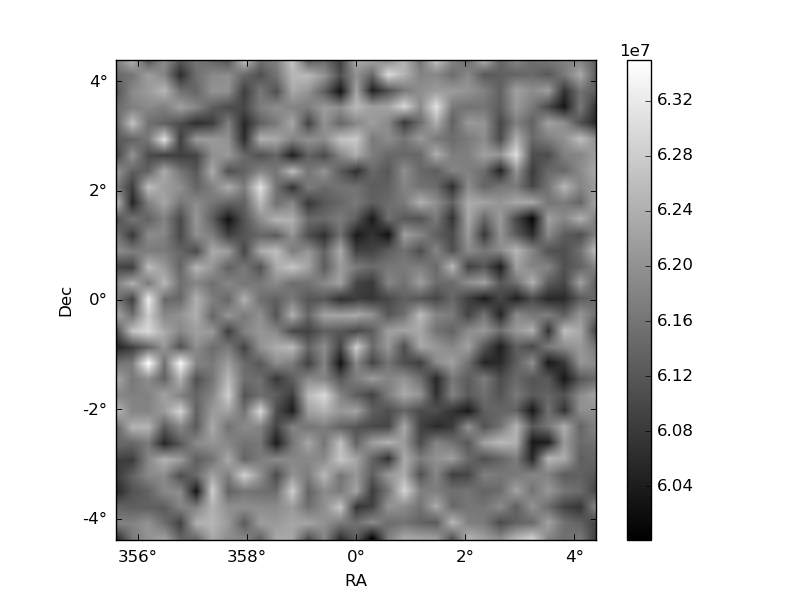
Histogram calculated using DETX and DETY for each event in the final _common_clean file
| Quadrant A | 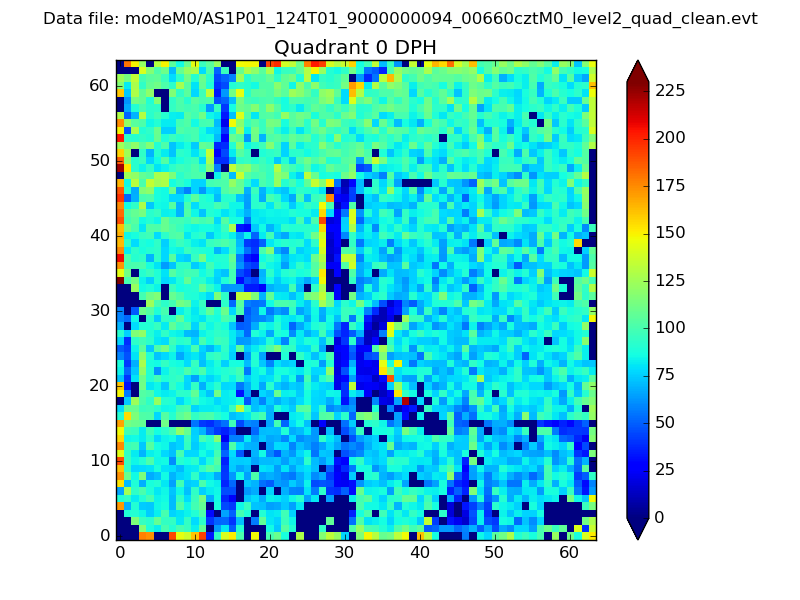 |
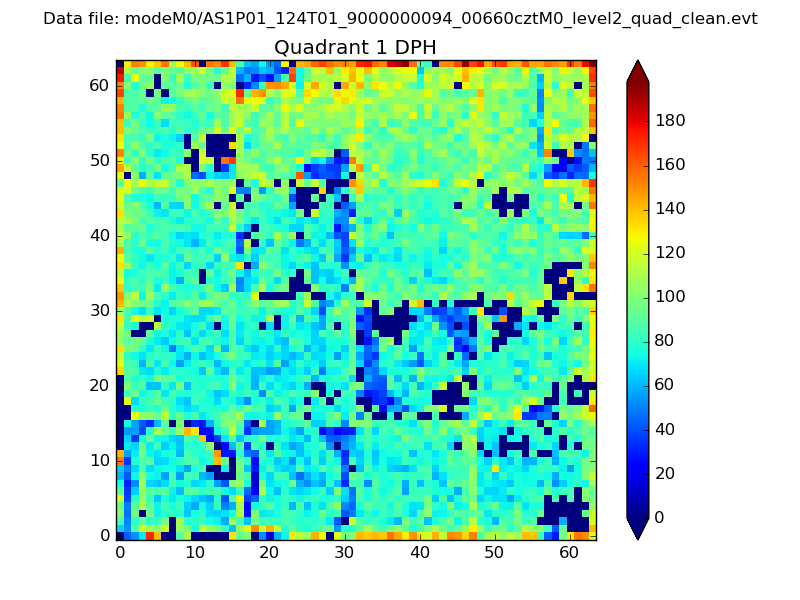 |
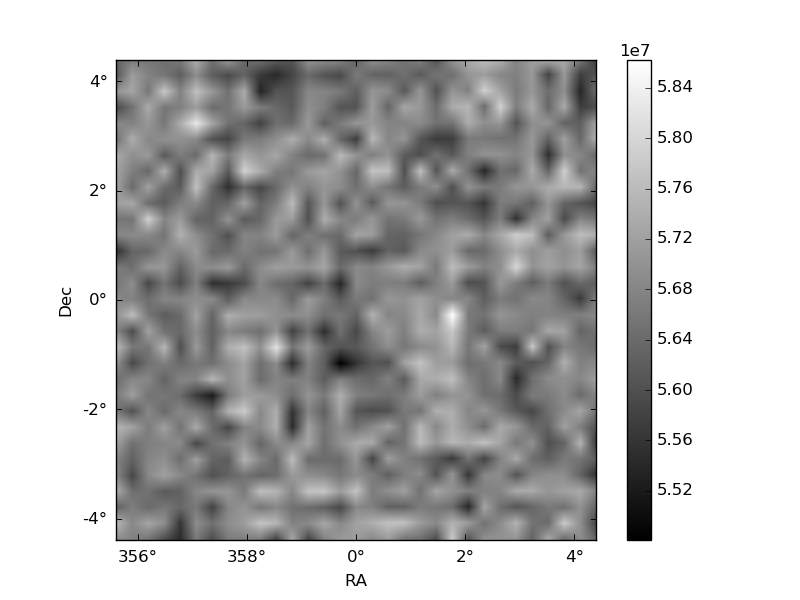
Quadrant B |
|---|---|---|---|
| Quadrant D | 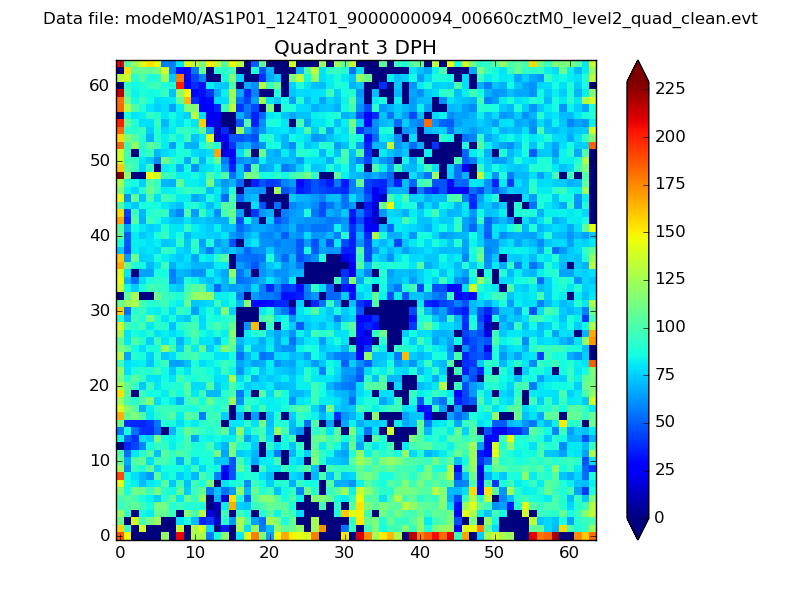 |
 |
Quadrant C |
| Plot type | Count rate plots | Images |
|---|---|---|
| Comparison with Poisson distribution Blue bars denote a histogram of data divided into 1 sec bins. Red curve is a Poisson curve with rate = median count rate of data. |
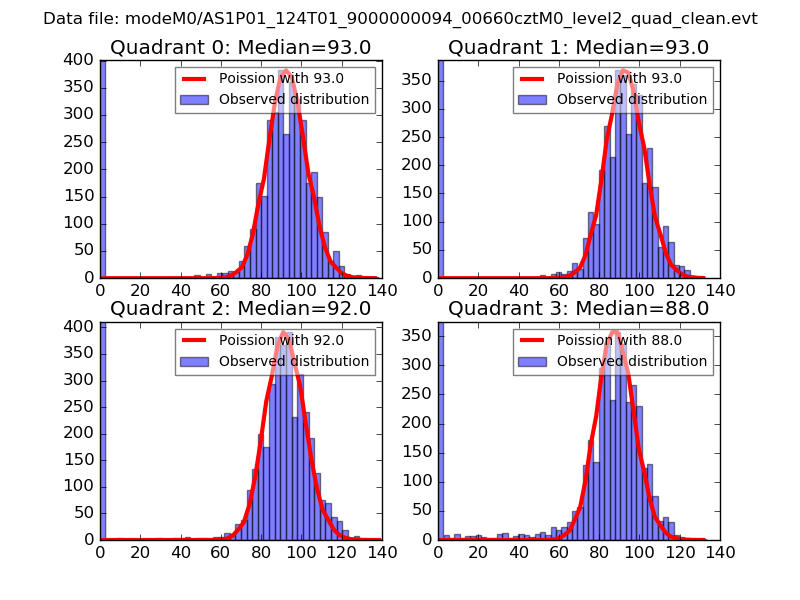 |
 |
| Quadrant-wise count rates Data is divided into 100 sec bins |
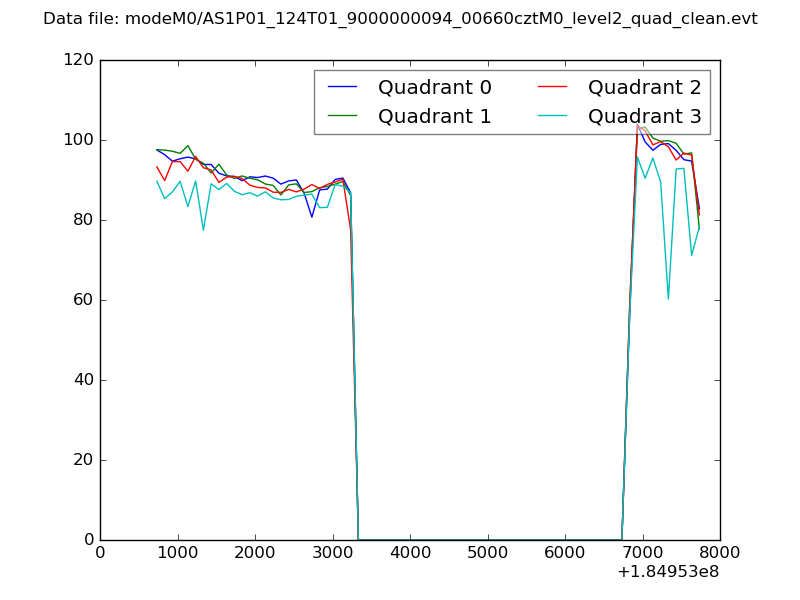 |
|
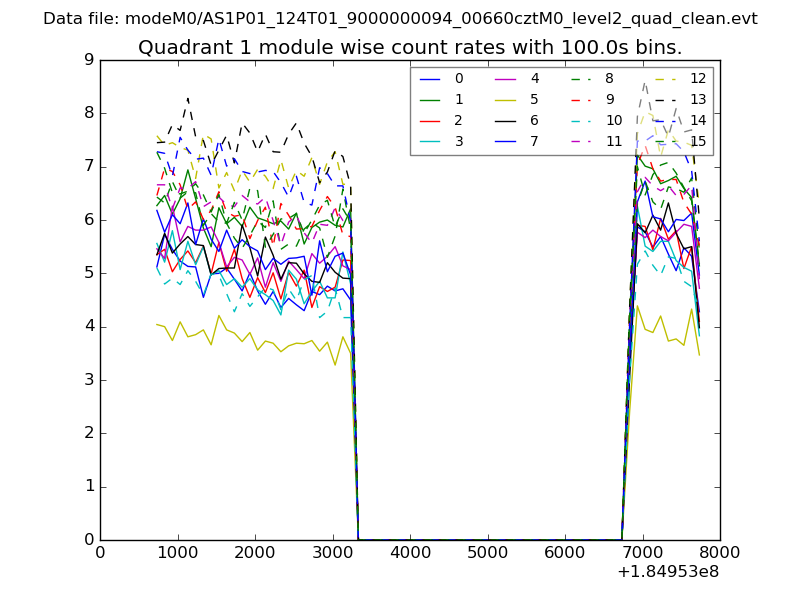
| Module-wise count rates for Quadrant A Data is divided into 100 sec bins |
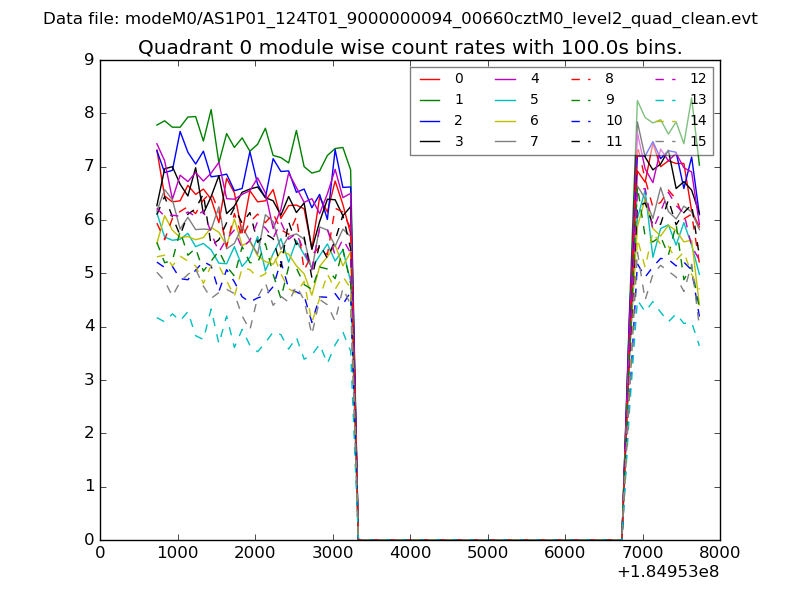 |
 |
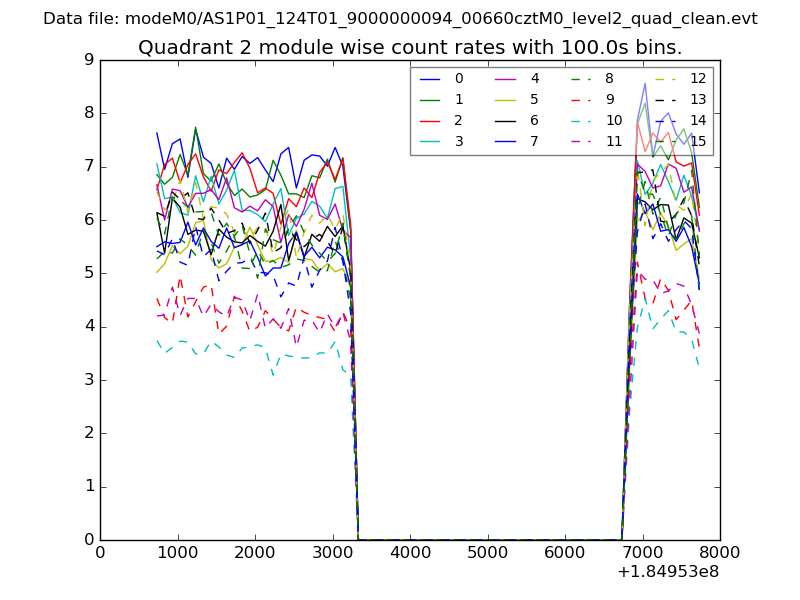
| Module-wise count rates for Quadrant B Data is divided into 100 sec bins |
 |
 |
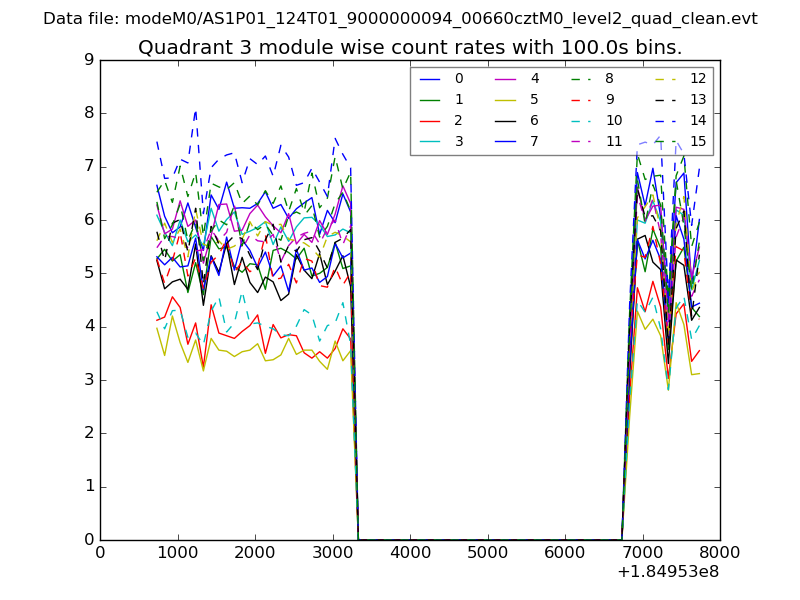
| Module-wise count rates for Quadrant C Data is divided into 100 sec bins |
 |
 |
| Module-wise count rates for Quadrant D Data is divided into 100 sec bins |
 |
 |
| Parameter | Plot |
|---|---|
| CZT HV Monitor | 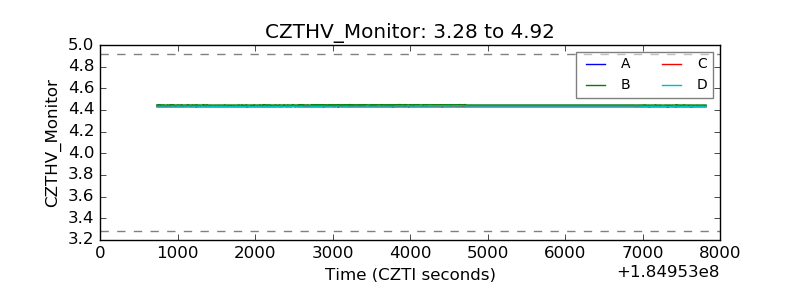 |
| D_VDD | 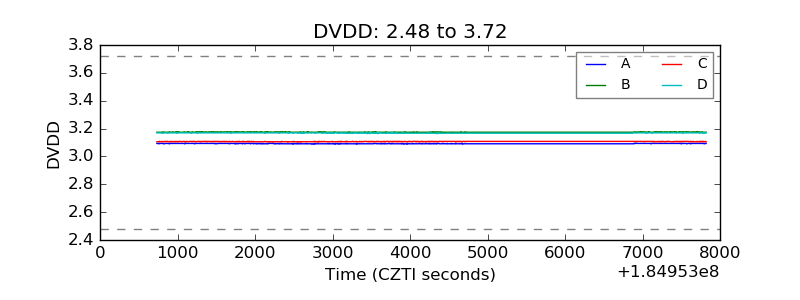 |
| Temperature 1 | 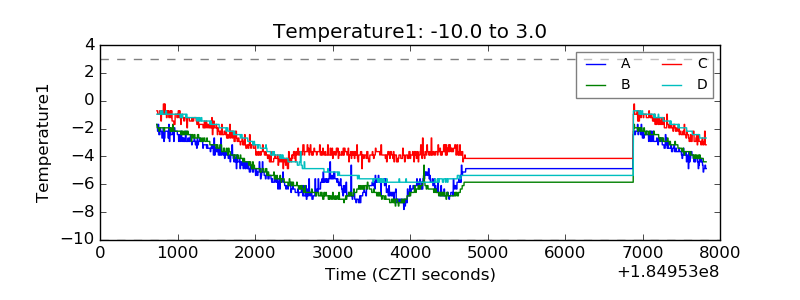 |
| Veto HV Monitor | 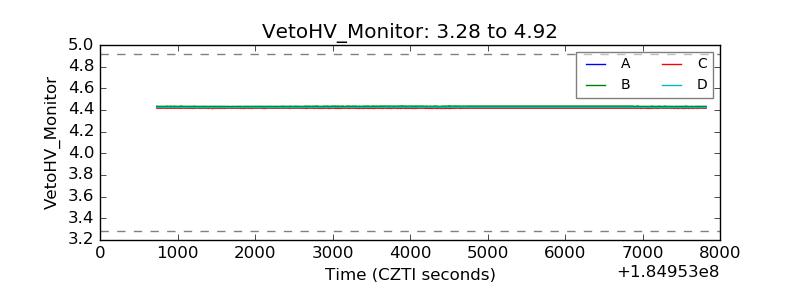 |
| Veto LLD | 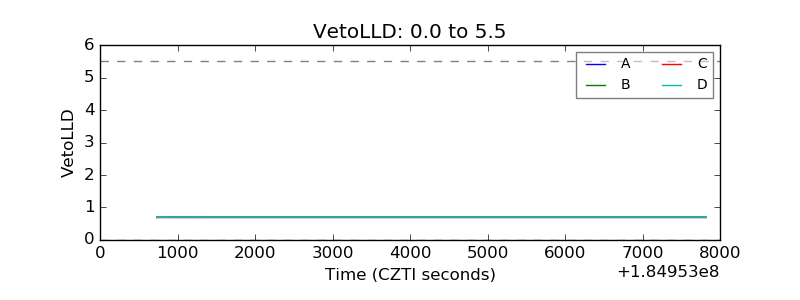 |
| Alpha Counter | 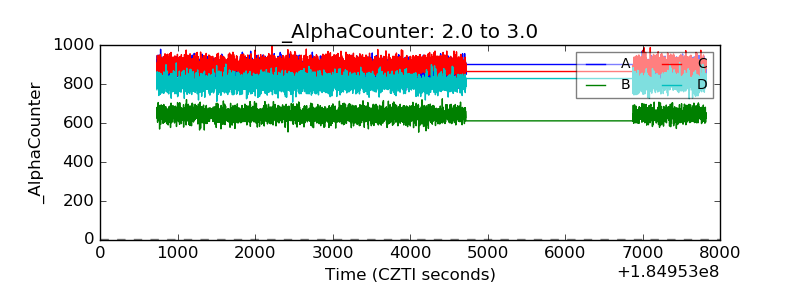 |
| _CPM_Rate | 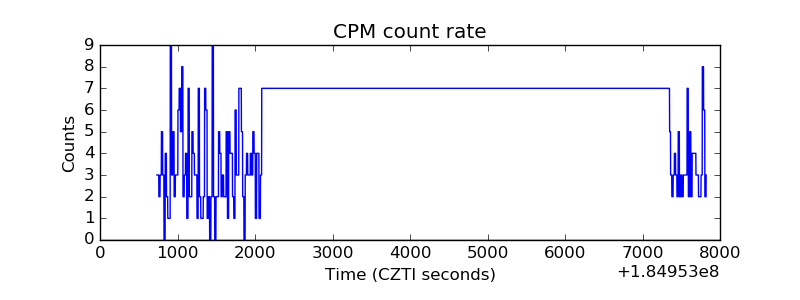 |
| CZT Counter | 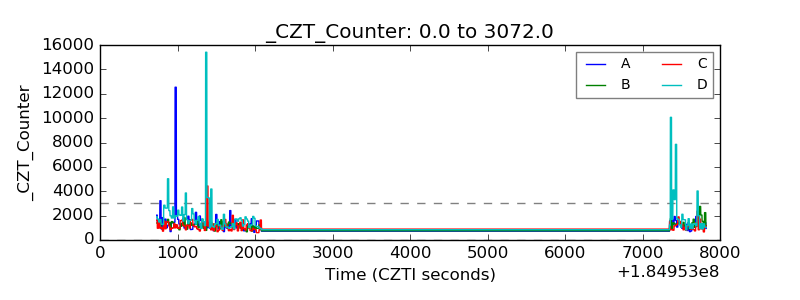 |
| +2.5 Volts monitor |  |
| +5 Volts monitor | 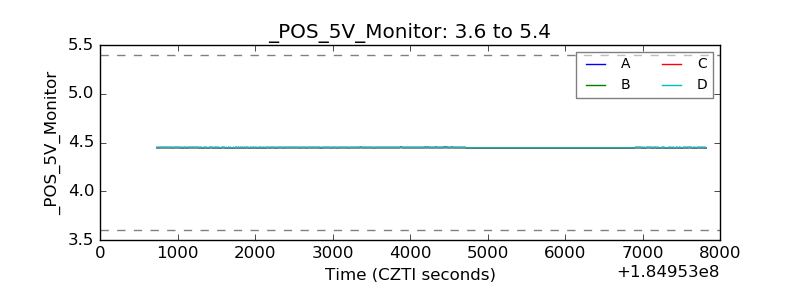 |
| _ROLL_ROT | 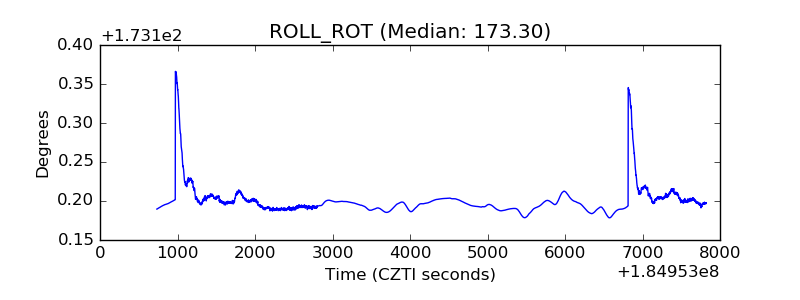 |
| _Roll_DEC | 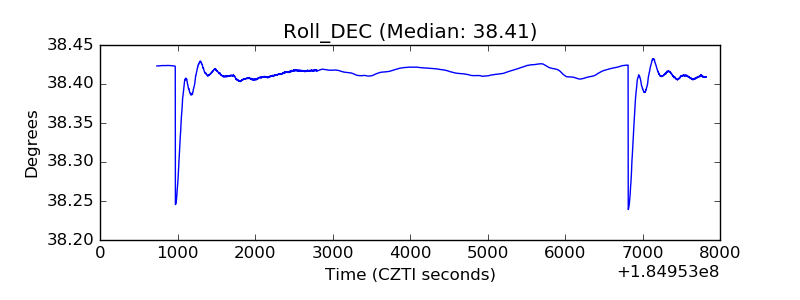 |
| _Roll_RA | 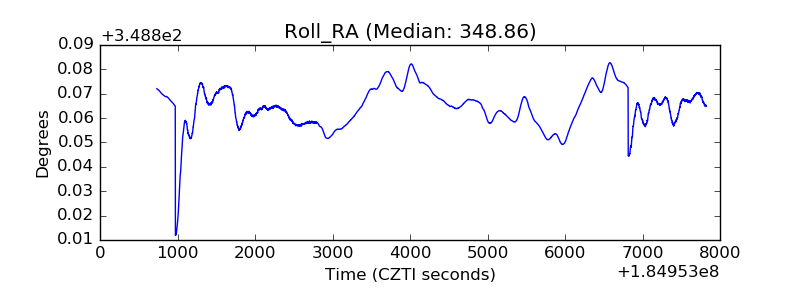 |
| Veto Counter | 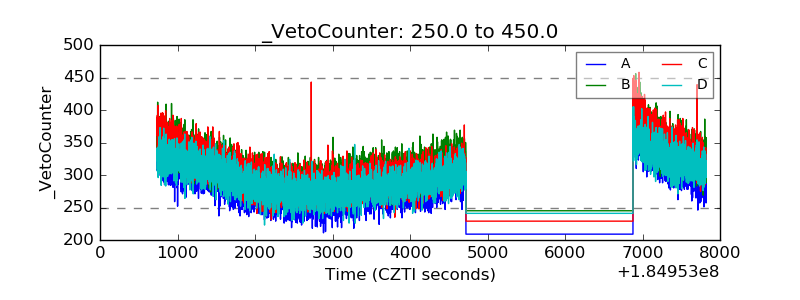 |