| Param | Original file | Final file |
|---|---|---|
| Filename | modeM0/AS1P01_124T01_9000000094_00664cztM0_level2.evt | modeM0/AS1P01_124T01_9000000094_00664cztM0_level2_quad_clean.evt |
| Size (bytes) | 781,689,600 | 50,973,120 |
| Size | 745.5 MB | 48.6 MB |
| Events in quadrant A | 6,210,274 | 298,296 |
| Events in quadrant B | 5,887,891 | 307,570 |
| Events in quadrant C | 5,322,790 | 302,356 |
| Events in quadrant D | 5,919,526 | 284,082 |
| Mode M9 | |||
|---|---|---|---|
| Quadrant | BADHDUFLAG | Total packets | Discarded packets |
| A | 0 | 33 | 0 |
| B | 0 | 34 | 0 |
| C | 0 | 34 | 0 |
| D | 0 | 34 | 0 |
| Mode M0 | |||
|---|---|---|---|
| Quadrant | BADHDUFLAG | Total packets | Discarded packets |
| A | 0 | 22020 | 2 |
| B | 0 | 21058 | 2 |
| C | 0 | 19357 | 2 |
| D | 0 | 21156 | 2 |
| Mode SS | |||
|---|---|---|---|
| Quadrant | BADHDUFLAG | Total packets | Discarded packets |
| A | 0 | 102 | 0 |
| B | 0 | 102 | 0 |
| C | 0 | 102 | 0 |
| D | 0 | 102 | 0 |
| Quadrant | Total seconds | Saturated seconds | Saturation percentage |
|---|---|---|---|
| A | 5001 | 67 | 1.339732% |
| B | 5001 | 27 | 0.539892% |
| C | 5001 | 5 | 0.099980% |
| D | 5001 | 145 | 2.899420% |
Noise dominated data is calculated using 1-second bins in cleaned event files. If a bin has >2000 counts, and if more than 50% of those come from <1% of pixels, then it is considered to be noise-dominated and hence unusable.
| Quadrant | # 1 sec bins | Bins with >0 counts | Bins with >2000 counts | High rate bins dominated by noise | Noise dominated (total time) | Noise dominated (detector-on time) | Marked lightcurve |
|---|---|---|---|---|---|---|---|
| A | 7157 | 5002 | 270 | 270 | 3.77% | 5.40% | 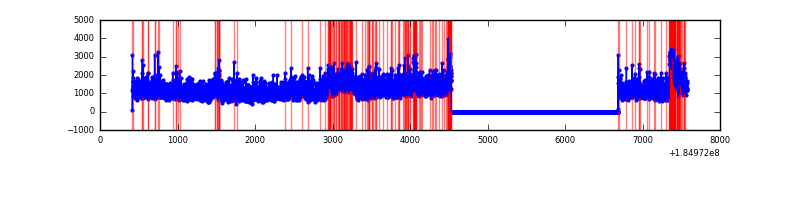 |
| B | 7157 | 5002 | 112 | 112 | 1.56% | 2.24% | 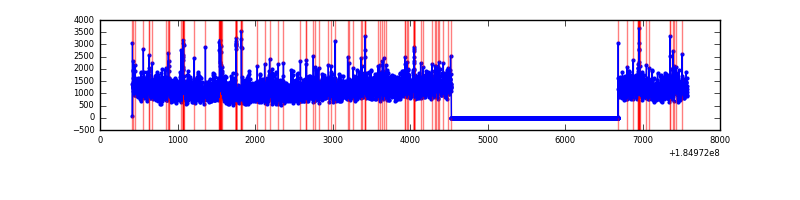 |
| C | 7157 | 5002 | 30 | 30 | 0.42% | 0.60% | 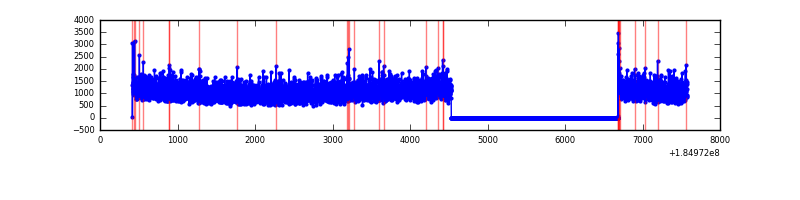 |
| D | 7157 | 5002 | 316 | 316 | 4.42% | 6.32% | 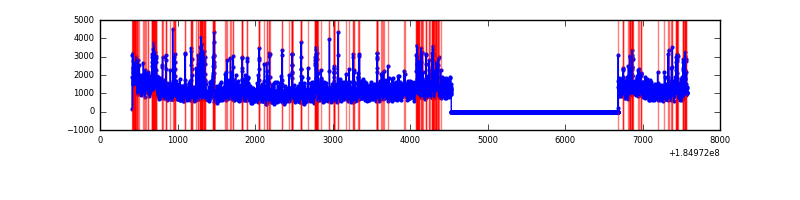 |
Top three noisy pixels from each quadrant. If the there are fewer than three noisy pixels in the level2.evt file, extra rows are filled as -1
| Pixel properties | Quadrant properties | ||||||
|---|---|---|---|---|---|---|---|
| Quadrant | DetID | PixID | Counts | Sigma | Mean | Median | Sigma |
| A | 12 | 133 | 468618 | 1487.59 | 1431 | 1416 | 314.1 |
| A | 12 | 236 | 108279 | 340.26 | 1431 | 1416 | 314.1 |
| A | 13 | 190 | 22959 | 68.59 | 1431 | 1416 | 314.1 |
| B | 4 | 172 | 115737 | 334.83 | 1471 | 1479 | 341.2 |
| B | 5 | 191 | 54853 | 156.41 | 1471 | 1479 | 341.2 |
| B | 4 | 82 | 16891 | 45.16 | 1471 | 1479 | 341.2 |
| C | 3 | 159 | 22668 | 56.36 | 1343 | 1393 | 377.5 |
| C | 15 | 241 | 12369 | 29.08 | 1343 | 1393 | 377.5 |
| C | 9 | 52 | 10302 | 23.6 | 1343 | 1393 | 377.5 |
| D | 1 | 4 | 588068 | 1487.56 | 1253 | 1296 | 394.5 |
| D | 13 | 216 | 157950 | 397.14 | 1253 | 1296 | 394.5 |
| D | 13 | 221 | 130527 | 327.62 | 1253 | 1296 | 394.5 |
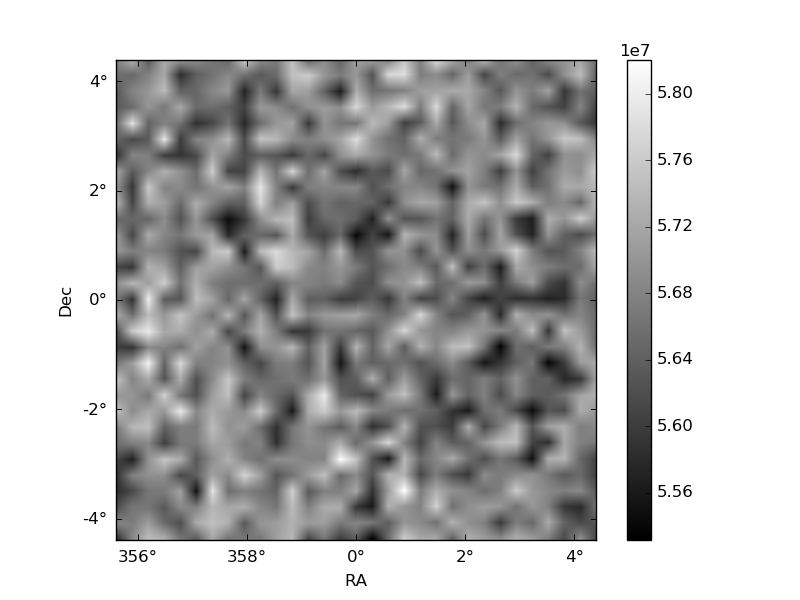
Histogram calculated using DETX and DETY for each event in the final _common_clean file
| Quadrant A | 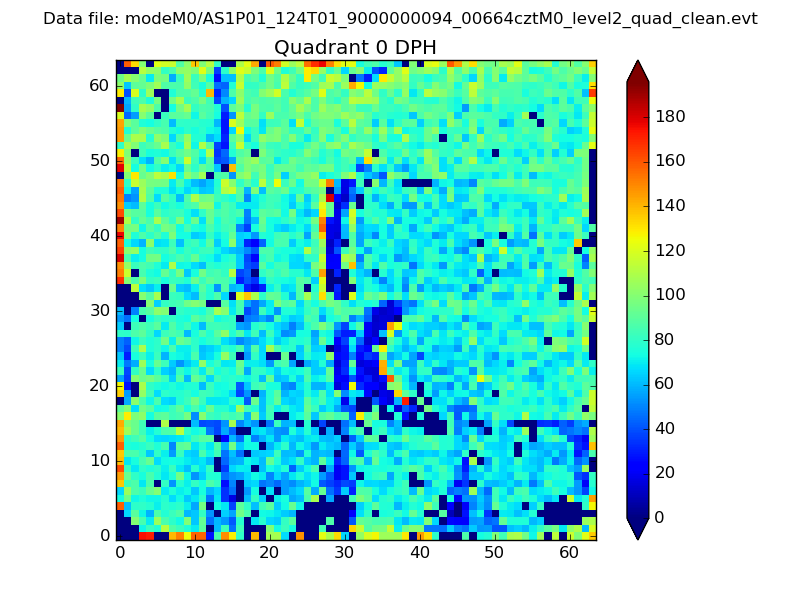 |
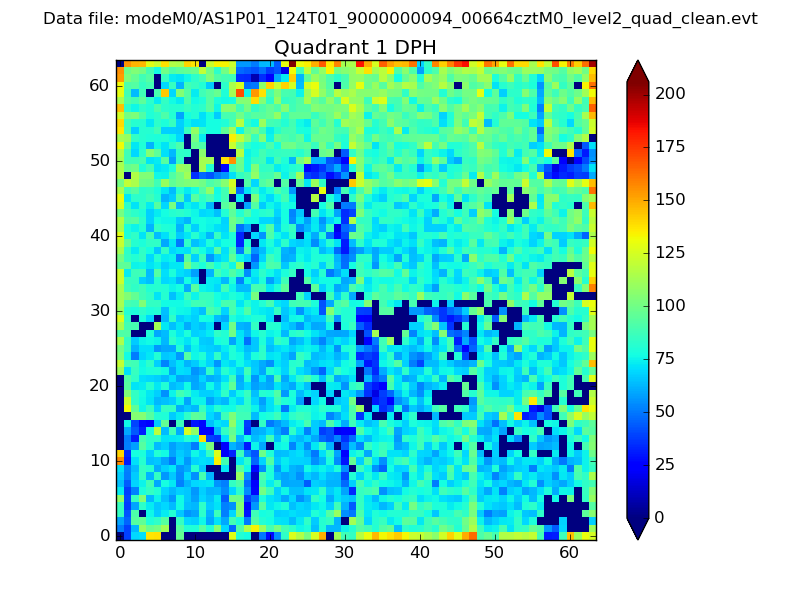 |
Quadrant B |
|---|---|---|---|
| Quadrant D | 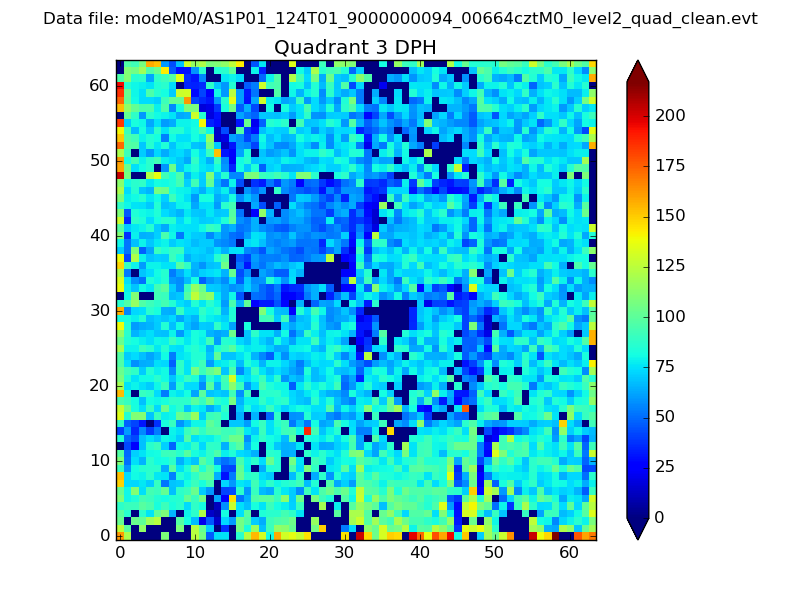 |
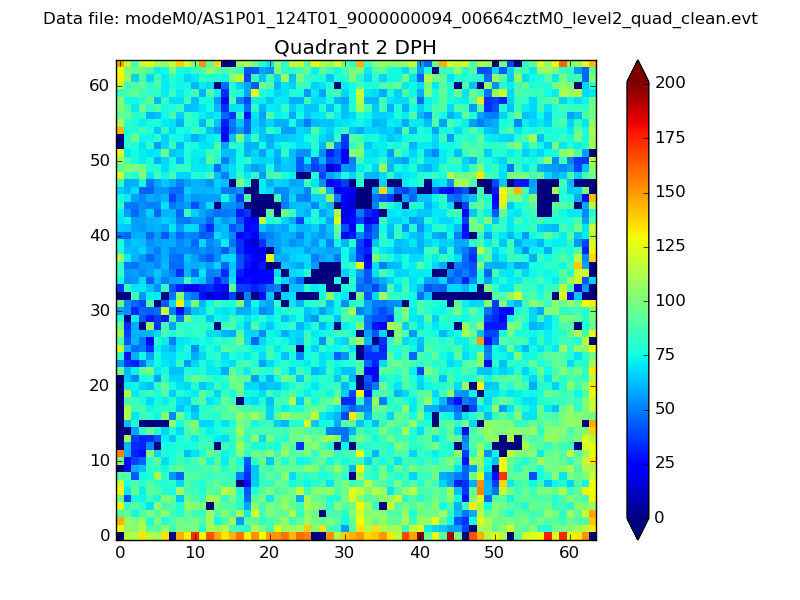 |
Quadrant C |
| Plot type | Count rate plots | Images |
|---|---|---|
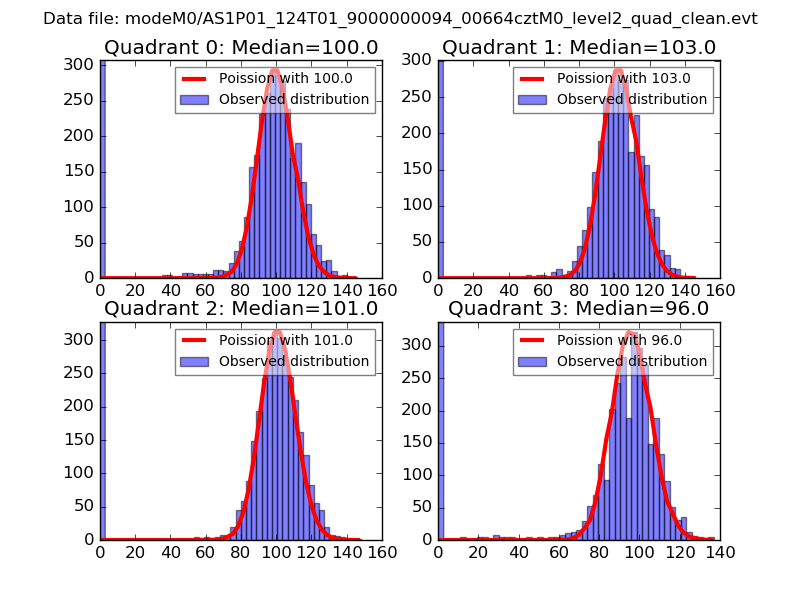
| Comparison with Poisson distribution Blue bars denote a histogram of data divided into 1 sec bins. Red curve is a Poisson curve with rate = median count rate of data. |
 |
 |
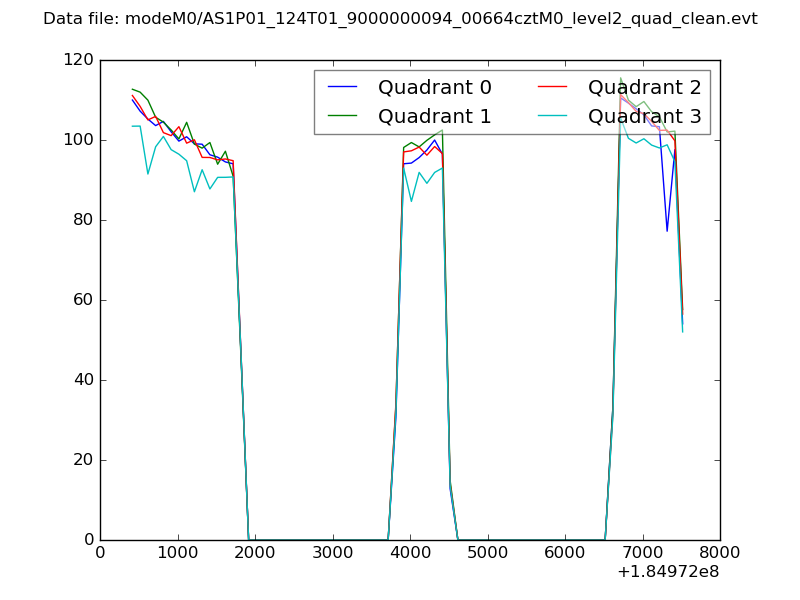
| Quadrant-wise count rates Data is divided into 100 sec bins |
 |
|
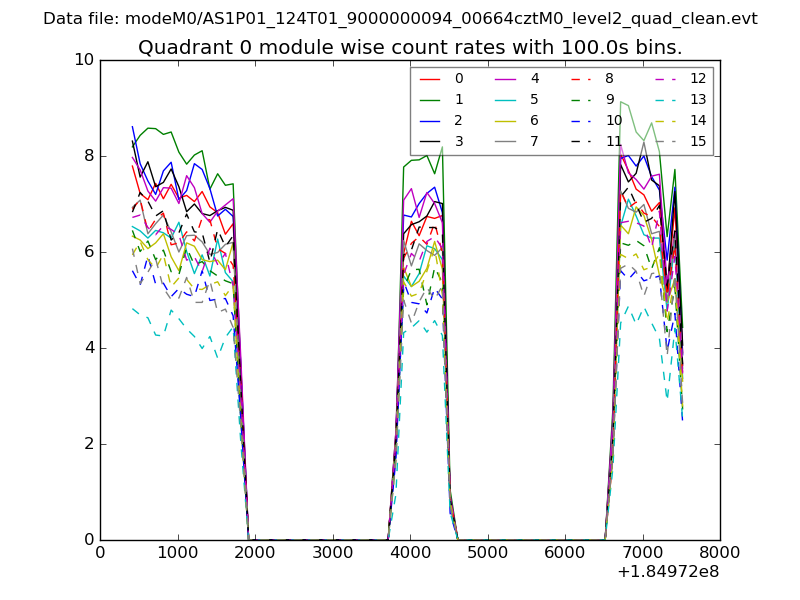
| Module-wise count rates for Quadrant A Data is divided into 100 sec bins |
 |
 |
| Module-wise count rates for Quadrant B Data is divided into 100 sec bins |
 |
 |
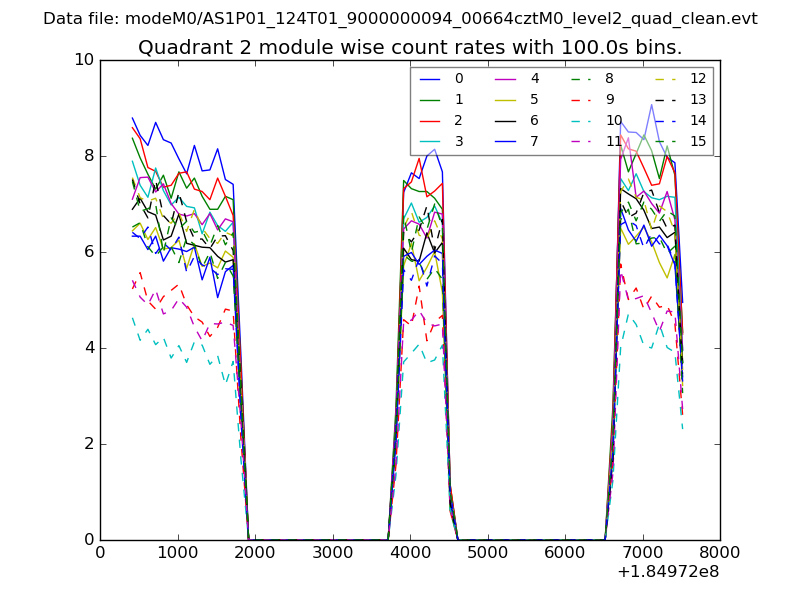
| Module-wise count rates for Quadrant C Data is divided into 100 sec bins |
 |
 |
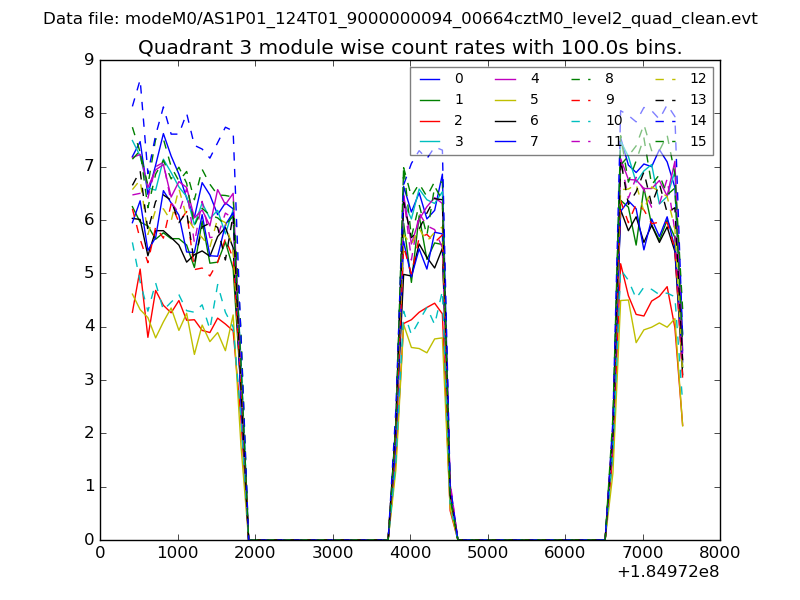
| Module-wise count rates for Quadrant D Data is divided into 100 sec bins |
 |
 |
| Parameter | Plot |
|---|---|
| CZT HV Monitor | 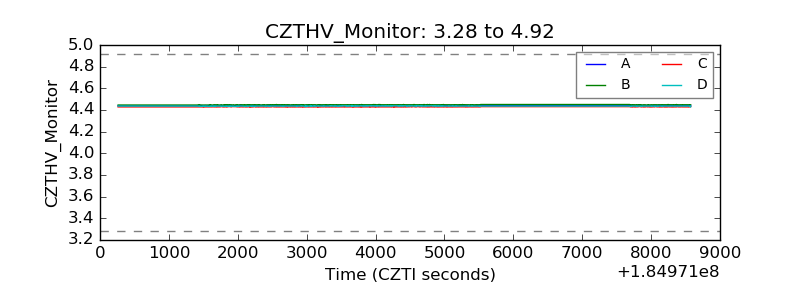 |
| D_VDD | 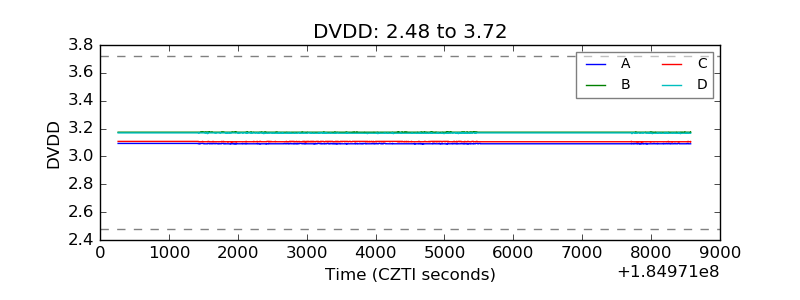 |
| Temperature 1 | 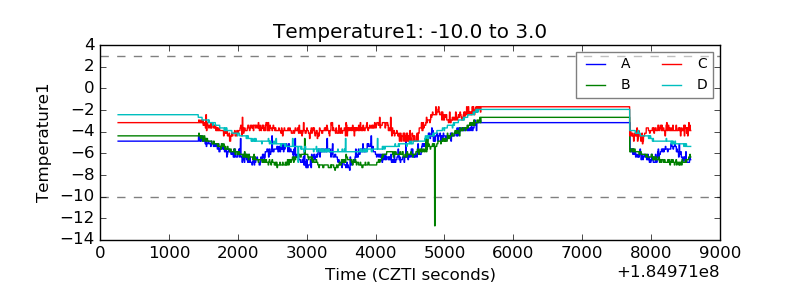 |
| Veto HV Monitor | 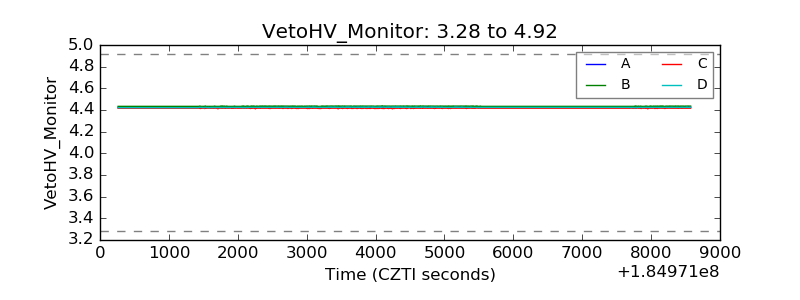 |
| Veto LLD |  |
| Alpha Counter | 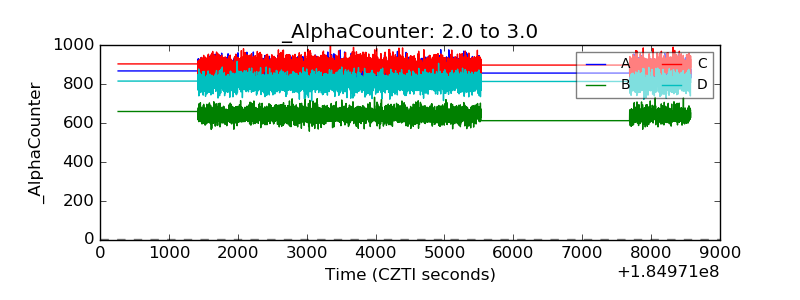 |
| _CPM_Rate | 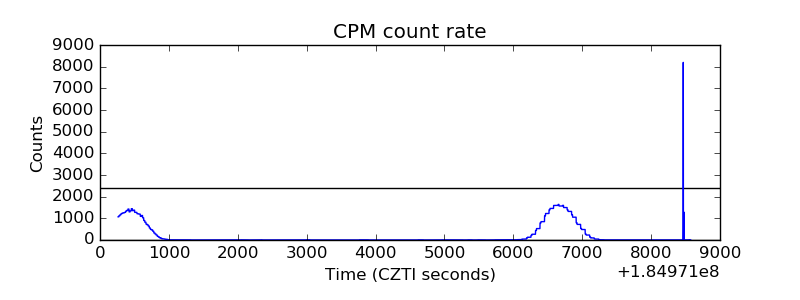 |
| CZT Counter | 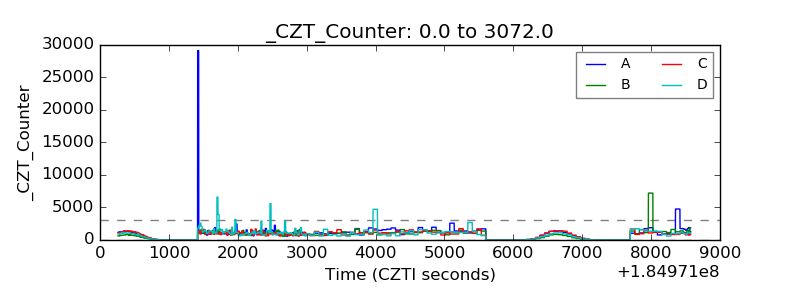 |
| +2.5 Volts monitor |  |
| +5 Volts monitor |  |
| _ROLL_ROT | 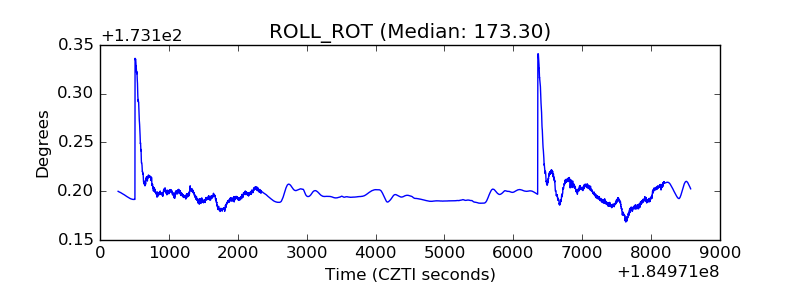 |
| _Roll_DEC | 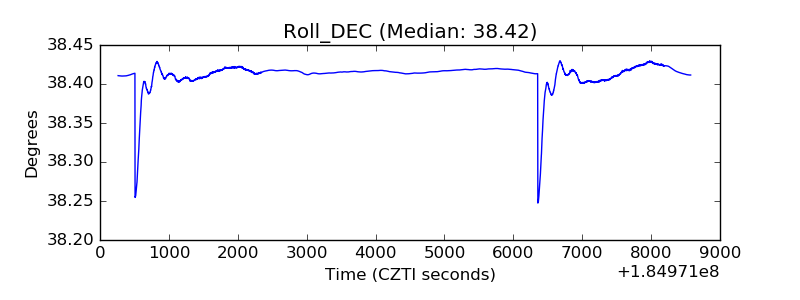 |
| _Roll_RA | 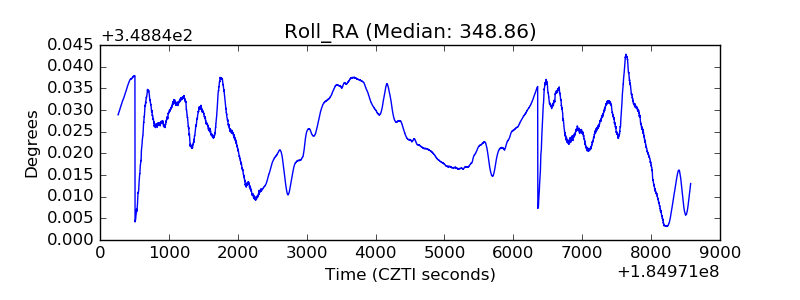 |
| Veto Counter | 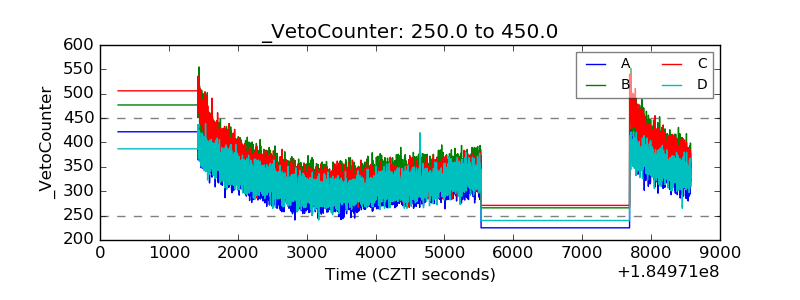 |