| Param | Original file | Final file |
|---|---|---|
| Filename | modeM0/AS1P01_124T01_9000000094_00665cztM0_level2.evt | modeM0/AS1P01_124T01_9000000094_00665cztM0_level2_quad_clean.evt |
| Size (bytes) | 780,727,680 | 47,491,200 |
| Size | 744.6 MB | 45.3 MB |
| Events in quadrant A | 6,006,183 | 273,143 |
| Events in quadrant B | 6,013,006 | 281,668 |
| Events in quadrant C | 5,277,086 | 276,808 |
| Events in quadrant D | 6,018,766 | 258,941 |
| Mode M9 | |||
|---|---|---|---|
| Quadrant | BADHDUFLAG | Total packets | Discarded packets |
| A | 0 | 41 | 0 |
| B | 0 | 41 | 0 |
| C | 0 | 41 | 0 |
| D | 0 | 41 | 0 |
| Mode M0 | |||
|---|---|---|---|
| Quadrant | BADHDUFLAG | Total packets | Discarded packets |
| A | 0 | 21374 | 6 |
| B | 0 | 21388 | 2 |
| C | 0 | 19195 | 2 |
| D | 0 | 21411 | 2 |
| Mode SS | |||
|---|---|---|---|
| Quadrant | BADHDUFLAG | Total packets | Discarded packets |
| A | 0 | 100 | 0 |
| B | 0 | 100 | 0 |
| C | 0 | 100 | 0 |
| D | 0 | 100 | 0 |
| Quadrant | Total seconds | Saturated seconds | Saturation percentage |
|---|---|---|---|
| A | 4950 | 56 | 1.131313% |
| B | 4950 | 20 | 0.404040% |
| C | 4950 | 4 | 0.080808% |
| D | 4950 | 155 | 3.131313% |
Noise dominated data is calculated using 1-second bins in cleaned event files. If a bin has >2000 counts, and if more than 50% of those come from <1% of pixels, then it is considered to be noise-dominated and hence unusable.
| Quadrant | # 1 sec bins | Bins with >0 counts | Bins with >2000 counts | High rate bins dominated by noise | Noise dominated (total time) | Noise dominated (detector-on time) | Marked lightcurve |
|---|---|---|---|---|---|---|---|
| A | 7106 | 4951 | 187 | 187 | 2.63% | 3.78% | 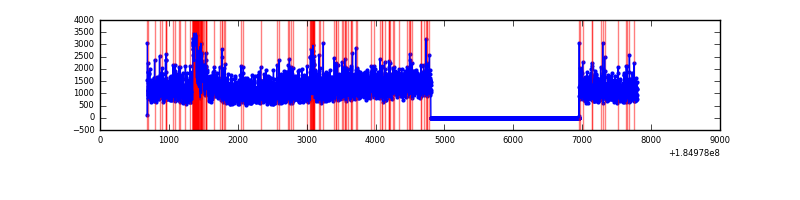 |
| B | 7106 | 4951 | 130 | 130 | 1.83% | 2.63% | 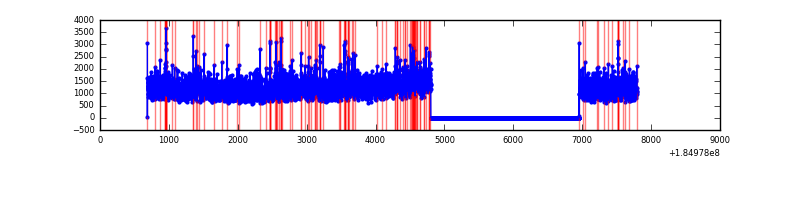 |
| C | 7106 | 4951 | 27 | 27 | 0.38% | 0.55% | 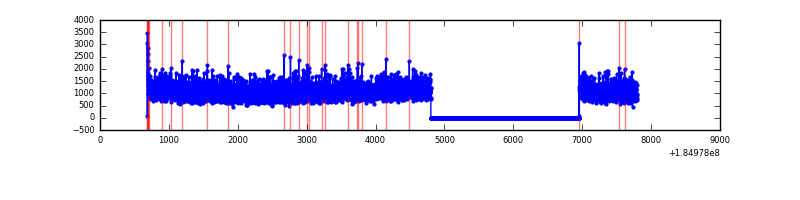 |
| D | 7106 | 4951 | 342 | 342 | 4.81% | 6.91% | 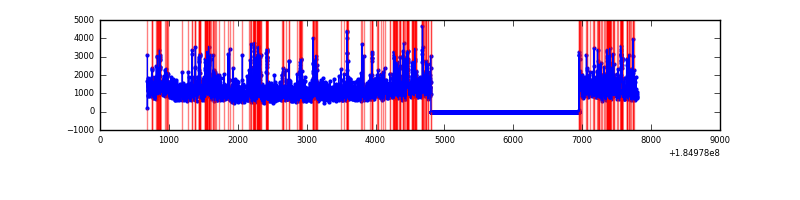 |
Top three noisy pixels from each quadrant. If the there are fewer than three noisy pixels in the level2.evt file, extra rows are filled as -1
| Pixel properties | Quadrant properties | ||||||
|---|---|---|---|---|---|---|---|
| Quadrant | DetID | PixID | Counts | Sigma | Mean | Median | Sigma |
| A | 12 | 133 | 285652 | 899.07 | 1438 | 1427 | 316.1 |
| A | 15 | 171 | 58750 | 181.33 | 1438 | 1427 | 316.1 |
| A | 12 | 236 | 23616 | 70.19 | 1438 | 1427 | 316.1 |
| B | 4 | 172 | 107983 | 310.52 | 1468 | 1478 | 343.0 |
| B | 7 | 221 | 104556 | 300.52 | 1468 | 1478 | 343.0 |
| B | 5 | 191 | 49701 | 140.59 | 1468 | 1478 | 343.0 |
| C | 15 | 241 | 18985 | 47.52 | 1329 | 1376 | 370.6 |
| C | 3 | 159 | 12290 | 29.45 | 1329 | 1376 | 370.6 |
| C | 9 | 52 | 9797 | 22.72 | 1329 | 1376 | 370.6 |
| D | 1 | 4 | 646237 | 1662.05 | 1245 | 1286 | 388.0 |
| D | 13 | 221 | 217630 | 557.52 | 1245 | 1286 | 388.0 |
| D | 13 | 216 | 203135 | 520.17 | 1245 | 1286 | 388.0 |
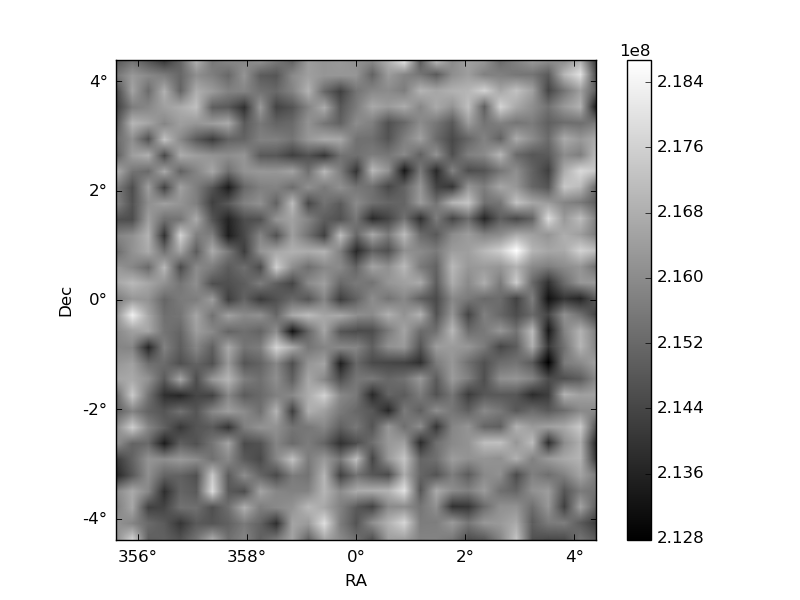
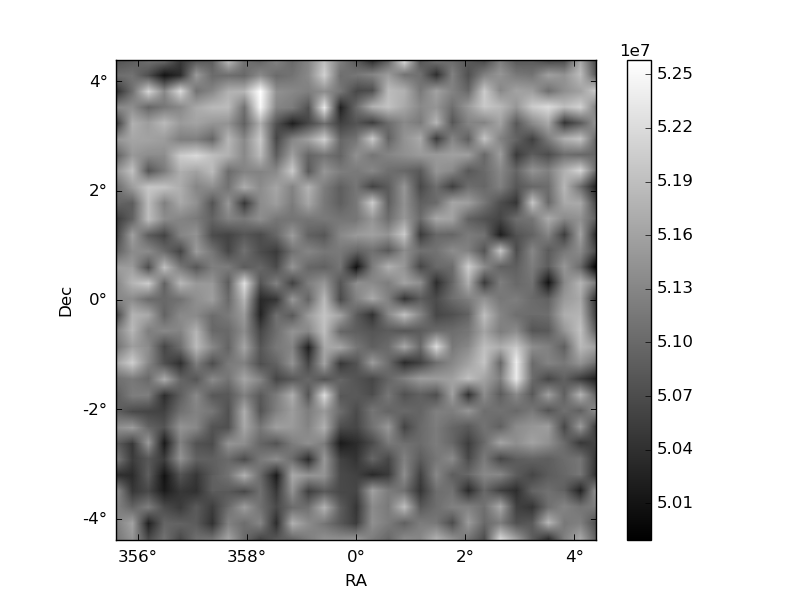
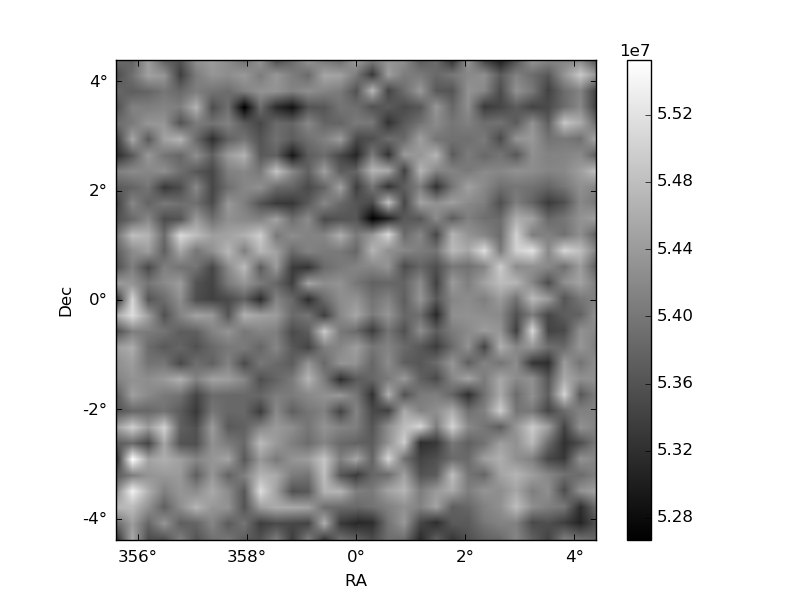
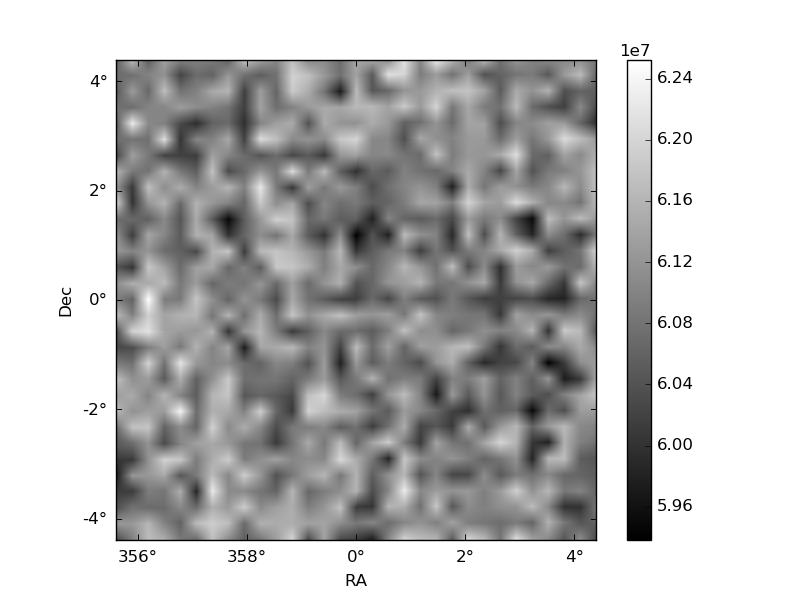
Histogram calculated using DETX and DETY for each event in the final _common_clean file
| Quadrant A | 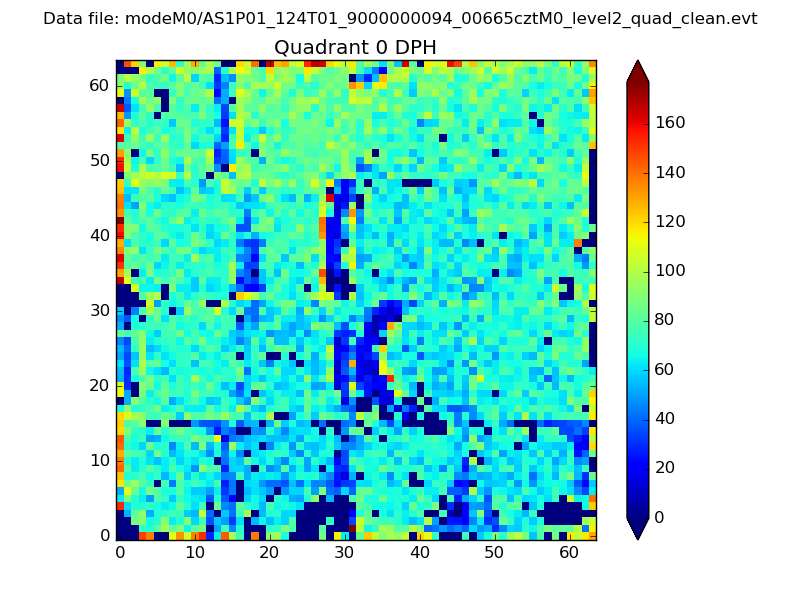 |
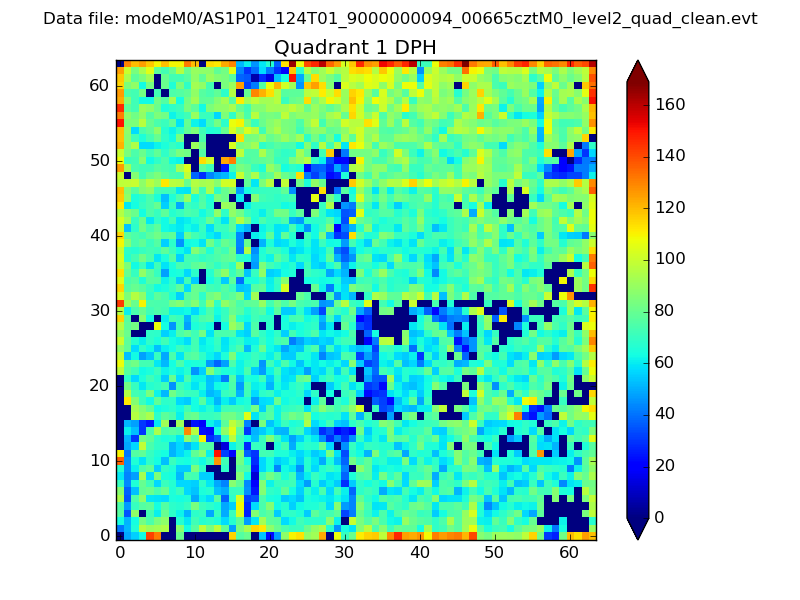 |
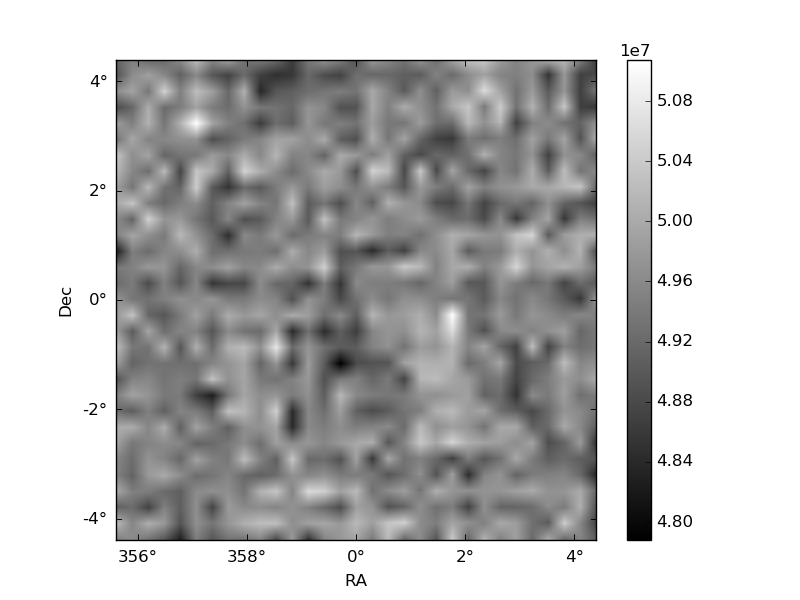
Quadrant B |
|---|---|---|---|
| Quadrant D | 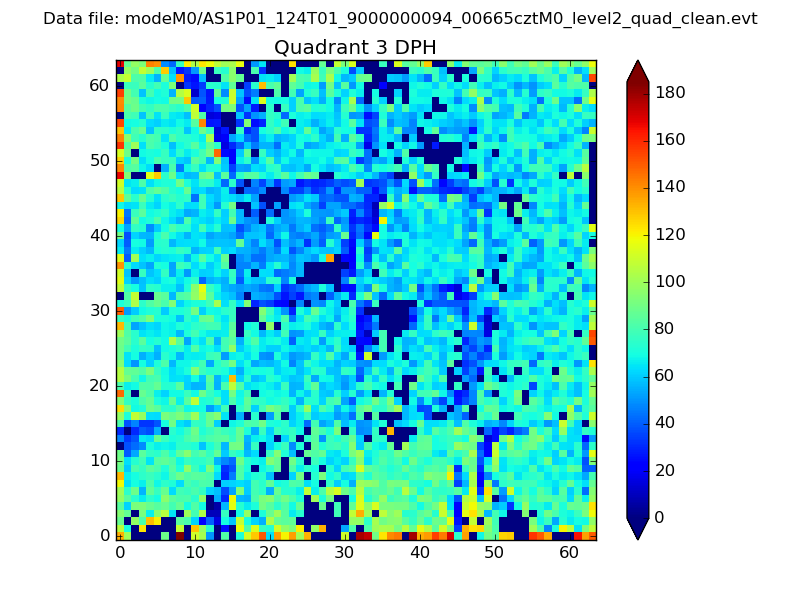 |
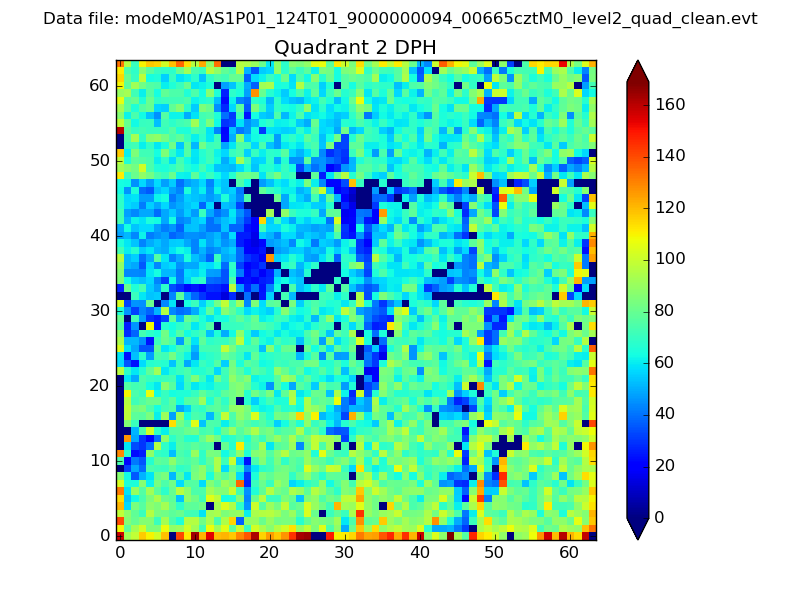 |
Quadrant C |
| Plot type | Count rate plots | Images |
|---|---|---|
| Comparison with Poisson distribution Blue bars denote a histogram of data divided into 1 sec bins. Red curve is a Poisson curve with rate = median count rate of data. |
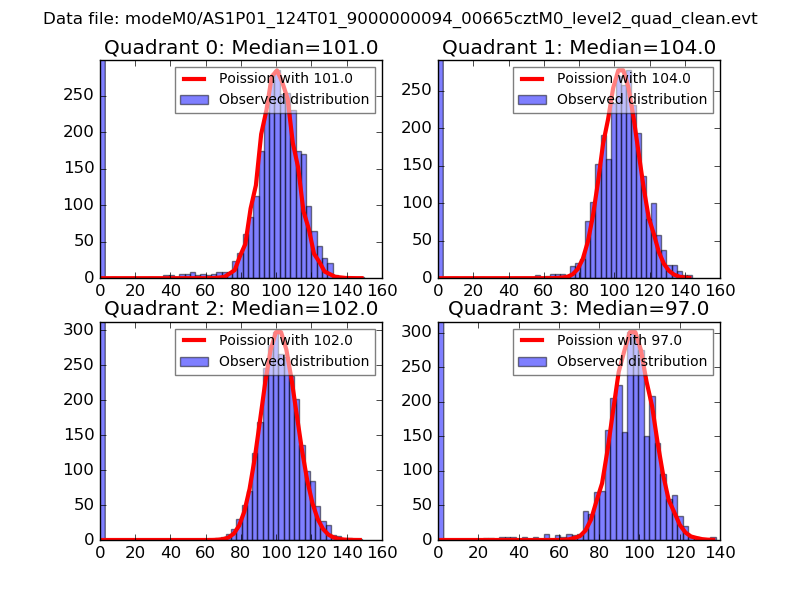 |
 |
| Quadrant-wise count rates Data is divided into 100 sec bins |
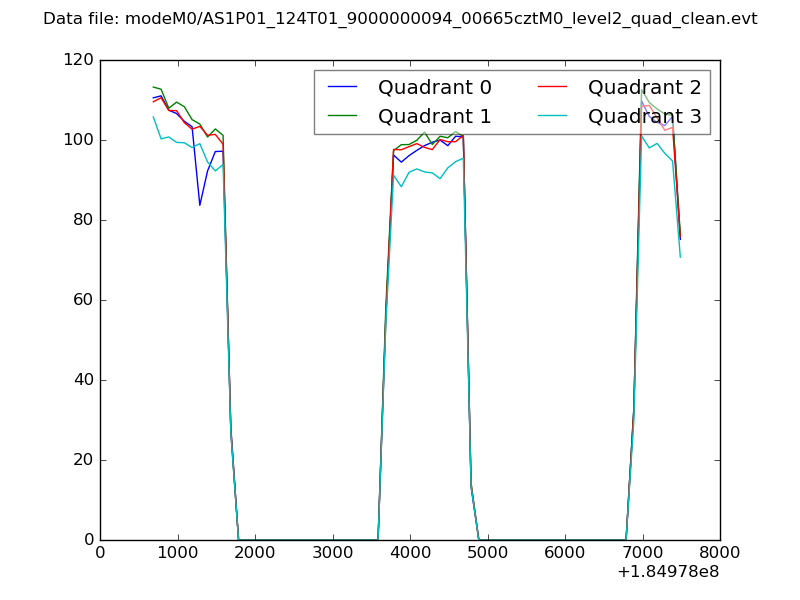 |
|
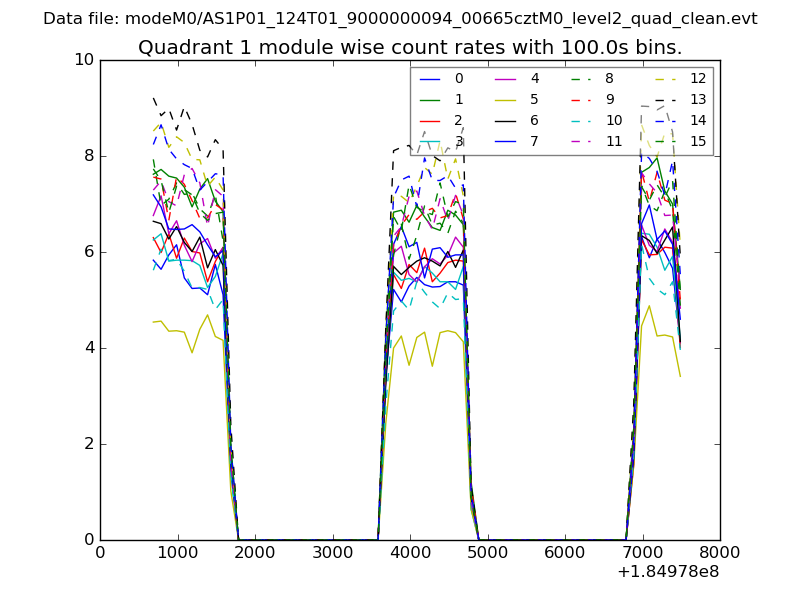
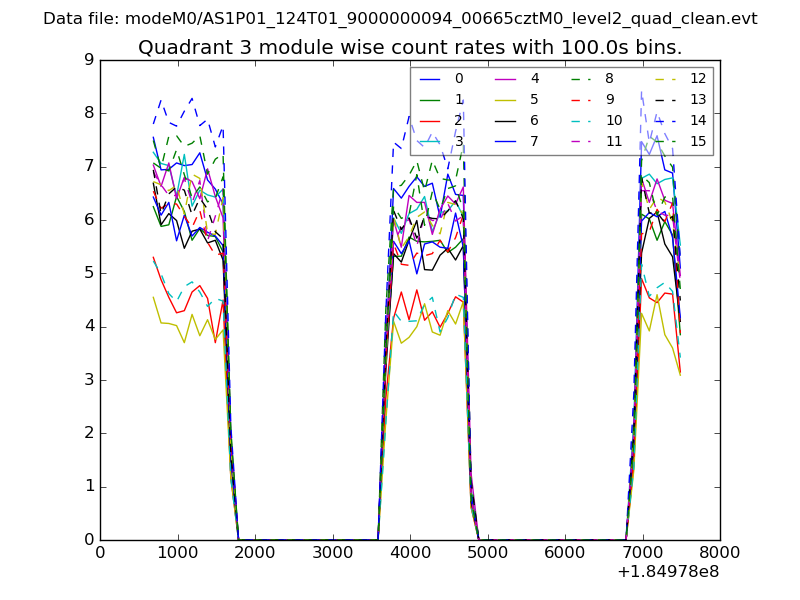
| Module-wise count rates for Quadrant A Data is divided into 100 sec bins |
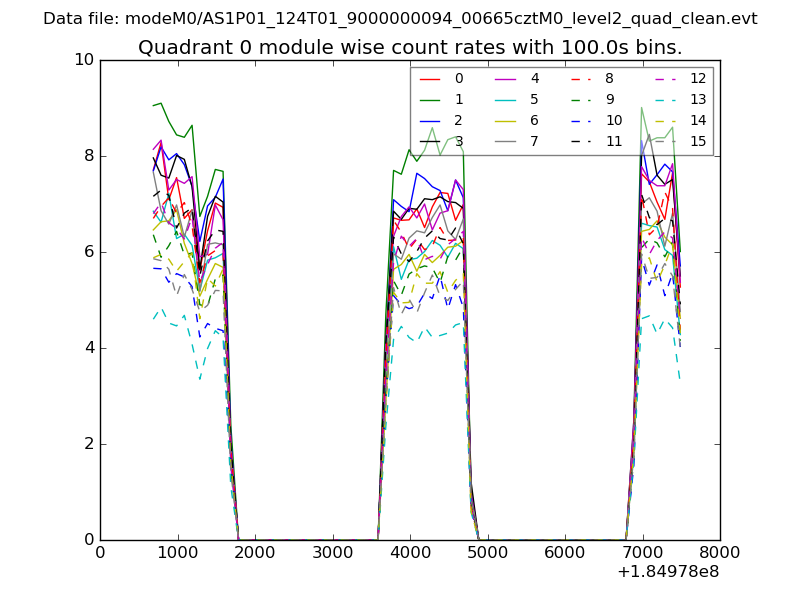 |
 |
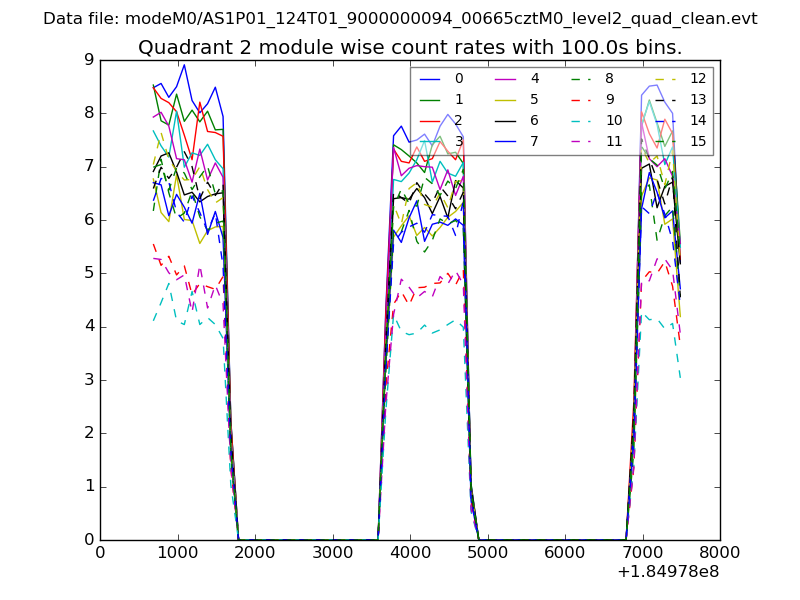
| Module-wise count rates for Quadrant B Data is divided into 100 sec bins |
 |
 |
| Module-wise count rates for Quadrant C Data is divided into 100 sec bins |
 |
 |
| Module-wise count rates for Quadrant D Data is divided into 100 sec bins |
 |
 |
| Parameter | Plot |
|---|---|
| CZT HV Monitor | 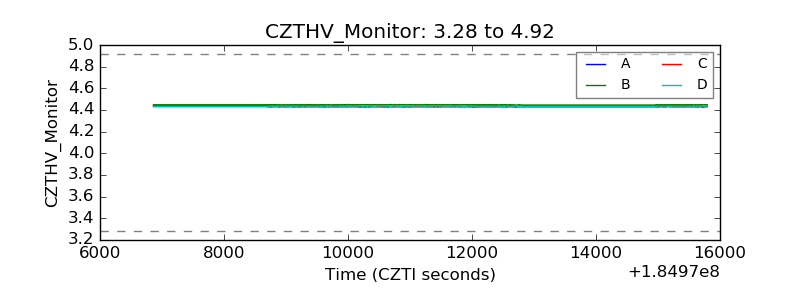 |
| D_VDD | 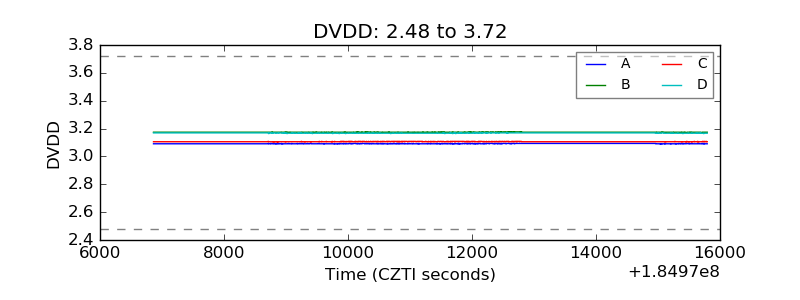 |
| Temperature 1 | 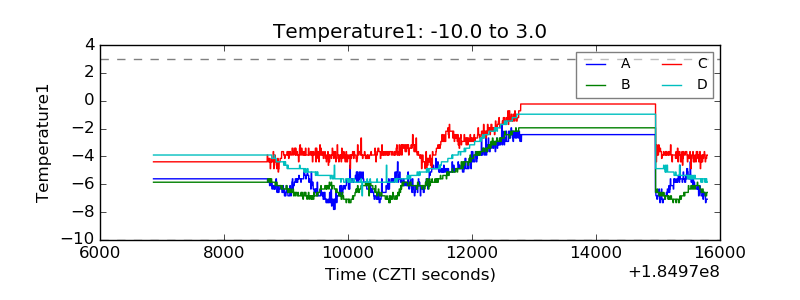 |
| Veto HV Monitor | 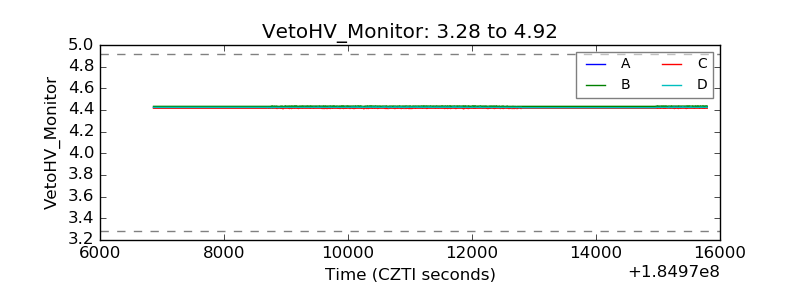 |
| Veto LLD | 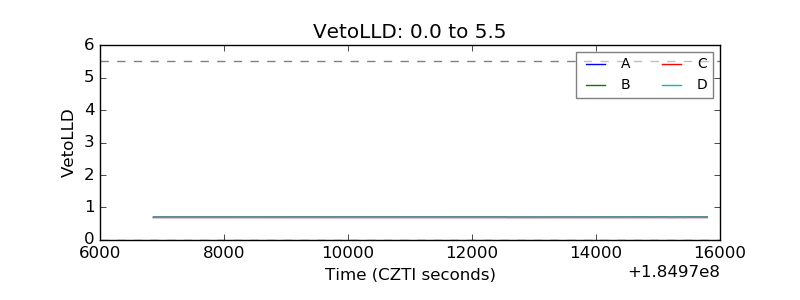 |
| Alpha Counter | 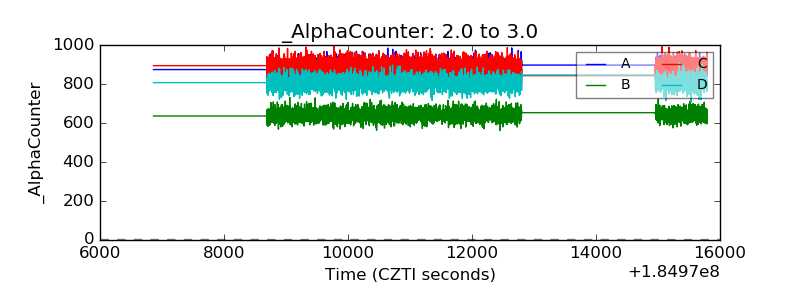 |
| _CPM_Rate | 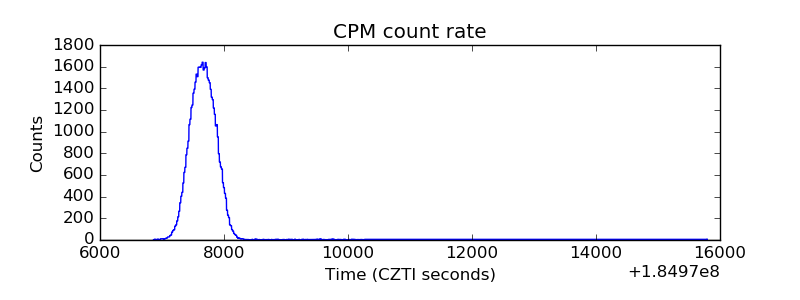 |
| CZT Counter | 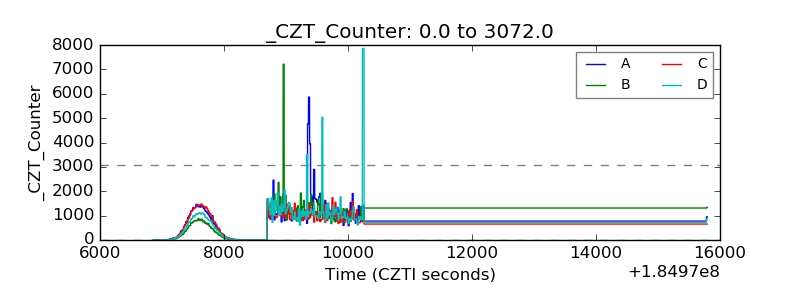 |
| +2.5 Volts monitor |  |
| +5 Volts monitor |  |
| _ROLL_ROT | 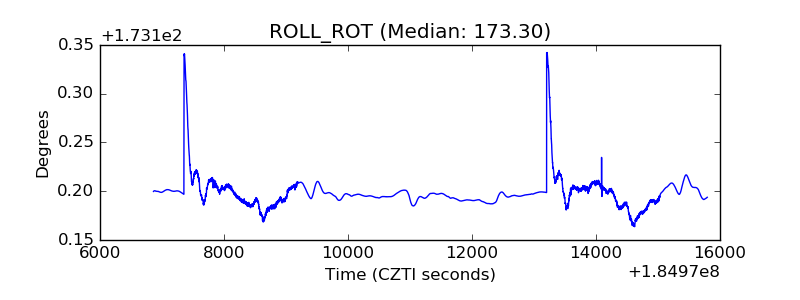 |
| _Roll_DEC | 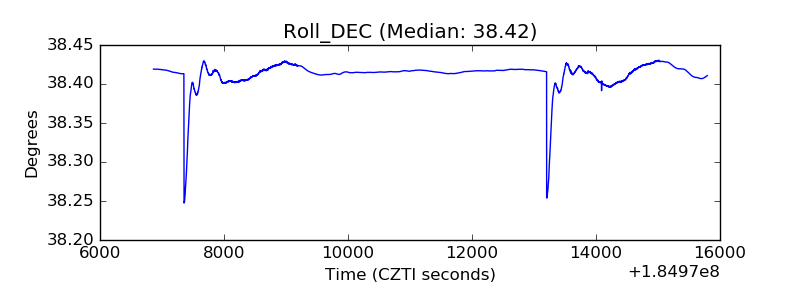 |
| _Roll_RA | 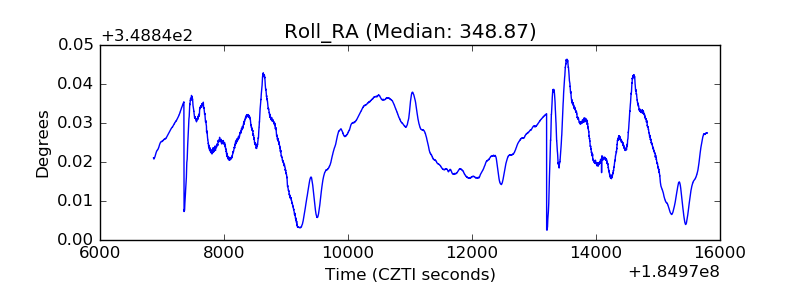 |
| Veto Counter | 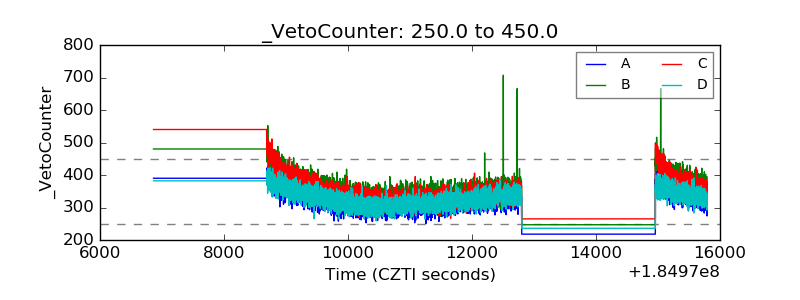 |