| Param | Original file | Final file |
|---|---|---|
| Filename | modeM0/AS1P01_124T01_9000000094_00666cztM0_level2.evt | modeM0/AS1P01_124T01_9000000094_00666cztM0_level2_quad_clean.evt |
| Size (bytes) | 798,197,760 | 41,279,040 |
| Size | 761.2 MB | 39.4 MB |
| Events in quadrant A | 5,857,199 | 228,105 |
| Events in quadrant B | 6,270,877 | 229,144 |
| Events in quadrant C | 5,304,923 | 228,380 |
| Events in quadrant D | 6,407,897 | 213,081 |
| Mode M9 | |||
|---|---|---|---|
| Quadrant | BADHDUFLAG | Total packets | Discarded packets |
| A | 0 | 35 | 0 |
| B | 0 | 35 | 0 |
| C | 0 | 35 | 0 |
| D | 0 | 35 | 0 |
| Mode M0 | |||
|---|---|---|---|
| Quadrant | BADHDUFLAG | Total packets | Discarded packets |
| A | 0 | 20938 | 2 |
| B | 0 | 22203 | 5 |
| C | 0 | 19317 | 2 |
| D | 0 | 22612 | 2 |
| Mode SS | |||
|---|---|---|---|
| Quadrant | BADHDUFLAG | Total packets | Discarded packets |
| A | 0 | 102 | 0 |
| B | 0 | 102 | 0 |
| C | 0 | 102 | 0 |
| D | 0 | 102 | 0 |
| Quadrant | Total seconds | Saturated seconds | Saturation percentage |
|---|---|---|---|
| A | 5001 | 6 | 0.119976% |
| B | 5000 | 92 | 1.840000% |
| C | 5000 | 3 | 0.060000% |
| D | 5000 | 200 | 4.000000% |
Noise dominated data is calculated using 1-second bins in cleaned event files. If a bin has >2000 counts, and if more than 50% of those come from <1% of pixels, then it is considered to be noise-dominated and hence unusable.
| Quadrant | # 1 sec bins | Bins with >0 counts | Bins with >2000 counts | High rate bins dominated by noise | Noise dominated (total time) | Noise dominated (detector-on time) | Marked lightcurve |
|---|---|---|---|---|---|---|---|
| A | 7157 | 5002 | 111 | 111 | 1.55% | 2.22% | 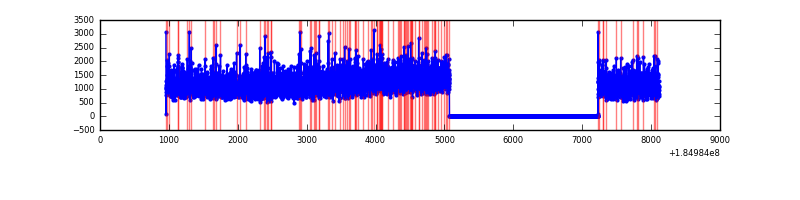 |
| B | 7156 | 5001 | 227 | 227 | 3.17% | 4.54% | 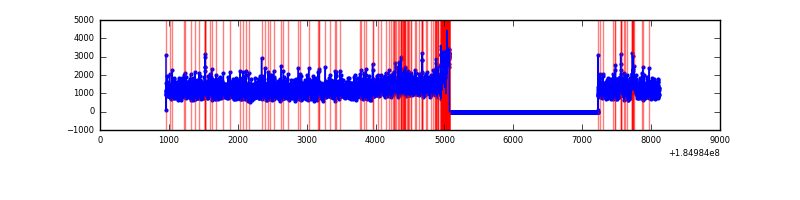 |
| C | 7156 | 5001 | 27 | 27 | 0.38% | 0.54% | 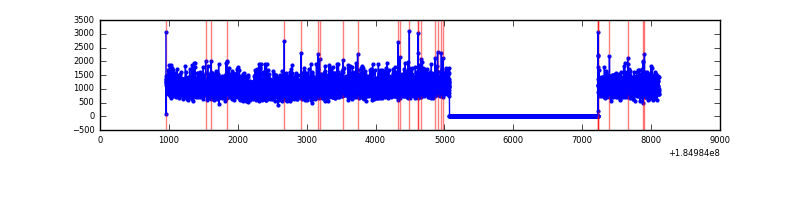 |
| D | 7156 | 5001 | 432 | 432 | 6.04% | 8.64% | 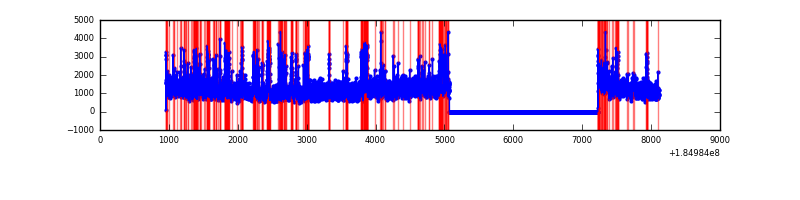 |
Top three noisy pixels from each quadrant. If the there are fewer than three noisy pixels in the level2.evt file, extra rows are filled as -1
| Pixel properties | Quadrant properties | ||||||
|---|---|---|---|---|---|---|---|
| Quadrant | DetID | PixID | Counts | Sigma | Mean | Median | Sigma |
| A | 14 | 79 | 29089 | 83.71 | 1482 | 1467 | 330.0 |
| A | 0 | 238 | 23636 | 67.18 | 1482 | 1467 | 330.0 |
| A | 0 | 69 | 21047 | 59.34 | 1482 | 1467 | 330.0 |
| B | 5 | 191 | 254417 | 722.15 | 1485 | 1494 | 350.2 |
| B | 7 | 221 | 178943 | 506.66 | 1485 | 1494 | 350.2 |
| B | 14 | 50 | 44627 | 123.15 | 1485 | 1494 | 350.2 |
| C | 15 | 241 | 14214 | 34.17 | 1343 | 1388 | 375.3 |
| C | 9 | 52 | 12189 | 28.78 | 1343 | 1388 | 375.3 |
| C | 5 | 249 | 4777 | 9.03 | 1343 | 1388 | 375.3 |
| D | 1 | 4 | 708340 | 1774.1 | 1265 | 1309 | 398.5 |
| D | 12 | 233 | 198600 | 495.05 | 1265 | 1309 | 398.5 |
| D | 13 | 221 | 184337 | 459.26 | 1265 | 1309 | 398.5 |
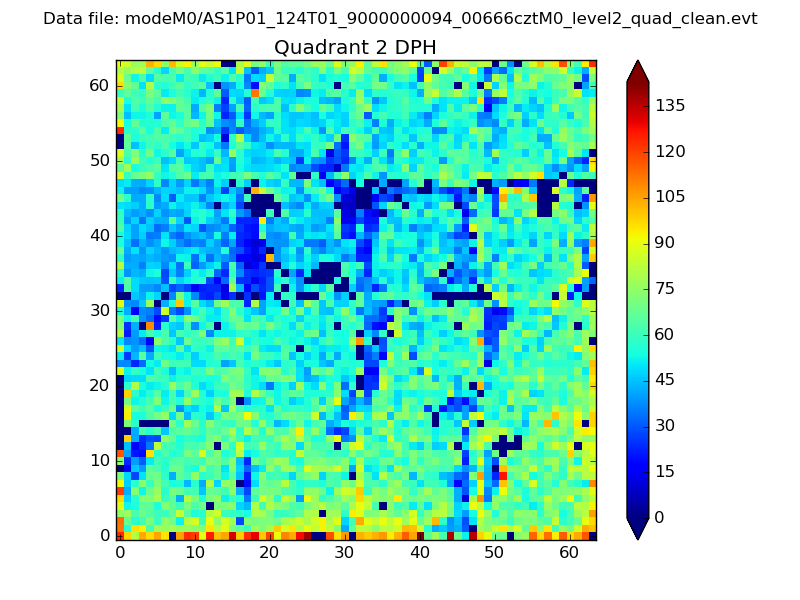
Histogram calculated using DETX and DETY for each event in the final _common_clean file
| Quadrant A | 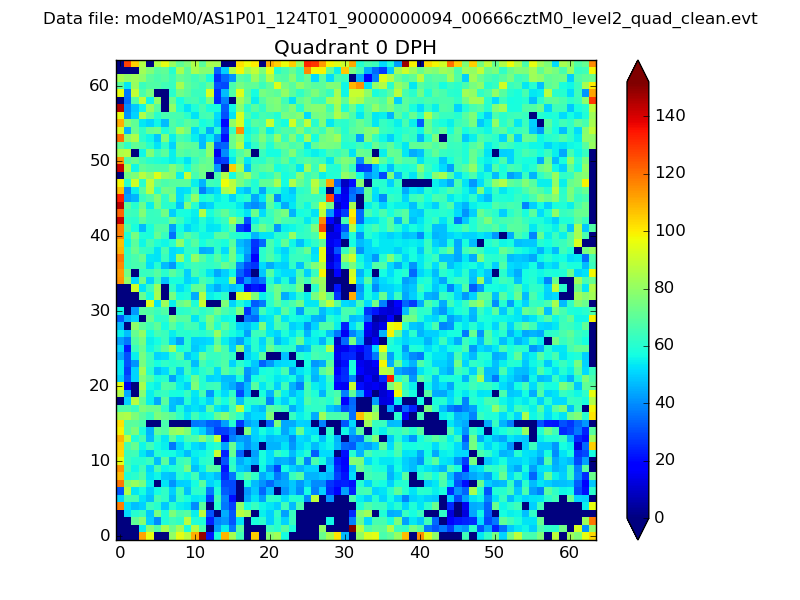 |
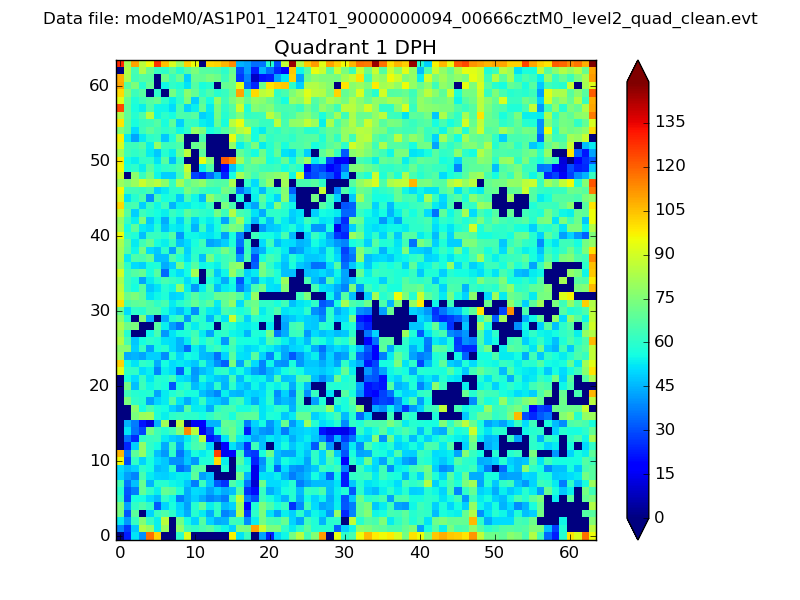 |
Quadrant B |
|---|---|---|---|
| Quadrant D | 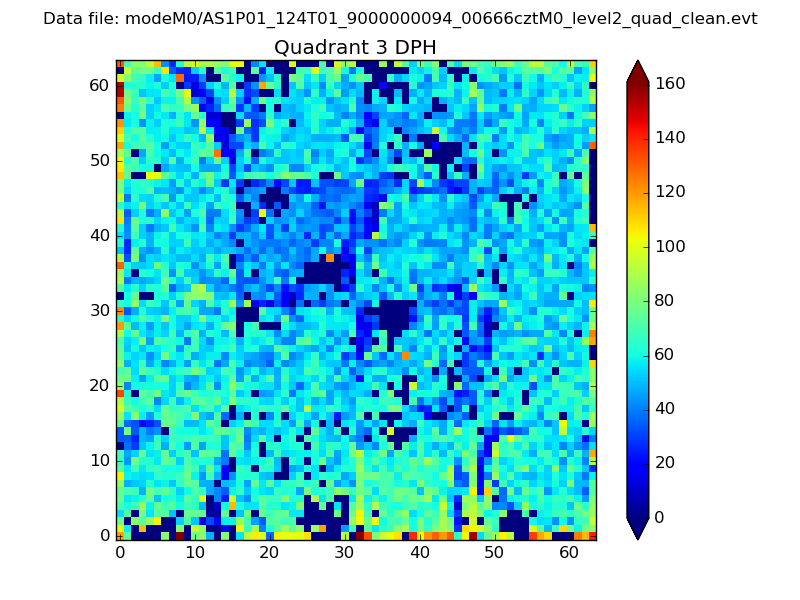 |
 |
Quadrant C |
| Plot type | Count rate plots | Images |
|---|---|---|
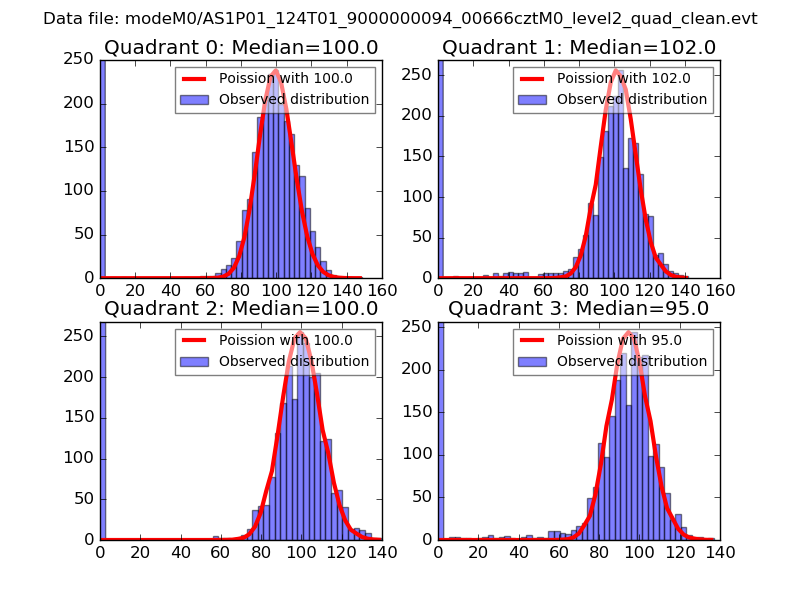
| Comparison with Poisson distribution Blue bars denote a histogram of data divided into 1 sec bins. Red curve is a Poisson curve with rate = median count rate of data. |
 |
 |
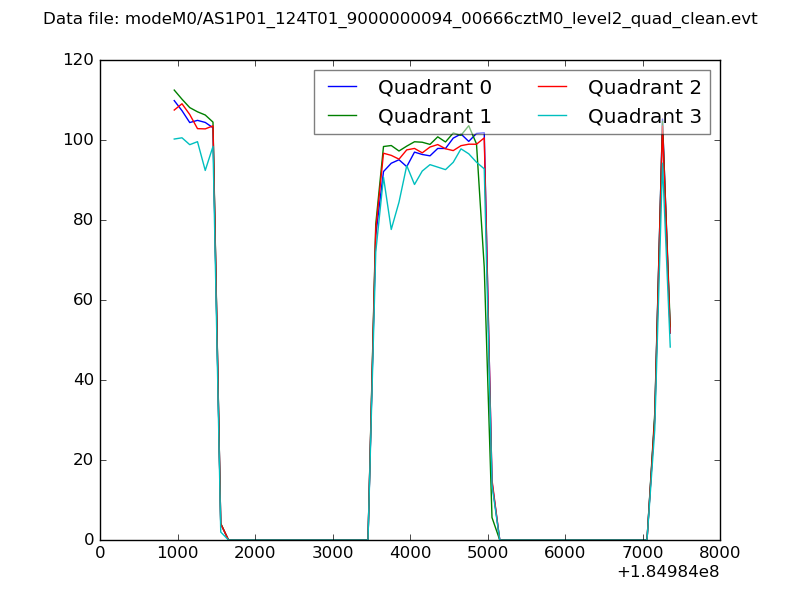
| Quadrant-wise count rates Data is divided into 100 sec bins |
 |
|
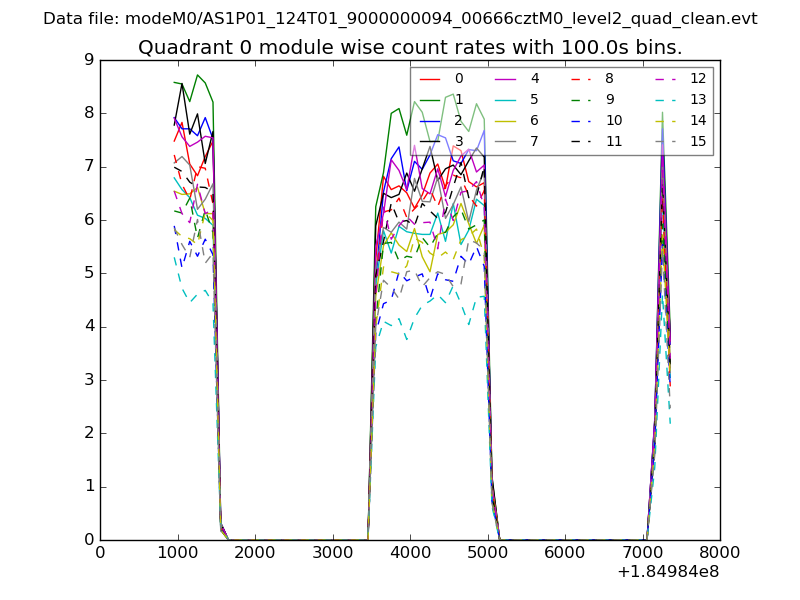
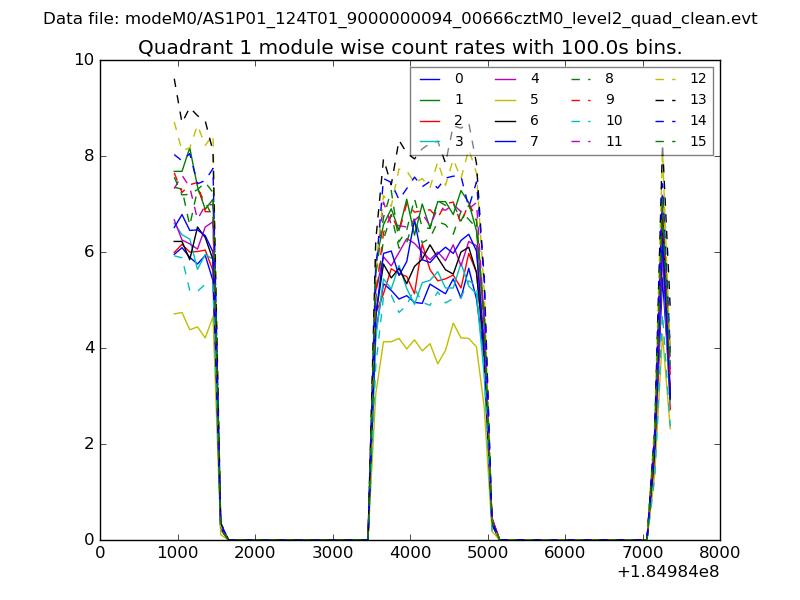
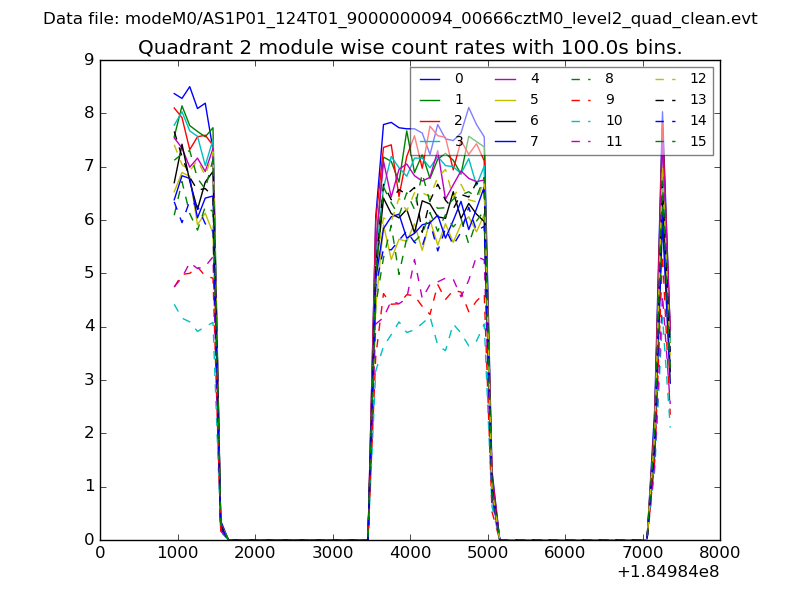
| Module-wise count rates for Quadrant A Data is divided into 100 sec bins |
 |
 |
| Module-wise count rates for Quadrant B Data is divided into 100 sec bins |
 |
 |
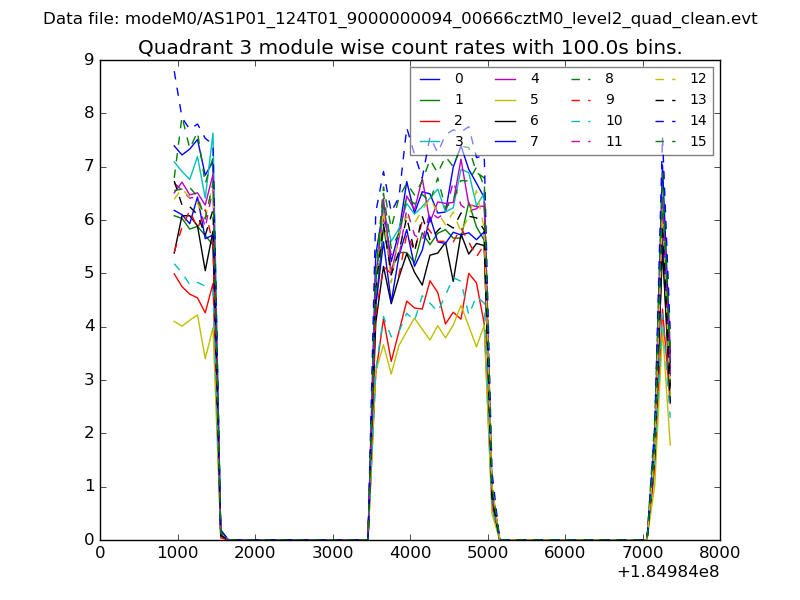
| Module-wise count rates for Quadrant C Data is divided into 100 sec bins |
 |
 |
| Module-wise count rates for Quadrant D Data is divided into 100 sec bins |
 |
 |
| Parameter | Plot |
|---|---|
| CZT HV Monitor | 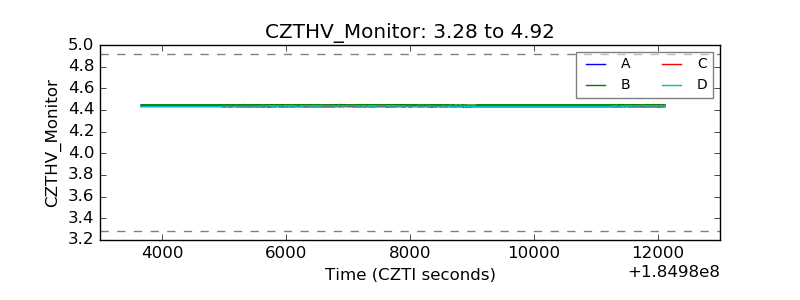 |
| D_VDD | 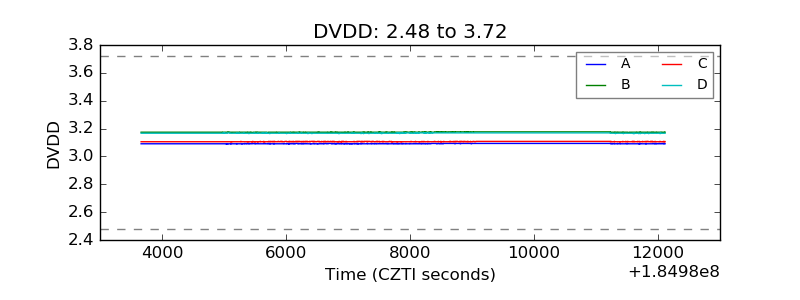 |
| Temperature 1 | 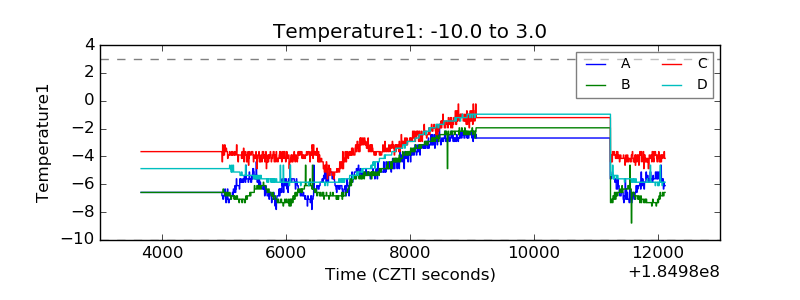 |
| Veto HV Monitor | 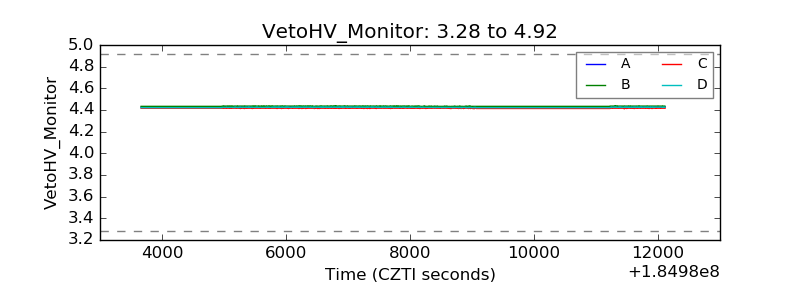 |
| Veto LLD | 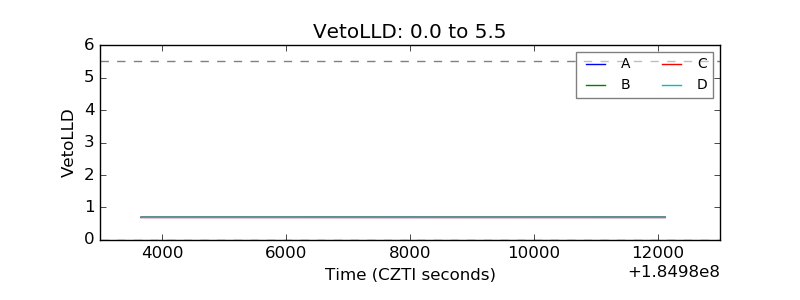 |
| Alpha Counter | 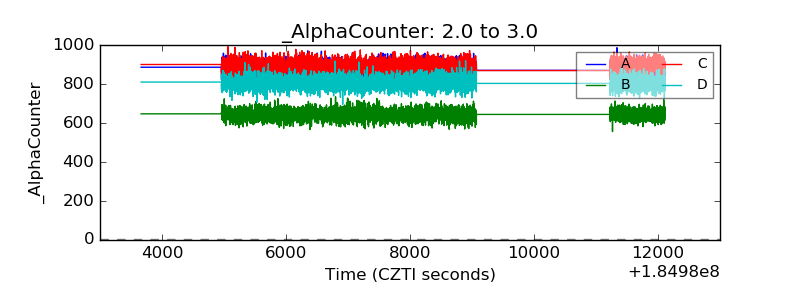 |
| _CPM_Rate | 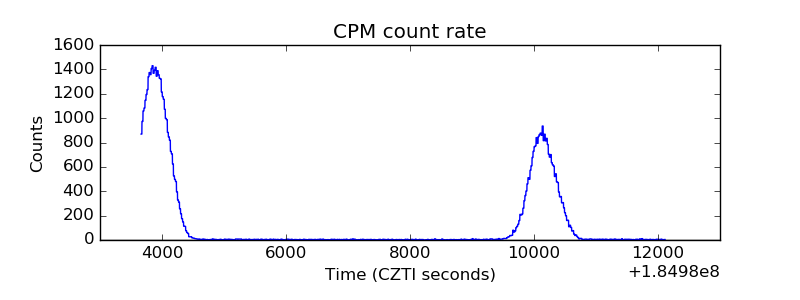 |
| CZT Counter | 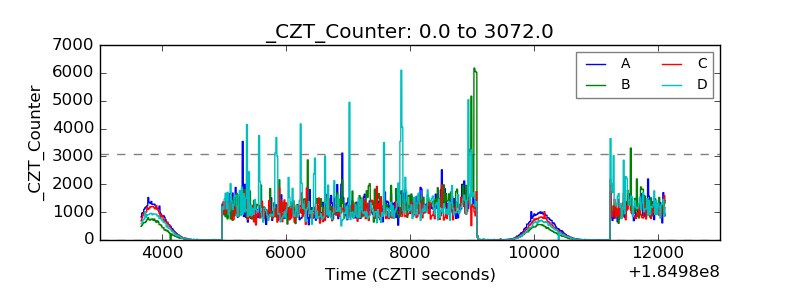 |
| +2.5 Volts monitor |  |
| +5 Volts monitor | 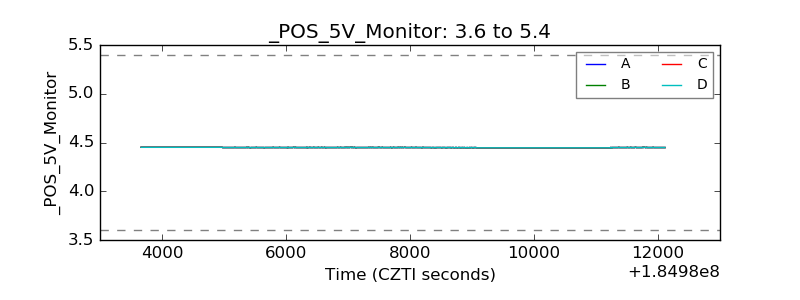 |
| _ROLL_ROT | 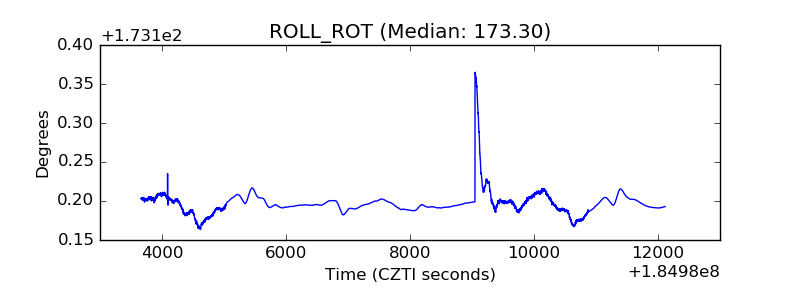 |
| _Roll_DEC | 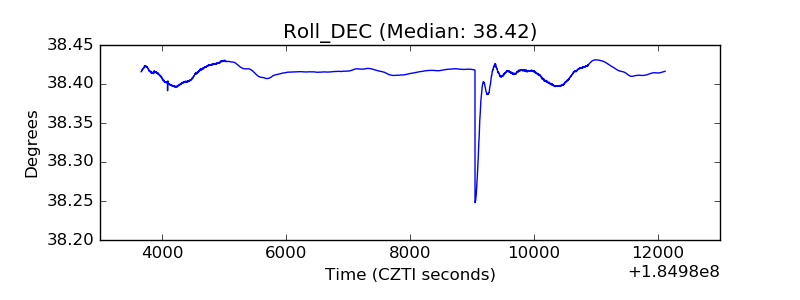 |
| _Roll_RA | 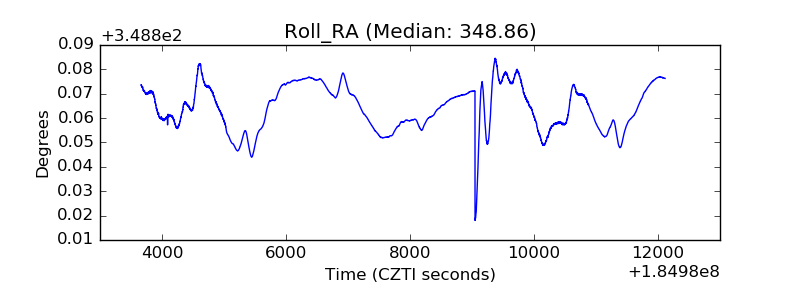 |
| Veto Counter | 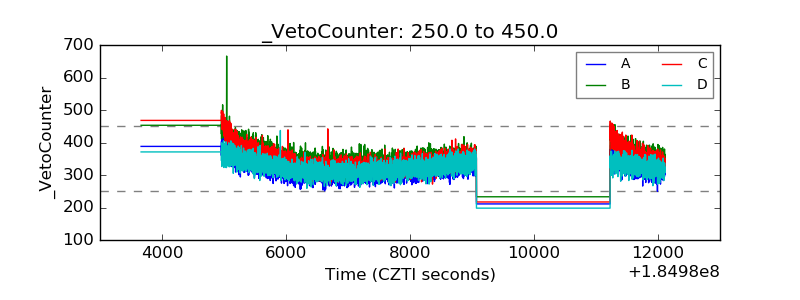 |