| Param | Original file | Final file |
|---|---|---|
| Filename | modeM0/AS1P01_124T01_9000000094_00667cztM0_level2.evt | modeM0/AS1P01_124T01_9000000094_00667cztM0_level2_quad_clean.evt |
| Size (bytes) | 677,286,720 | 38,278,080 |
| Size | 645.9 MB | 36.5 MB |
| Events in quadrant A | 5,089,660 | 217,511 |
| Events in quadrant B | 5,450,568 | 216,602 |
| Events in quadrant C | 4,552,907 | 217,160 |
| Events in quadrant D | 5,134,149 | 206,792 |
| Mode M9 | |||
|---|---|---|---|
| Quadrant | BADHDUFLAG | Total packets | Discarded packets |
| A | 0 | 21 | 0 |
| B | 0 | 21 | 0 |
| C | 0 | 21 | 0 |
| D | 0 | 21 | 0 |
| Mode M0 | |||
|---|---|---|---|
| Quadrant | BADHDUFLAG | Total packets | Discarded packets |
| A | 0 | 18149 | 1 |
| B | 0 | 19239 | 1 |
| C | 0 | 16548 | 1 |
| D | 0 | 18307 | 1 |
| Mode SS | |||
|---|---|---|---|
| Quadrant | BADHDUFLAG | Total packets | Discarded packets |
| A | 0 | 88 | 0 |
| B | 0 | 88 | 0 |
| C | 0 | 88 | 0 |
| D | 0 | 88 | 0 |
| Quadrant | Total seconds | Saturated seconds | Saturation percentage |
|---|---|---|---|
| A | 4264 | 2 | 0.046904% |
| B | 4264 | 90 | 2.110694% |
| C | 4264 | 3 | 0.070356% |
| D | 4264 | 51 | 1.196060% |
Noise dominated data is calculated using 1-second bins in cleaned event files. If a bin has >2000 counts, and if more than 50% of those come from <1% of pixels, then it is considered to be noise-dominated and hence unusable.
| Quadrant | # 1 sec bins | Bins with >0 counts | Bins with >2000 counts | High rate bins dominated by noise | Noise dominated (total time) | Noise dominated (detector-on time) | Marked lightcurve |
|---|---|---|---|---|---|---|---|
| A | 6420 | 4265 | 89 | 89 | 1.39% | 2.09% | 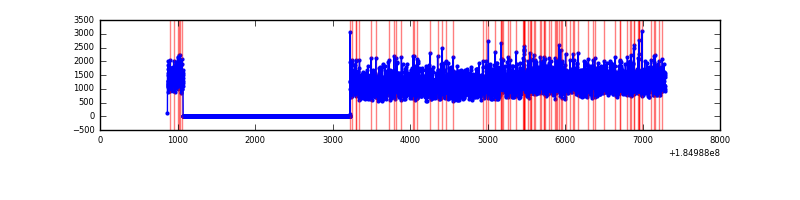 |
| B | 6420 | 4265 | 236 | 236 | 3.68% | 5.53% | 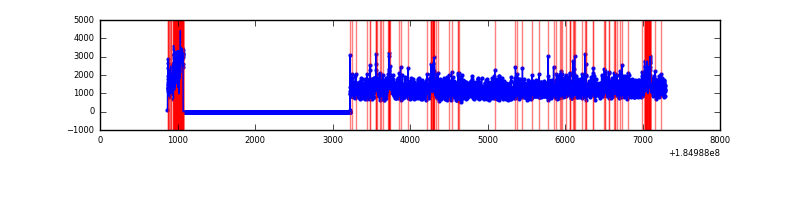 |
| C | 6420 | 4265 | 36 | 36 | 0.56% | 0.84% | 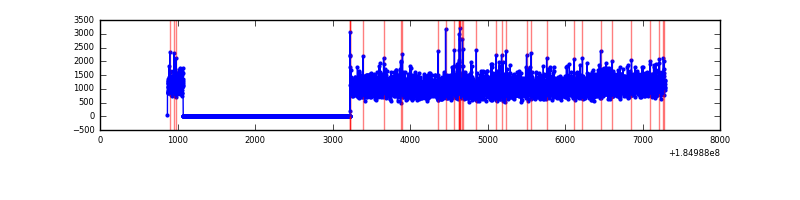 |
| D | 6420 | 4265 | 207 | 207 | 3.22% | 4.85% | 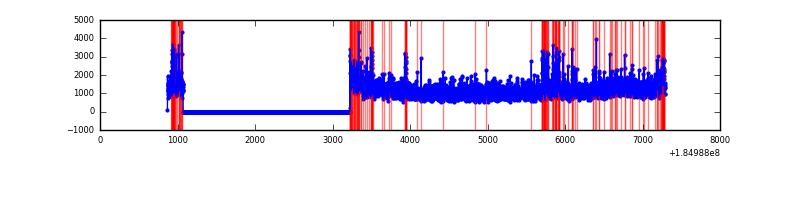 |
Top three noisy pixels from each quadrant. If the there are fewer than three noisy pixels in the level2.evt file, extra rows are filled as -1
| Pixel properties | Quadrant properties | ||||||
|---|---|---|---|---|---|---|---|
| Quadrant | DetID | PixID | Counts | Sigma | Mean | Median | Sigma |
| A | 14 | 79 | 42331 | 141.61 | 1293 | 1278 | 289.9 |
| A | 12 | 236 | 17602 | 56.31 | 1293 | 1278 | 289.9 |
| A | 0 | 238 | 13418 | 41.87 | 1293 | 1278 | 289.9 |
| B | 5 | 191 | 292777 | 968.96 | 1271 | 1280 | 300.8 |
| B | 7 | 221 | 157232 | 518.4 | 1271 | 1280 | 300.8 |
| B | 4 | 172 | 58196 | 189.19 | 1271 | 1280 | 300.8 |
| C | 9 | 52 | 40959 | 125.25 | 1144 | 1184 | 317.6 |
| C | 15 | 241 | 11391 | 32.14 | 1144 | 1184 | 317.6 |
| C | 5 | 249 | 4622 | 10.83 | 1144 | 1184 | 317.6 |
| D | 12 | 237 | 178198 | 501.65 | 1123 | 1166 | 352.9 |
| D | 1 | 4 | 131199 | 368.47 | 1123 | 1166 | 352.9 |
| D | 12 | 233 | 111788 | 313.47 | 1123 | 1166 | 352.9 |
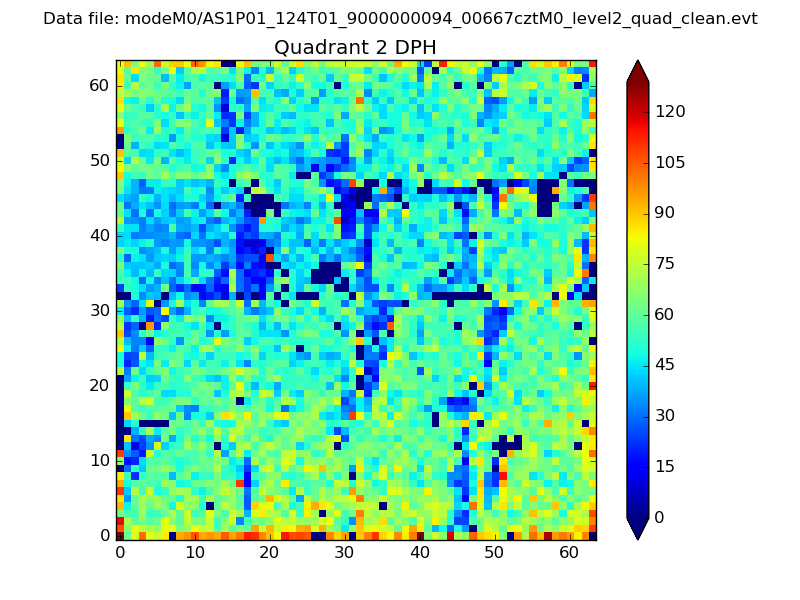
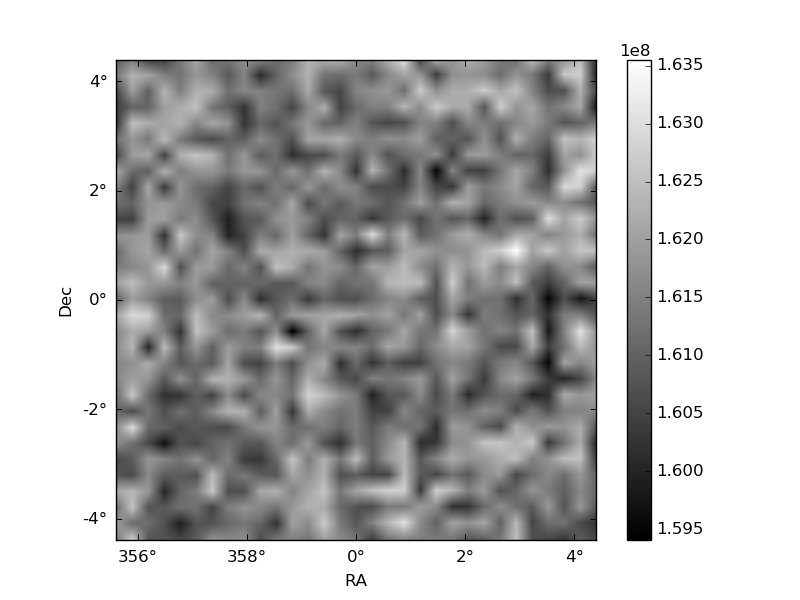
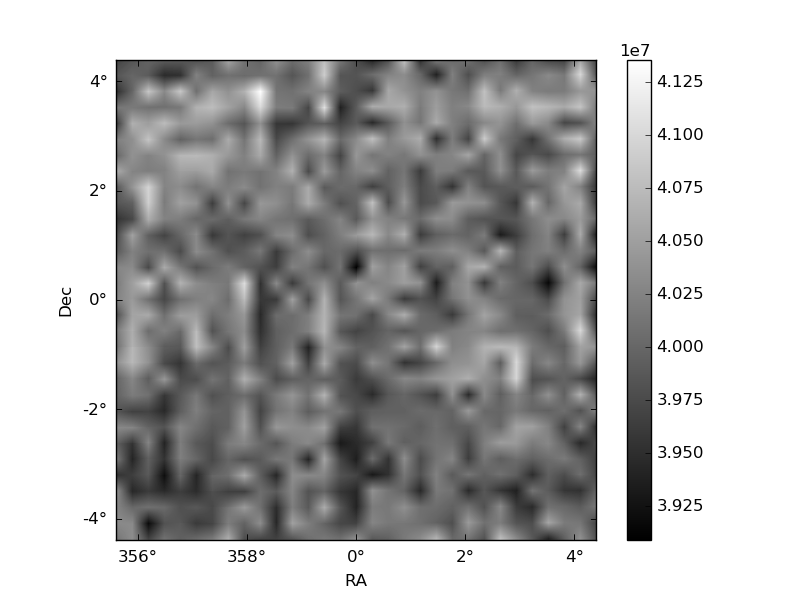
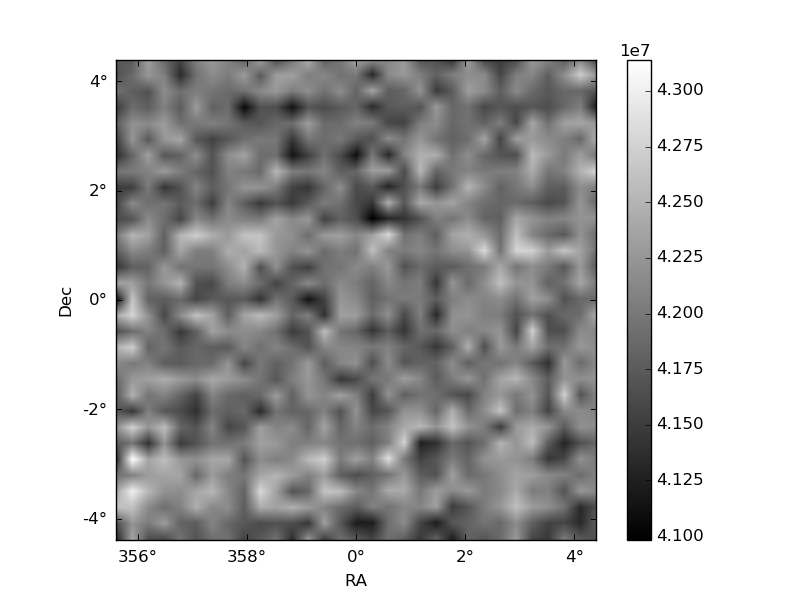
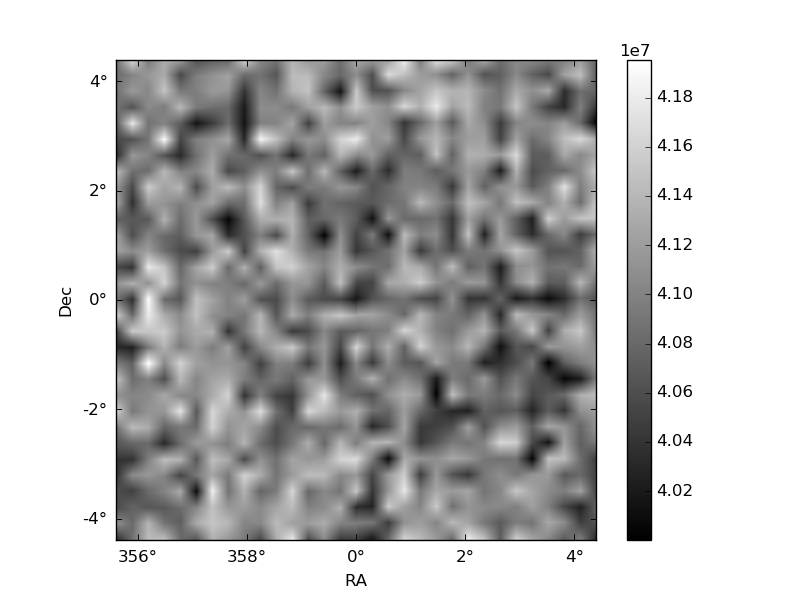
Histogram calculated using DETX and DETY for each event in the final _common_clean file
| Quadrant A | 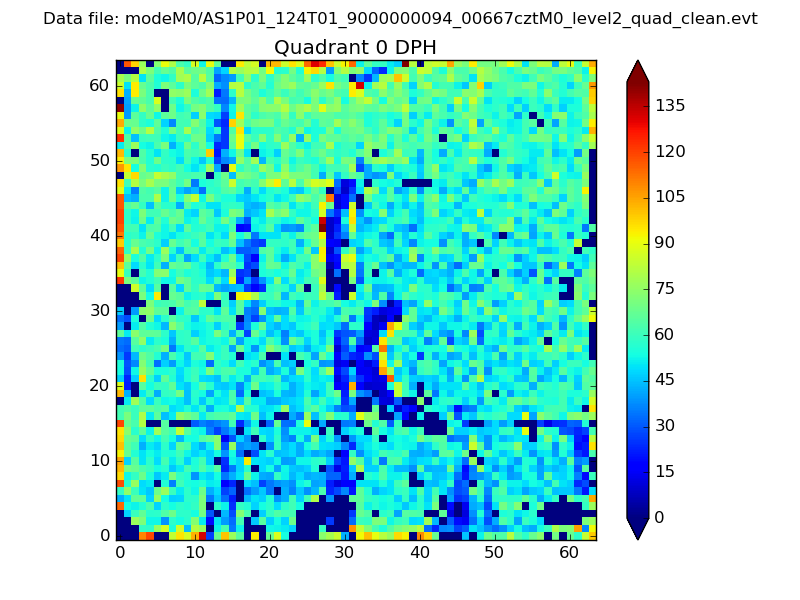 |
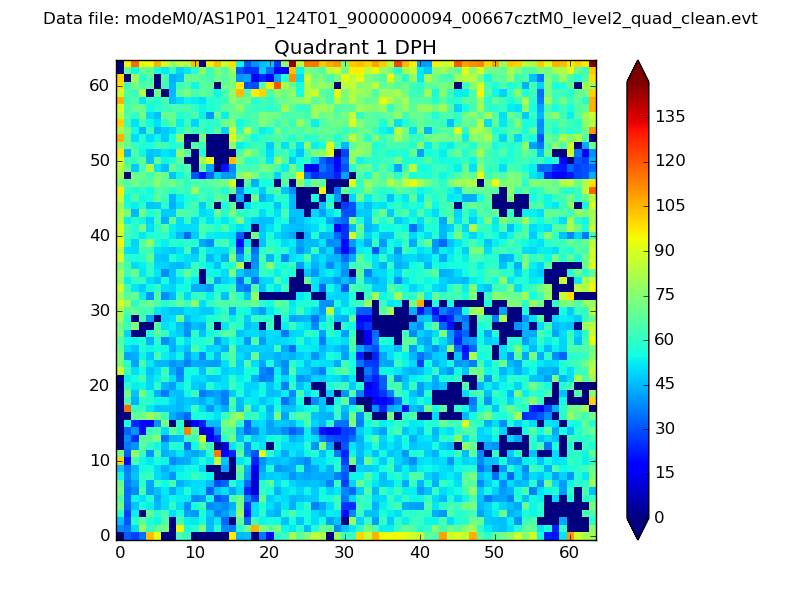 |
Quadrant B |
|---|---|---|---|
| Quadrant D | 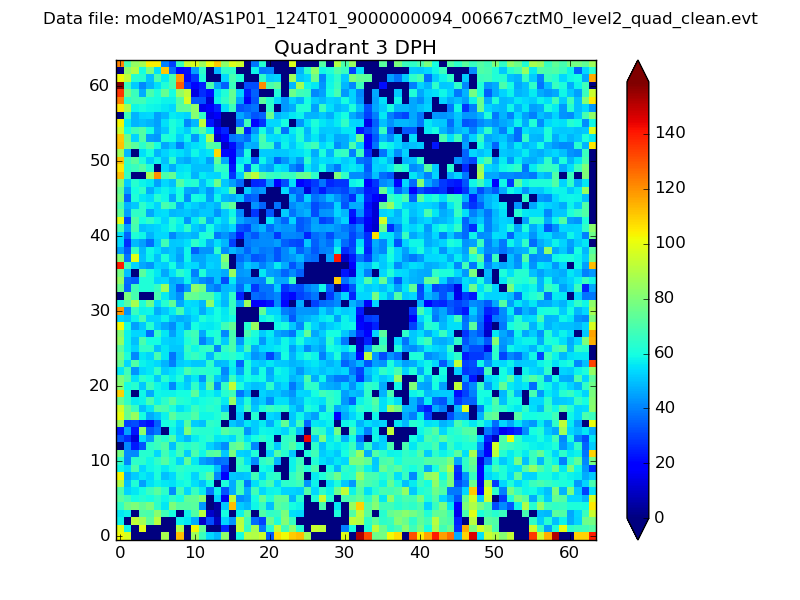 |
 |
Quadrant C |
| Plot type | Count rate plots | Images |
|---|---|---|
| Comparison with Poisson distribution Blue bars denote a histogram of data divided into 1 sec bins. Red curve is a Poisson curve with rate = median count rate of data. |
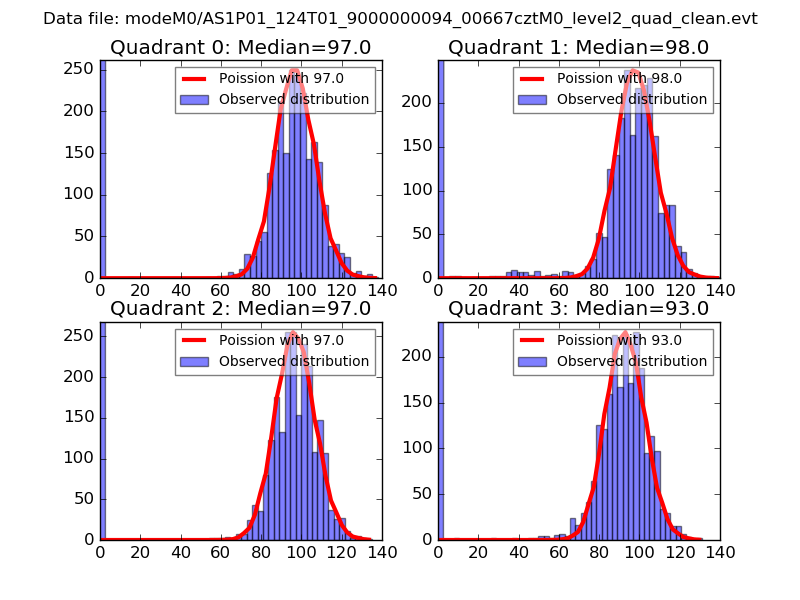 |
 |
| Quadrant-wise count rates Data is divided into 100 sec bins |
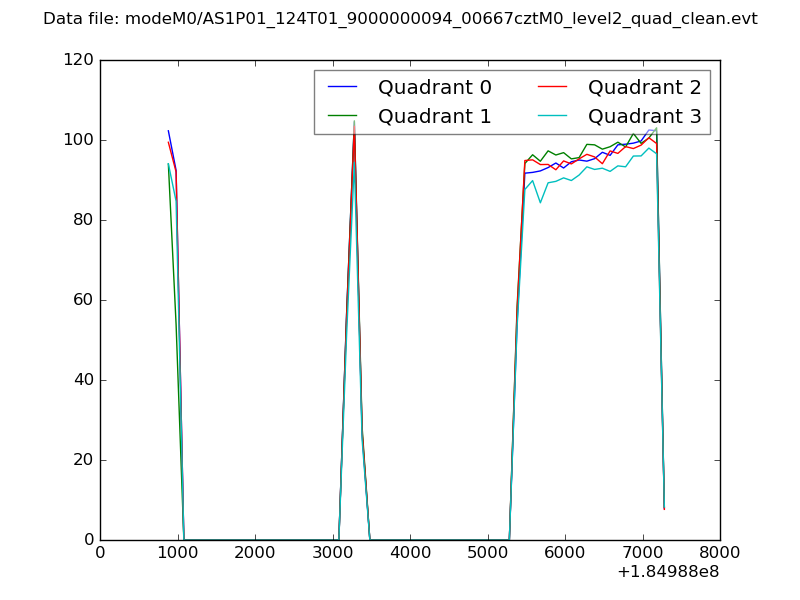 |
|
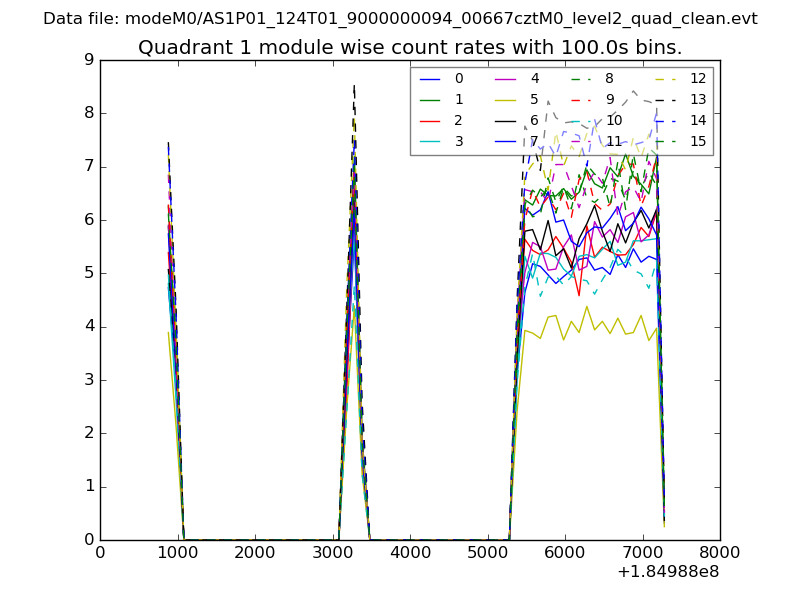
| Module-wise count rates for Quadrant A Data is divided into 100 sec bins |
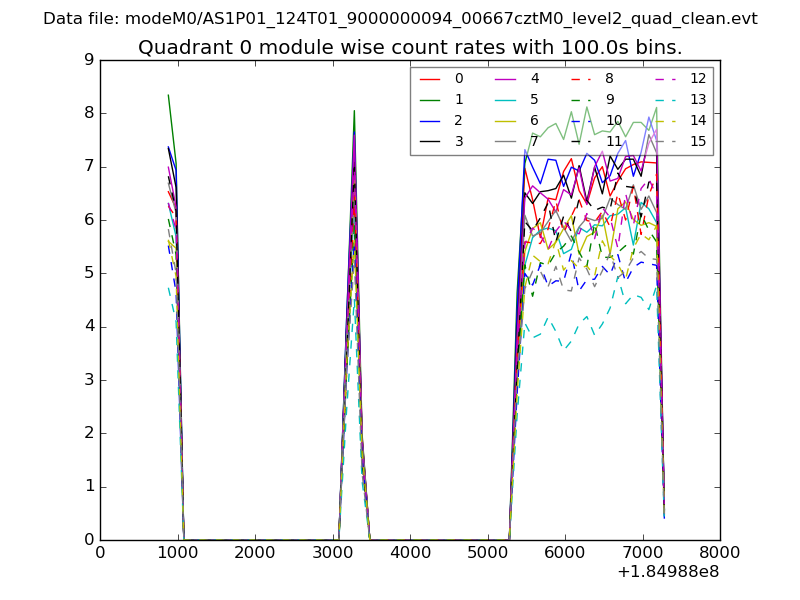 |
 |
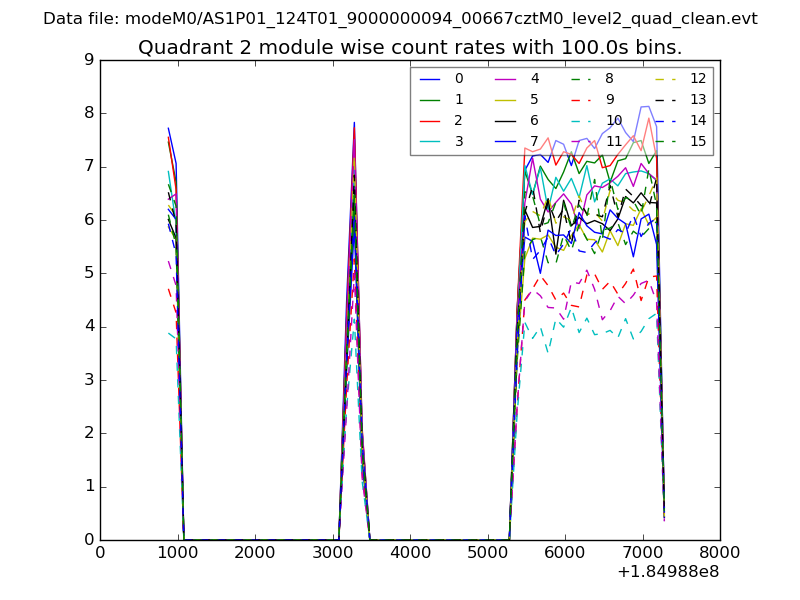
| Module-wise count rates for Quadrant B Data is divided into 100 sec bins |
 |
 |
| Module-wise count rates for Quadrant C Data is divided into 100 sec bins |
 |
 |
| Module-wise count rates for Quadrant D Data is divided into 100 sec bins |
 |
 |
| Parameter | Plot |
|---|---|
| CZT HV Monitor | 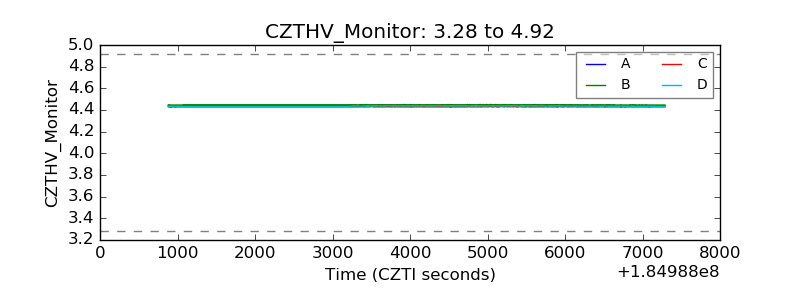 |
| D_VDD | 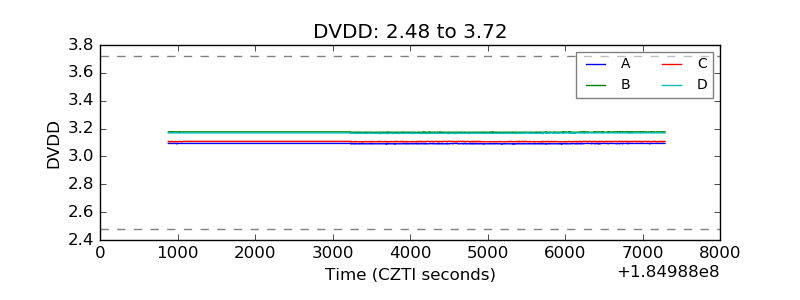 |
| Temperature 1 | 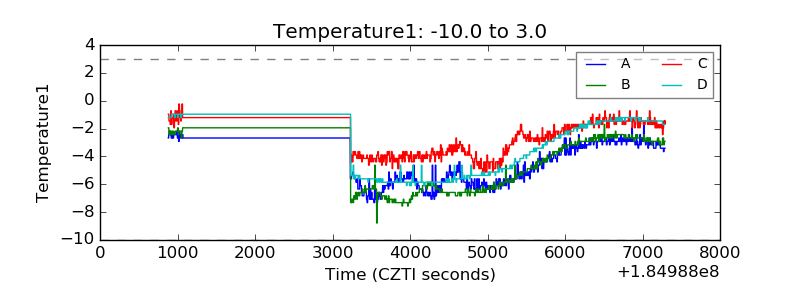 |
| Veto HV Monitor | 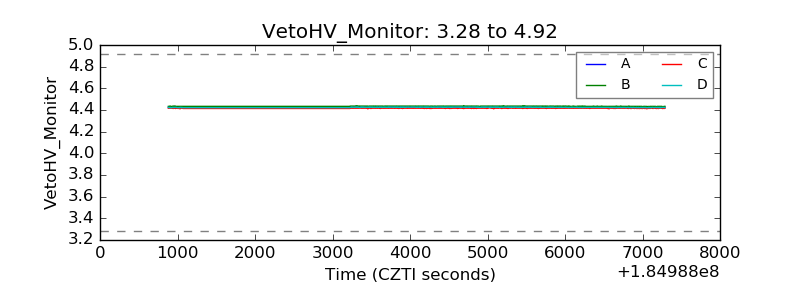 |
| Veto LLD |  |
| Alpha Counter | 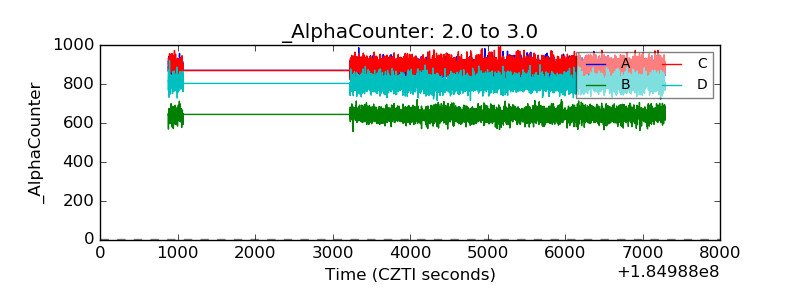 |
| _CPM_Rate | 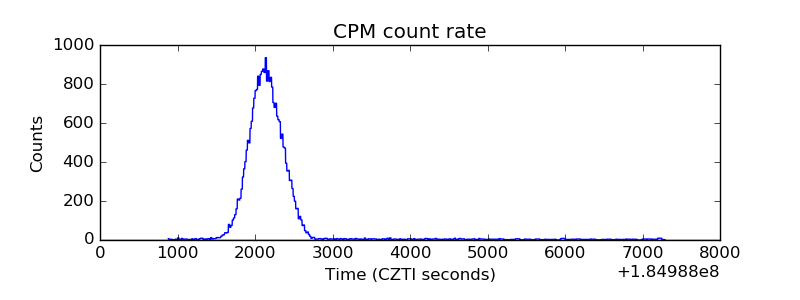 |
| CZT Counter | 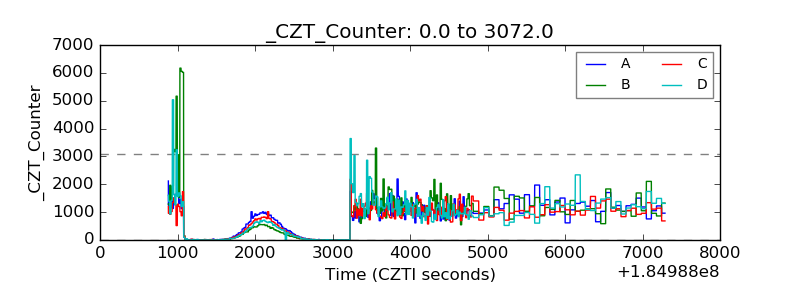 |
| +2.5 Volts monitor |  |
| +5 Volts monitor |  |
| _ROLL_ROT | 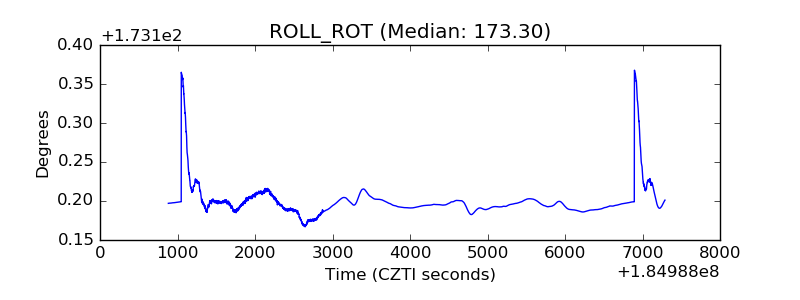 |
| _Roll_DEC |  |
| _Roll_RA | 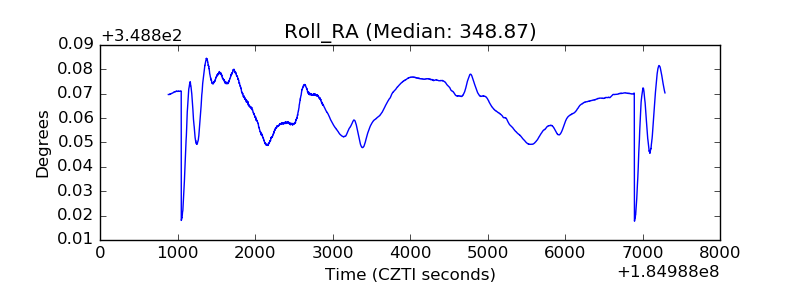 |
| Veto Counter | 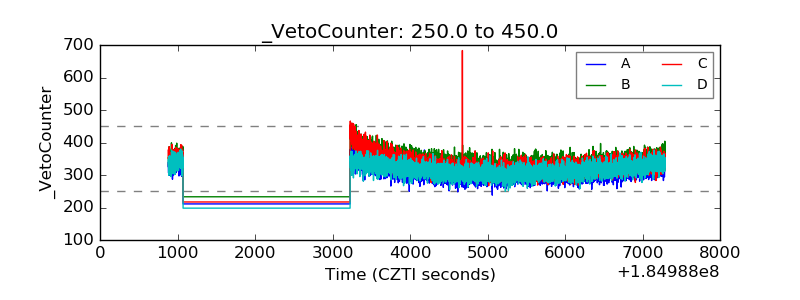 |